Glycemic index revisited, again, etc.

The glycemic index (GI) ranks foods based on how high 100 grams (~3.5 oz.) of them make go your blood sugar.  Dietary simple sugars like sucrose (table sugar) and glucose (e.g., Gatorade) have high GI’s because they are quickly digested and absorbed.  Fats and proteins register low on the GI because, well, they don’t provide any glucose.  Complex carbohydrates and fibres are intermediate.  And most important, mixed meals have a low to intermediate GI.  It was once dogma that only high GI foods caused weight gain, but a plethora of somewhat disappointing studies have shown that 1) a low GI diet doesn’t protect lean people from weight gain, and 2) switching from a high to a low GI diet doesn’t facilitate weight loss.  Glycemic load (GL) was then introduced which incorporates the amount of the food consumed, such that low GI foods could have a high GL if enough was eaten at once.  This fared slightly better than GI, but in the end, the total amount of carbohydrates turned out to be more important than the type of carbohydrates. IOW, WRT glycemia and body weight, quantity outweighs quality.  But that doesn’t stop the researchers from testing it … over and over again (on the taxpayers dime!).  In their defense, epidemiological studies have demonstrated a very modest relationship between GI/GL and disease risk, just not with body weight, adiposity, etc.

For example,

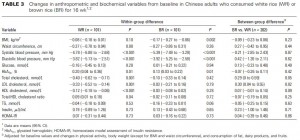
Substituting white rice with brown rice for 16 weeks does not substantially affect metabolic risk factors in middle-aged Chinese men and women with diabetes or a high risk for diabetes (Zhang et al., 2011 Journal of Nutrition)

I like this study for its practicality.  It is a real-life, highly “do-able” intervention, which is usually a critical concept in interpreting and applying the results from dietary intervention studies.  Switching out white rice for brown rice, easy enough!  The entire population was Chinese, who ingest phenomenal amounts of rice anyway (>30% of total calories… daily!), so attrition was not a problem.  And as wonderfully illustrated in the chart below, making the switch for 4 months had no effect whatsoever (see the P-values in the far right column).


LDL cholesterol went down slightly more in the white rice group, but this is biologically insignificant.  All other metabolic parameters were unchanged.  For those who like to nit-pick, BMI went down slightly more in the brown rice group while waist circumference went down slightly more in the white rice group, meaning that body composition may have been more favorably affected by white rice :/

This study is reminiscent of a much larger and more important one by none other than Willett and his Harvard cronies in a population of Brazilian women:

An 18-mo randomized trial of a low-glycemic-index diet and weight change in Brazilian women (Sichieri, Hu, Willett et al., 2001 AJCN)

This study was of a similar design; although they targeted both GI and GL.  The intervention was more robust; there were much bigger dietary differences between the groups, probably because Willet’s crew has virtually unlimited resources, but this didn’t change the outcome.  Total carbohydrate (60% of kcal), fat (27%), and protein (13%) intakes were the same but GI and GL were almost 3 times greater in the high GI (HGI) group compared to the low GI (LGI) group.  FTR, “3 times” is a really big difference… IOW, if GI or GL had any effect whatsoever, they would have detected it from a mile away.

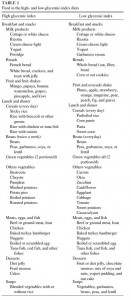
For those who were wondering what exactly comprises a low or high GI diet, a sample menu was provided:

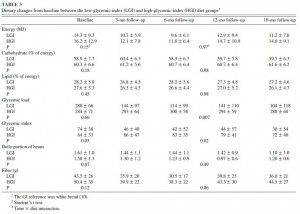
As seen in the table below, there were no dietary differences other than GI & GL between the groups (meaning it was a well-controlled intervention; kudos):
And as illustrated in the figure below, GI and GL had no effect on body weight:
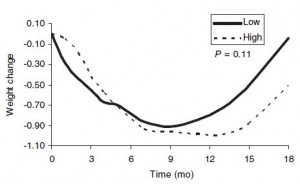
N.B. the scale of the abscissa- it encompasses one kilogram (2.2 pounds); thus, it should look more like this:

Anyway, it looks like both groups lost a LOT of weight, but really their body weight declined very slightly by about 1-2 pounds, then slowly creeped back up (over the course of 18 months).  AND for those nit-pickers, it looks like the low GI group ended up slightly heavier! (not really, as the difference was very small and statistically insignificant). IMHO, WRT GI & GL, the Willet study is compelling.  It was of the highest quality study design: a randomized, controlled, intervention (as opposed to less conclusive or meaningful epidemiological, observational, cross-sectional, etc., studies).  So what was the rationale to re-test GI & GL in a much smaller study with a weaker intervention (brown vs. white rice)?  Beats me!  But the notion that a low GI or GL favorably affects body weight will not go away.  Carbohydrate quantity not quality is the major determining factor.

AND as blogged extensively on HERE, potato chips were the most obesogenic foods in one hyooge study.  potato chips have a relatively low GI, around 55.


calories proper


Nutrition under attack

Global nutrition is in a state of emergency

Tax this:

Not this:


If you catch a whiff of anyone talking about a dietary fat tax here in the states, attack!  Hold no bars.

Passage of the Danish saturated fat tax confirms the shit hit the fan.  They should’ve taxed people for being fat (to offset the increased medical and healthcare costs associated with obesity), or sugars (for making people fat).  Instead, the food companies, famous for crafting thousands of varieties of Danish pastries, lobbied for the taxes to be levied against dietary fat.  This “inadvertently” encourages people to consume more Danish pastries with only 7 grams of saturated fat yet 39 grams of sugar!  The tax will favor Pop Tarts over eggs, and this is supposed to make people healthier?

A dietary fat tax is particularly troublesome because it strikes an expensive blow against real whole foods like eggs, butter, and meat, while leaving unscathed processed foods like doughnuts, refined grains, and SUGAR.  This disproportionately affects healthy foods that are in no way responsible for the obesity epidemic.

My suggestions:

1)      Leave people alone.

2)      A better target, which would entail markedly less collateral damage, is “added” sugars.  Taxing “added” sugars would hit soda, processed food-like products, snacks, and junk food… lots of bad guys, few good guys

3)      Make a tax based on empty calories: foods with a higher ratio of calories to nutrients get taxed more than nutrient-dense foods… thus, people would be eating fewer calories but more nutrients!  That wasn’t too hard?

4)      Tax food in direct proportion to its shelf-life.

5)      The revenue from any of these alternative options should be put toward nutrition education programs in elementary schools.  And a portion of the money saved in healthcare costs should be redirected into funding research in the nutritional sciences.  And the rest can be used to pay off the National debt.


Calories proper


Empty calories V

The final horcrux!  Empty calories induce a feed-forward loop that promotes  over-consumption. … the following evidence is indirect, of course, but very compelling.

Food intake measured by an automated food-selection system: relationship to energy expenditure (Rising, Ravussin, et al., 1992 AJCN)

This study was designed to validate a new technique for measuring food intake; it had nothing at all to do with “empty calories.”

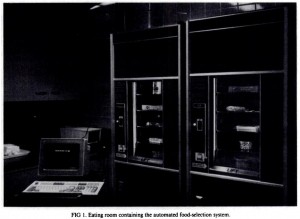
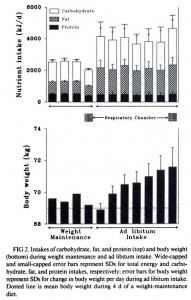
10 lean, healthy young men.  During a 4-day run-in period, the amount of calories required to maintain energy balance was measured with extreme precision.  Then for 7 whole days, they lived in a metabolic ward and dined from … wait for it … “vending machines.”


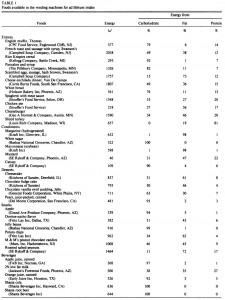
The vending machines were loaded with entrees, snacks, and beverages, [sic]: “familiar and preferred foods,” aka a “cafeteria diet.”  And I was delighted to see they also published the menu:


This study fit so perfectly because the Empty Calories series’ singular major thesis is: empty calories promote over-consumption.  And this can be tested by examining the two logical extremes: 1) a diet devoid of empty calories is inherently healthier, and any increase in the amount of empty calories consumed is accompanied with a decrease in health outcomes; and 2) eating more empty calories will not be balanced by eating less of something else, because empty calories are nutritionally bankrupt and do not affect satiety proper.  And this menu, oh yes, is almost entirely empty calories.

The researchers purposely filled the vending machine with individually packaged processed foods because of their convenience; it’s a very easy way to measure food intake, which was the focus of their study.

The following figure is absolutely nuts; you couldn’t make this stuff up.  like it was mathematically designed to support the Empty Calories credo.


It started immediately on day 1 of “ad libitum intake;” food intake doubled- the food was so nutrient poor that twice as many calories were necessary to satisfy their appetite.

Where did all those excess “empty calories” go?  Some (~17%) were spontaneously burned off (increased 24h EE) but most were invested in the infamous negative-yield* calorie savings banks (i.e., adipose).  [*you don’t get back more than you invested].


Side note: check the numbers, an overconsumption of 10975 kJ/d = 2622 kcal.  For 7 days = 18,353 kcal; which is approximately the amount of energy in 5.2 pounds (2.4 kg) of fat tissue.  They gained 2.3 kg, just a hair less than mathematically predicted (so much for spontaneously burning off 17% of the excess).  Body composition was not measured, but given the huge increase in carbohydrate intake, I imagine insulin levels were through the roof driving all of the excess energy into fat mass.

This has been confirmed numerous times.  For example, Larsen et al. (1995):


When fed the “cafeteria diet” from vending machines, these women almost doubled their food intake and gained a full pound of fat in under a week.  But I digresss.

“And this can be tested by examining the two logical extremes: 1) a diet devoid of empty calories is inherently healthier, and any increase in the amount of empty calories consumed is accompanied with a decrease in health outcomes; and 2) eating more empty calories will not be balanced by eating less of something else, because empty calories are nutritionally bankrupt and do not affect satiety proper.”

The second postulate has been addressed and sufficiently supported by Ravussin’s vending machine study (above).  Fortunately for us a study that addressed the first postulate was blogged on previously.


Remember now?

(Hashim and Van Itallie, circa 1965)


When fed a bland yet nutritionally complete diet, obese subjects spontaneously and drastically reduced their food intake, and body weight plummeted for EIGHT STRAIGHT MONTHS.  Although this was confirmed a decade later by Cabanac and Rabe (1976), it only indirectly supports the first postulate because it was not real food.  But it proves the point that nutrient sufficiency supports satiety, and this can be dissociated from total calorie intake.  IOW, if the diet provides the essential nutrition, then the remaining daily energy requirement can be met by burning excess fat mass stored in adipose tissue.

avoid ‘empty calories’ and cash out


calories proper


Empty calories IV

Welcome to the fourth installment, empty calories in everyday life

on feeling “full”

fullness can be manipulated by a variety of things, but never truly fooled.  Try drinking a fiber-rich beverage (e.g., Metamucil) right before mealtime and then eat slowly… you will feel full much sooner.  This may even cause you to eat less, but it won’t last … it’s not an effective long-term weight loss or weight maintenance strategy.  and it might even do harm… fiber makes you feel fuller faster by expanding (absorbs water) in your GI tract- it will stretch out your stomach a bit.  When you run out of it, or decide enough is enough, your stomach will feel emptier than usual, which will increase the amount of food necessary to make you feel “full.”

In the example above, that fiber drink would be considered to have a very low energy density.

on energy density

“Energy density” is bunk.  Ha!

But really, advising someone to consume a “low energy density” diet is wrong.  The rationale underlying “low energy density” diets is that fat, the macronutrient, contains 9 calories per gram, whereas carbohydrates only have 4, less than half.  Thus, there is >2x the amount of energy contained in a gram of fat than in a gram of carbs, i.e., fat is more energy dense.  However, when it comes to real food (food, not macronutrients), things change.  E.g., crackers are promoted as a healthy snack for low energy density dieters because crackers are very low fat (4% by weight) and thus low energy dense.  Red meat, on the other hand, has a high energy density (fat content 20-30% by weight)…  but wait, are those statistics referring to macronutrients … or food?

100 grams of crackers can have anywhere from 393 (Saltines) to 492 (Ritz) kilocalories, but 100 grams of red meat has 258 (Porterhouse) – 332 (ground beef) kcal.  Since things like water content vary widely among different foods, the energy density of macronutrients is not the same as that of the foods we actually eat.

on snacking

Think of a meat-eater you know.  Regardless of how much they love steak, they couldn’t eat it until they were sick.  But watch a little kid eating snacks, for example.  especially kids, who are more vulnerable than adults to obesogenic foods.

Most non-animal food sources (rice, pasta, beans, potatoes, etc.), including snacks, lack one or more nutrient or essential amino acid and are therefore considered nutritionally inadequate.  WRT to nutritional deficiencies: for practically every nutrient, the “at-risk for deficiency group” is almost always vegetarians (and/or alcoholics).

Snacks and plant-based foods are nutritionally incomplete; we might overeat them because of this.  Perhaps protein, EFA, & nutrient sufficiency is detected by the satiety systems in our brain.

It is difficult but not impossible to eat a nutritionally adequate vegetarian diet (sans industrial fortification), but it’s practically impossible to be nutritionally insufficient if a small variety animal foods are included in the diet (eggs, red meat, salmon, chicken, etc.)… low chance of success in the former vs. low chance of failure in the latter?

A can of Pringles has more calories than a dozen eggs (900 vs. 852 kcal).  But it’s virtually impossible to eat a dozen whole eggs, partially because that’s gross, but also possibly because just a few eggs provide more than enough nutrition to signal into the satiety system.  IOW, it’s much easier to overeat empty calories.

Snacks make people fat, in part, because they are designed to be tasty but provide little nutrition.  If snack foods provided adequate nutrition, they would satisfy our hunger and we’d eat [and buy] less.  The tasty flavors make us want and like them, and the lack of nutrition prevents us from becoming satiated.

Nutrient density FTW.


calories proper


Empty calories III

Empty calories.  Nutrient density.  Empty calories.  The ANDI score?

With the advent of the ANDI, it is safe to say the phrase, school of thought, and cult following to “a calorie is a calorie” is fading.  All calories were not created equal; some make you fat, others make you strong.  Cantankerous old biochemists and low-fat diet proponents will likely remain loyal, however, with the former citing heat production in a bomb calorimeter (mumbo), and the latter citing the equivalency of nutrient density and animal fat scarcity (jumbo).

But for the rest of us, there is gravitas in this concept       empty calories.

A good place to start might be a critical view of Fuhrman’s  Aggregate Nutrient Density Index (ANDI).  In brief, ANDI is an index of healthiness and is calculated by dividing the amount of nutrients in a given whole food by the calories.

Pro’s and con’s

1)      it only applies to whole foods.  This is convenient because most processed foods would score miserably low unless they’ve been industrially fortified with synthetic vitamin-like chemicals.  Perhaps Fuhrman restricted ANDI to whole foods because something like Diet Coke Plus would score about a million (lots of vitamins, few if any calories), rendering ANDI utterly meaningless to the masses and downright offensive to people like me.


2)       “nutrients per calorie” is a far more biologically meaningful and physiologically relevant concept than “calories per gram.”

  1. “Calories per gram” can be too easily manipulated.  E.g., one ounce (~28 grams) of soybean oil has 248 kilocalories: 248 kilocalories / 28 grams ? 9 kcal/g.  Add it to an ounce of water and you get 248 / 56 ? 4.4 kcal/g.  It’s still the same nutritionally, but the “caloric density” was halved by trickery.
  2. “Nutrients per calorie” is relatively unchangeable.  Let’s say there are 14 grams of omega-6 fatty acids in an ounce of soybean oil; that would be 14 grams per 248 kcal.  Add it to an ounce of water and it’s still true.  Drink it on the moon and it’s still true (relatively).

However,

1)      ANDI selectively quantifies only one aspect of a food’s nutritional value.  It is an important aspect, but please note that a diet based on high ANDI foods would be nutritionally inadequate.  Furthermore, there are highly relevant health parameters that ANDI completely ignores.  More questions:

  1. Shouldn’t more important nutrients be given a higher score?
  2. Shouldn’t excess amounts of a nutrient detract from the score?
  3. What about other non-nutritive health-promoting properties of a food?  E.g., foods that are healthier than indicated by their ANDI score:
    1. i.      foods that have some as-of-yet undiscovered nutrients
    2. ii.      foods that indirectly promote health (like pre- or pro-biotics)

2)      Furthermore, ANDI is fundamentally flawed in its application to foods whose value is based at least partially on the actual calories themselves.

  1. Fuhrman uses the ANDI score on fats, which score dismally low because they contain few “nutrients” and a lot of calories.  Thus, industrially-modified, partially-hydrogenated trans fat-rich soybean oil has the same ANDI score as olive oil.
  2. Animal proteins, including grass-fed beef, wild salmon, and pastured eggs, also score incredibly low.  These foods are far more healthful than many most others, essential for life (unlike kale, which is the highest-scoring ANDI food), and much of their value is contained in the quality of their calories.
    1. i.      the fatty acids in salmon are healthy in and of themselves; they don’t contain any nutrients per se; they ARE the nutrient.  But ANDI doesn’t take this into account; it views all fatty acids as empty calories, a grave mistake.
    2. ii.      the same goes for animal proteins.  Eggs, for example, are higher in protein quality than any other food on the ANDI scale yet they score quite low.  And getting a bio-equivalent amount of protein from lower quality plant proteins would require consuming many more calories.

The failure of ANDI to incorporate any measure of fat or protein quality is its demise; why it is unable to stand alone as an indicator of healthiness… a diet consisting exclusively of high ANDI foods is incompatible with life.  A protein deficiency would be vastly more severe than a low ANDI diet, and on a lighter note, the fish oil fatty acids would provide much greater benefits than a high ANDI diet.  These nutritional factors play too big a role in determining healthspan and quality of life to be ignored.

BUT, ANDI is nice in its simplicity, and it works very well for most plant-based foods.  E.g., spinach and cabbage have very high ANDI scores; rice, grains, and pasta have very low ANDI scores.

The diets of many cultures are based almost exclusively on low-ANDI foods.  This is largely because it is much easier to produce enough calories to feed a village than to produce enough nutrients.  Starvation is deadlier than dermatitis.  In the Western world, however, we are fighting a different battle: you need to eat a LOT of empty calories in order to get enough nutrients, but then you get fat.


calories proper


Empty calories, II

You should be ashamed of yourself!

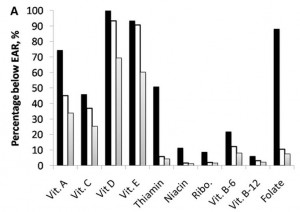
Foods, fortificants, and supplements: where do Americans get their nutrients? (Fulgoni et al., 2011 Journal of Nutrition)

The Journal of Nutrition just published an analysis of micronutrient intake in healthy Americans.  The dataset came from the National Health and Nutrition Examination Survey (NHANES), which is run by the Centers for Disease Control (CDC)  and the National Center for Health Statistics (NCHS).

The USDA database was their primary source for nutrient information, but the Food and Nutrient Database for Dietary Studies (FNDSS) and Nutrient Database for Standard Reference (SR)  were also consulted when appropriate values were unavailable.  As the authors faithfully noted in the methods section, these registries are not perfect, but they really did do a lot of footwork to get accurate, up-to-date data.

Importantly, intake from whole foods, processed foods, and supplements was differentiated.  AND bioavailability was taken into account!   Kudos.

Shamefulness: over half of you are not getting enough vitamins D and E, and many are not getting enough vitamins A and C, and magnesium and calcium.

And if it weren’t for processed foods, too many of you would be consuming too little thiamin, niacin, riboflavin, and folate!  Why are you dependent on processed foods for vitamin sufficiency!?!

In the graph below, the higher the solid bars, the more people are vitamin insufficient if only whole foods are considered.  Notice that when processed foods are taken into consideration, the values are much lower for thiamin, niacin, riboflavin, and folate (open bars).  And supplements don’t add a whole lot to the picture (shaded bars).

Supplements don’t change the big picture very much because, well, who takes supplements?  Healthy people.  Healthy people who are probably already getting enough vitamins and minerals from the whole foods in their diet.  Someone who lives on fast food, soda, and crisps probably doesn’t care enough about their health to swallow a multivitamin every morning.  However, their intake is not suboptimal because they don’t take a multivitamin pill, it’s suboptimal because their diet contains too many empty calories!

TO DO: from whole food sources (i.e., not empty calories), get more:

Magnesium: spinach

Vitamin A: red meat, chicken, spinach, kale

Vitamin C: berries, broccoli, kale, peppers

Vitamin D: salmon/fish, whole eggs, red meat, liver

Vitamin E: spinach, nuts, fish

Potassium: spinach, tomatoes, beans


And while “adequate is adequate,” stop relying on processed foods and start eating more whole foods for:

Folate: foliage (leafy vegetables like spinach), also high in turkey, chicken, beans, etc.

Thiamin: pork, and lesser amounts in liver, whole eggs, nuts

Iron: red meat


processed foods are empty calories.  a processed food that has been chemically fortified with a synthetic vitamin cocktail is still “empty calories” in my book.  And although frank toxicity is rare, processed foods are close to providing too much of certain nutrients, e.g., niacin, vitamin A, folate, and zinc.  Stick to whole foods, and don’t overdo it with your kids- they were more likely than adults to be getting too much zinc, niacin, vitamin A, and folate, and the overage was largely due to processed foods.


Calories proper


Empty calories, part I

Empty calories, part I


Moderation- the avoidance of excess or extremes

Balanced- arranged in good proportions

What is a well-balanced diet?  Everything in moderation?

WRT nutrition, these phrases are meaningless.  There are healthy people around the world who consume a wide variety of diets.  A dietary staple in one culture may be completely absent or even shunned from another equally healthy culture.  And that same dietary staple could be the cause of disease in yet another culture.  Furthermore, “moderation” and a “well-balanced diet” are generally used reflectively, whereby the speaker is referring to their own diet as the healthy baseline, and any deviations can be included but only in “moderation,” as any deviations would certainly be less healthy, otherwise the speaker would be touting that diet instead.

Does it refer to whole foods, or the individual food components.  IOW, should we consume in moderation processed foods? How about the trans-fats found in hydrogenated soybean oil from said processed foods?

If a diet contains 100 grams of fat how much of that would be considered “moderate?”  Half?  Not if we are talking about industrial trans fats.  Certain foods should be minimized or avoided altogether…  neither in moderation nor as part of a well-balanced diet.

For a very basic example, carbohydrate’s provide ~62% of the calories for Indian city-dwellers, yet the rate of carbohydrate intolerance is 14%!

Dietary intake and rural-urban migration in India: a cross-sectional study (Bowen et al., 2011)

But the Kitavan’s get 69% of their calories from carbohydrates and there isn’t a diabetic on the entire island!

How can this be?  There are too many confounding variables to put an exact number on “moderation.”   The Indian urbanites from Bowen’s study consumed over 3,200 kcal per day, while the Kitavans are closer to 2,100…  But ¾ of the Kitavans smoke and they get little physical activity…?

Low serum insulin in traditional Pacific Islanders—the Kitava Study (Lindeberg et al., 1999 Metabolism)

The “well-balanced diet” does not exist.

The Mediterranean diet might be optimal for people living in Italy and Greece, but the long-term consequences of mismatching diet and the seemingly infinite lifestyle variables confounds the application of this to other cultures.  And even within a given culture, there will be pen pushers and manual laborers who would be optimally suited with vastly different macronutrients and calories.

And the reverse is also true.   Exercise and a high level of physical activity may keep one population lean and fit, but that doesn’t mean increasing exercise and physical activity will prevent a different population from becoming obese.

Physical activity energy expenditure has not declined since the 1980s and matches energy expenditure of wild animals (Westerterp and Speakman, 2008 International Journal of Obesity)

WRT nutrition, “moderation” is meaningless.


Calories proper

an elusive rogue criminal mastermind

Hyperinsulinemia.  Whether it’s caused by insulin resistance, too many carbs, or industrial insulin secretagogues found in processed foods, high insulin levels are problematic.

Octreotide is a synthetic version of somatostatin and it inhibits the secretion of a variety of hormones, namely insulin.  A group of researchers set out to determine the effects on obesity of pharmacologically lowering insulin via octreotide.  In this setting, it doesn’t matter how insulin became elevated in the first place, only whether reducing it has any impact on obesity.

A multicenter, randomized, double-blind, placebo-controlled, dose-finding trial of a long-acting formulation of octreotide in promoting weight loss in obese adults with insulin hypersecretion (Lustig et al., 2006 International Journal of Obesity)

Octreotide dosing is surprisingly convenient, monthly injections, and there were no other dietary or behavioral interventions.  Lustig’s hypothesis was simply that high insulin levels were making things worse, like causing weight gain and hunger, preventing weight loss, etc.  The intervention was only octreotide; no dietary or behavioral interventions…. Another way of thinking about this hypothesis is: if dietary or behavioral factors were contributing to the obesity phenotype, then perhaps high insulin levels were in part causing those very same dietary or behavioral factors (?).  That seems backward, like an enigma wrapped in a riddle surrounded by a mystery, but this study addressed the possibility by also assessing a variety of psychological and dietary/behavioral factors (whether these could be caused by reduced insulin levels, per se, as opposed to some other effect of octreotide would be difficult to determine, but this study demonstrates the possibility).

This was a population of relatively young (~40-ish), fairly heavy (~240 lbs), but otherwise healthy subjects.  And most of them stayed in the study for the entire duration (which means, in part, that octreotide isn’t an unpleasant therapy).

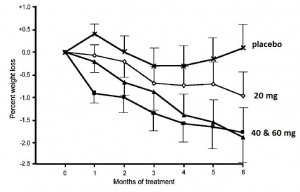
To make a long story short, octreotide worked, but not very well…


In the table above, the “mean percent change from baseline” was less than 2%, which amounts to about 4 pounds (in 6 months).  As a graph (note the ordinate):


But the treatment was well-tolerated, and a variety of quality of life measurements were significantly improved, such as physical function, self-esteem, and sex life.  And interestingly, “carbohydrate cravings” were significantly reduced, which suggests the possibility that high insulin levels may in part be self-promoting.

Although a more selective drug would have been preferable to the pan-inhibitor octreotide, another interpretation of the modest weight loss results presents itself.  A recent study by Willett, which I previously blogged about showed that in general, people gain about a pound a year and some of the largest contributors to that weight gain are potatoes, potato chips, and French fries.  All three elicit a robust insulin response, and the latter two most likely contribute to other metabolic abnormalities which also lead to elevated insulin levels (insulin resistance, insulin hypersecretion, etc).  The current study demonstrated the possibility that high insulin levels, per se, might be an important cause of weight gain or the maintenance of an obese state.  AND carbohydrate craving was reduced by octreotide.  Willet’s study showed that foods like potatoes, which cause high insulin levels, are associated with weight gain.  Lustig’s study showed octreotide reduces insulin levels, which reduces carbohydrate cravings and leads to weight loss.  Abandon carbs?  Monthly octreotide injections?  Going on the Atkins diet would cause a much more rapid weight loss than octreotide, but octreotide therapy would cause literally zero lifestyle disruption… and the speed of weight loss would be closer to the how fast the weight came on in the first place.

On a more philosophical note, there is a subtle continuity between the magnitude of weight change and the foods implicated in Lustig’s and Willet’s studies.  On one hand, the most influential foods associated with age-dependent weight gain were starchy carbs (which induce insulin secretion); on the other hand, lowering insulin via octreotide reduced carbohydrate cravings and caused weight loss.  It’s difficult to clearly connect these observations with eloquence, but they seem to suggest a strong correlation.  The rate of weight gain associated with ‘potatoes, et al.’ was slow, similar to the rate of weight loss with octreotide…

So if you likened the cause of obesity to an elusive rogue criminal mastermind, and the cure to a cunning stealth superhero, then you’d be unimpressed with “potatoes” and “a few pounds gained or lost.”  …  obesity doesn’t happen overnight.


Calories proper


the boob tube

it’ll kill you!  (too much, i.e.)

OK, FTR I don’t think any amount of TV watching will kill you, and I think that any study showing otherwise is under the control of some major food company , big pharma, or downright statistical sorcery.

Playing in traffic? Perhaps.  Watching TV? No.

Without further ado, some recent studies showing I’m wrong.

Television viewing and risk of type 2 diabetes, cardiovascular disease, and all-cause mortality (Grontved and Hu, 2011 JAMA)

First, a meta-analysis.  Not good.  The first paragraph in the intro starts out with [sic]: “40% of daily free time is occupied by TV viewing within several European countries.”  At first, 40% seems like a lot; how much “free time” do we really have?  Sleep 8 hours, work 8 hours, commuting to and from work, chores, eating, showering, etc… so maybe 3 hours of free time?  40% of 3 hours = 1.2 hours.  But the authors cite “4 hours” of TV viewing which means these people have almost 7 hours of free time per day… which means commuting to and from work, chores, cooking & eating, showering, etc. only takes about 1 hour (unless they either don’t work or don’t sleep.  IOW 7 hours seems like a horrendous overestimate.  There are a few other inconsistencies in the intro, but rather than spend more time nit-picking, on to the data:

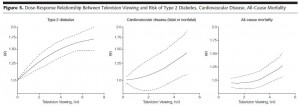
To make a long story short, every additional 2 hours of TV viewing per day increased the risk for:

Type II diabetes by 0.0176%

Fatal CVD by 0.0038%

All-cause mortality by 0.0104%

And just to be clear: yes, those are very very small numbers.

The authors searched relevant databases for every study on the topic, excluded the ones that didn’t support their hypothesis (jk… kind of*), and then independently analyzed the resulting studies.  Any disagreements were “resolved by consensus,”  which I’m not exactly clear how is accomplished when there are only 2 authors (rock, paper, scissors?).  In their favor, whenever possible the data were analyzed with and without diet and body weight in their multivariable-adjusted models.

*out of 1,655 relevant studies, 8 (agreed with their hypothesis [jk… kind of]) were included.

Divide and conquer

As seen above, increasing hours of TV viewing is associated with increasing risks for diabetes, CVD, and all-cause mortality.  Yikes!

The risk for diabetes was linearly related with TV viewing, but the risk was modestly attenuated by controlling for diet, and greatly reduced by controlling for body weight… IOW a poor diet is bad but excess body weight is worse (lean people can watch more TV than obese people).

Risk for all-cause mortality was less than CVD and diabetes and wasn’t affected by diet or body weight.  The inflection was around 3 hours…  which means that the risk dying isn’t appreciably increased by TV viewing if you watch less than 3 hours per day.  Phew!  (the applies to adults only).  In sum, 3 hours seems to be a safe amount of TV for lean healthy people; less if obese or pre-disposed to diabetes.

Something similar was found in an EPIC study.

Television viewing time independently predicts all-cause and cardiovascular mortality: the EPIC Norfolk Study (Wijndaele et al., 2011 International Journal of Epidemiology)


Although the overall risk for all-cause mortality associated with increased TV was about a third less than in Hu’s meta-analysis, it was 1) statistically significant, and 2) unaffected by diet or body weight (similar to Hu’s findings).


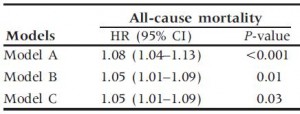
The relationship between TV viewing and all-cause mortality was attenuated after controlling for a variety of confounding factors (HR Model A = 1.08, p<0.001; HR Model B = 1.05, p=0.01), which means that someone who watches a lot of TV also has other risk factors which contribute to their risk of dying that have nothing to do with TV (like smoking, for example… unless they smoke because of the show their watching [?]).

Interestingly, the relationship was unaffected by controlling for physical activity (compare HR in Model B to Model C), which seems to imply that sitting too much (watching TV) is not necessarily equal to exercising too little… and in this population, ‘exercising too little’ was statistically unhealthier than ‘sitting too much.’

one from down under:

Television viewing time and mortality.  The Australian diabetes, obesity and lifestyle study (AusDiab) (Dunstan et al., 2010 Circulation)

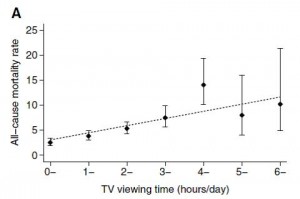
In AusDiab, TV increased the risk for all-cause mortality slightly moreso than EPIC-Norfolk, but was similarly attenuated by controlling for other risk factors:


Oddly, there is a blip at 4 hours in both AusDiab and EPIC-Norfolk.  I have no idea what this means, but it is very interesting that in both England and Australia, people who watch 4 hours of TV per day have a higher risk for all-cause mortality than those who watch for 3 or 5 hours… if you find that you’ve spent 4 hours watching TV one day, throw on a pot of coffee and watch another hour.  Food for thought.

WRT health outcomes, excessive daily TV viewing seems to be a marker for other risk factors such as obesity, smoking, etc (may even be an indirect marker for ‘family history of CVD, diabetes, etc.).  TV watching per se is not the problem, nor is I suspect the TV.  Eat less, move more?

calories proper
 

n = 1,570,808

the correlation between time spent watching TV and body weight may have nothing to do with the common thought that if kids aren’t watching TV, they’re out playing.  No, it turns out that kids who watch less TV eat healthier.  They sit around just as much … just not watching TV.  Is there something about mindless sitcoms and cartoons that make us want to eat junk food … or snack … wait a minute … subliminal commercial advertising?

Is any of this true?  probably not.  But if I were to test it, I’d like an intervention study with a couple randomized groups including: one whose TV commercials were strategically replaced with equally fun commercials that don’t promote snack foods; a group of kids who don’t watch TV; and maybe a group who doesn’t watch TV but is exposed to subliminal snack-promoting advertisements…   food for thought.

Changes in diet and lifestyle and long-term weight gain in women and men (Mozaffarian, Hao, Rimm, Willett, and Hu, 2011 NEJM)

This is one of the biggest and longest running prospective studies on diet and lifestyle behaviors.  That’s not to say it’s the best study; epidemiological, observational, and prospective studies are subject to a variety of crippling limitations; but this one is big.

It is a compilation of three big studies that I’ve blogged about in the past:

The Nurses’ Health Study (NHS, n=121,701, est. 1976)

The Nurses’ Health Study II (NHS II, n=116,686, est. 1989)

The Health Professionals Follow-up Study (HPFS, n=51,529, est. 1986)

All in all, a total of 1,570,808 person-years were analyzed (person-years: 16 people x 2 years = 32 person-years).  The biggest finding?  everybody gains weight, about 0.835 pounds per year.  It doesn’t sound like much but after 20 years it means you’re 15 pounds fatter.

The second biggest finding?  Drumroll please…

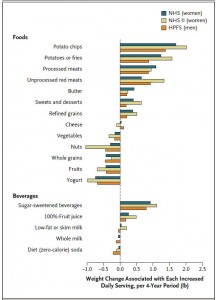
First, to set the mood: people don’t gain weight magically.  This study was unique in that there were multiple dietary assessments, performed over a very long period of time, in the same group of people.  And one way people gain weight is by eating more.  So these authors were able to see which foods, when increased in the diet, correlated with weight gain.

And the winner was, somewhat surprisingly, potatoes!  Actually number 1 was potato chips, and number 2 was potatoes and French fries or crisps.  The surprise, IMHO, was that soda and junk food was much further down the list.  Furthermore, I might have thought potato chips could be number 1 because of their high trans-fat content, but the presence of potatoes (which lack trans-fats) at number 2 means that trans-fats are not the obesogenic component of potato chips.

The figure (kudos for data presentation):

To quote the study [sic]: “Strong positive associations with weight change were seen for starches, refined grains, and processed foods.”  WRT study design, such conclusions cannot be interpreted to mean: eating less “starches, refined grains, and processed foods” will prevent weight gain.  It means body weight was determined by changes in the amount of “starches, refined grains, and processed foods” were in the diet… if any of those foods were increased, body weight increased; and if any of those foods decreased, body weight decreased. (note: this study was not designed to determine causation).

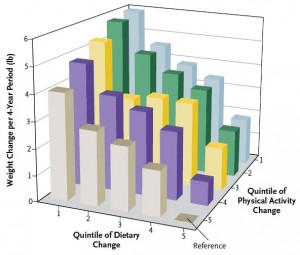
Exercise was also included in their analysis.  Another good-looking figure, albeit a little more complicated:

Think of the bottom left (front?) as the sum of good dietary changes (associated with weight loss [or less weight gain]).  People in the first “Quintile of Dietary Change” increased their consumption of “starches, refined grains, and processed foods” and gained the most weight, while those in the fifth quintile ate less and lost weight or stayed the same.  A similar trend for physical activity is displayed on the bottom right part of the figure.  People in the first quintile increased their physical activity, while those in the fifth quintile reduced their physical activity.  If you compare the amount of weight gain from the fifth to the first quintiles of dietary change (all the purple bars, for example), the amount of weight gained is highly dependent on diet.   However, within any given quintile of dietary change, not much weight is gained or lost by changing the amount of exercise (follow any set of bars from gray to purple to yellow to green to blue).  IOW, at any given quintile of physical activity change, diet predicts much larger changes in body weight.  Heck, people in the second quintile of dietary change actually gained weight by increasing physical activity … that’s a bit convoluted, but it demonstrates the case that in this enormous data set, diet was a better predictor of weight gain than physical activity (which in some cases didn’t matter at all).

Eat less and move more?

Calories proper