Visceral fat (VAT) is bad, more VAT is worse; believe, or do a Google on it. And it is my contention that insulin, or more specifically diets that promote insulin spikes, hyperinsulinemia, or insulin resistance, is the primary driver of VAT accumulation.
The balance between fat accumulation and fat loss is regulated by four distinct mechanisms, which are similar in myriad biological systems:
1) Enhanced fat accumulation
2) Reduced fat accumulation
3) Enhanced fat loss
4) Reduced fat loss
They are not mutually exclusive, but small shifts in any of them can cause big changes in fat mass with vast implications for metabolic outcomes. And to complicate matters further, we are talking about two distinct fat depots which are independently regulated by those mechanisms… there are a lot of possibilities.
Subcutaneous fat (SCAT), the kind associated with a “pear” body shape, is a relatively safe place to store excess energy; i.e., safer than VAT or other ectopic depots such as liver or muscle. And in lean healthy individuals, SCAT is more sensitive than VAT to the anti-lipolytic effects of insulin. In other words, insulin favors the storage of excess energy in the relatively safer SCAT. But when insulin levels spike, insulin resistance and hyperinsulinemia develop. This causes the reverse to occur- fat mass accumulates in VAT. Fortunately, this is completely reversible by weight loss or adopting a low-insulin diet.
Evaluation of two dietary treatments in obese hyperinsulinemic adolescents (Armeno et al., 2011 Journal of Pediatric Endocrinology and Metabolism)
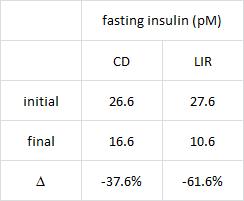
This study examined the effects of two isocaloric hypoenergetic diets of identical macronutrient composition that differed markedly in their ability to spike insulin levels for 16 weeks in 86 obese Argentinian children.
CD = control diet; LIR = low insulin response diet.
Divide and conquer
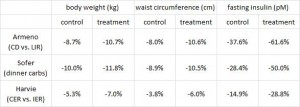
After 16 weeks, the LIR group lost more weight than CD, and waist circumference declined to a greater extent.
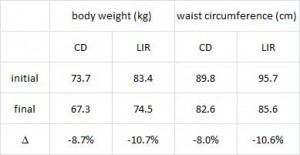 And of particular relevance to my current thesis, the decline in waist circumference was disproportionately greater (relative to the body weight loss) in the LIR group compared to CD.
Importantly, this correlated well with a greater reduction in fasting insulin levels in LIR relative to CD.
Waist circumference is a good indicator of VAT. Reduced insulin levels improved insulin sensitivity, which promoted a shift away from VAT- an example of how small shifts can have a big impact on the abundance of fat mass stored in one depot relative to another one. And this also had a functional impact on metabolic outcomes- AST, a marker of liver dysfunction, was reduced to a greater extent in the LIR group relative to CD.
Why do I attribute these effects to reduced insulin levels? Aside from the sound (IMO) biological rationale mentioned above, it occurs consistently regardless of how insulin levels are reduced.
Greater weight loss and hormonal changes after 6 months diet with carbohydrates eaten mostly at dinner (Sofer et al., Nature Obesity)
While the Armeno study in obese children (above) reduced insulin levels with a diet that didn’t spike insulin levels ever, this study did so by restricting the insulin spike to once per day, at dinner time. This was a longer study (6 months) in an older population (39 Israeli adult police officers).
Interestingly, and similar to the Armeno study, the experimental group (dinner carbs) lost more body weight and experienced a greater reduction in waist circumference than the control group.
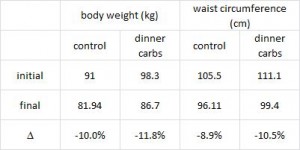 As in the Armeno study, the reduction in waist circumference was disproportionately greater in the experimental group than in controls, and this also correlated with a greater reduction in fasting insulin.
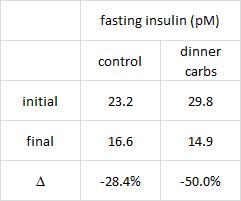 This was accompanied by functional improvements as well- the experimental group experienced a greater increase in HDL and a bigger decline in the inflammatory insulin-desensitizing cytokine TNF-alpha.
The similarities between these two studies is eery, especially given the markedly different patient populations (obese Argentinian children vs. obese Israeli cops) and study duration (4 months vs. 6 months).
 Why do I attribute these effects to reduced insulin levels? Aside from the sound (IMO) biological rationale mentioned above, it occurs consistently regardless of how insulin levels are reduced.
The effects of intermittent or continuous energy restriction on weight loss and metabolic disease risk markers: a randomized trial in young overweight women (Harvie et al., 2011 International Journal of Obesity)
This study compared the effects of a chronic 25% energy restricted diet (CER) to an intermittent energy restriction (IER) which reduced food intake only on Monday and Tuesday while allowing ad lib food intake for the rest of the week in 89 overweight young British women for 6 months.
Similar to both of the above studies, the experimental group (IER) lost more body weight and experienced a greater reduction in waist circumference than controls.
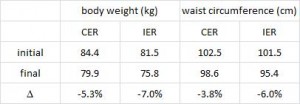 And this too was accompanied by a greater reduction in fasting insulin levels.
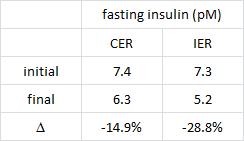 Function improvements occurred as well- the experimental group experienced a greater increase in insulin sensitivity and the insulin-sensitizing hormone adiponectin.
These findings further contribute to the phenomenally similar effects of reducing insulin levels, in three markedly different experimental paradigms (obese Argentinian children vs. obese Israeli police officers vs. overweight British women):
Why do I attribute these effects to reduced insulin levels? Aside from the sound (IMO) biological rationale mentioned above, it occurs consistently regardless of how insulin levels are reduced.
Could greater VAT loss be due to weight loss and not reduced insulin levels per se? It’s possible, but given the effects of pharmacologically reducing insulin levels (see HERE) it seems like insulin, not body weight, is the main driver.
You just gotta get those insulin levels down
- Eat fewer foods that spike insulin
- Restrict carbs to one meal per day
- Intermittent energy restriction
calories proper

