A well-designed but poorly executed crossover study is always lamentable, but never so much as when it was intending to test an interesting hypothesis, in a human population.
Enter: the crossover study.
IMHO, a crossover is the superior human study design. When properly executed, crossover study data are straight-forward, lack confounding, and the interpretation benefits from a reductionist simplicity that approaches that of an animal study.
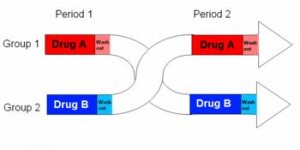
In brief, a cohort is randomly divided into two subgroups, half receive active drug and half get placebo for the first treatment period, then after a brief washout the groups switch and receive the opposite treatment.
 The subjects never know if they are receiving active drug or placebo, which prevents the placebo effect, but more importantly each subject actually receives both treatments, active drug and placebo. So we get to compare how they respond to drug with how they respond to placebo. Although it is expensive and labor intensive, the crossover study design provides great statistical power with a relatively small sample size. I am far more likely to accept crossover data at face value, because given a treatment-appropriate washout period, confounders are negligible.
With less brevity, as seen in the table below, a simple crossover study consists of two treatment phases divided by a washout period.
The most important, critical times to acquire data are
1) Baselines: immediately prior to phase I (1a and 1b) and II (1c and 1d). 1a and 1b are averaged together because they represent baseline subject characteristics before any treatment. Importantly, after the washout period time points 1c and 1d represent an identical scenario and are included as baseline subject characteristics. E.g., baseline characteristics for subject 1 will be an average of measurements made at time points 1a and 1c. The same goes for subjects 2-10, and all these values are averaged together and represent the baseline. IOW, there is ONE set of baseline data that includes EVERYONE.
2) Active drug finals: data taken immediately following active drug treatment periods (2a and 2d) are combined and represent drug effects.
3) Placebo finals: data taken immediately following placebo treatment periods (2b and 2c) are combined and represent placebo effects.
The relevant comparisons are:
1) Final values: active drug vs. placebo. These are the most common and usually most relevant data reported.
2) Final vs. baseline
- Placebo: any differences between the final placebo time points (2b and 2c) and baseline are bona fide placebo effects
- Drug: any differences between final drug time points (2a and 2d) and baseline roughly correlate with drug effects, but need to be compared with placebo effects to determine the relative contribution of each component.
A treatment-appropriate washout period is necessary to minimize any spillover effects. For example, take a 100 kg subject in a weight loss trial who is randomized to receive active drug for phase I and loses 10 kg. After phase I they will likely regain the lost weight, and this should be complete prior to phase II. If not, baseline body weight will be artificially low, and the “placebo effect” will appear to be weight gain, enhancing the apparent benefits of the weight loss treatment in question. The effects of improper washout periods are difficult to predict, but clearly don’t improve accuracy. To further the point with an exaggerated extreme example: a drug that does nothing would look great against a placebo that caused weight gain.
In conclusion, it’s hard to mess up a crossover study short of grievous errors, but they happen. Alternatively, some treatment effects may be attenuated by a rigorously designed and executed crossover study, but they are rarely exaggerated, which I believe is the better side with which to err.

