fat skinny people

The metabolically obese normal weight phenomenon
or
Fat skinny people.

In general, type II diabetes is preceded and possibly even caused by obesity.  However, there is a marked variation in the amount of excess fat mass that individuals accumulate prior to developing frank diabetes.  IOW, some people are morbidly obese for over 10 years before succumbing to diabetes while others become diabetic much sooner.  In fact, some people, known as “metabolically obese normal weight” (MONW), are technically lean (BMI < 25) when they develop the metabolic syndrome.

While genetics and environmental exposures play a role in determining the amount of fat mass an individual can ‘safely’ accumulate, nutrition is probably the most important factor.

The BMI scale was developed, in part, to specify these ‘safe,’ or more appropriately ‘healthy’ ranges of adiposity.  That is why there are sex and even international variations.  For example, a healthy BMI for people in East Asia is lower than that of Americans.  This is not because of the difference in average body weight between the two populations, but rather due to the observation than people in East Asia develop obesity-related health problems at lower levels of adiposity than Americans.

This is, in part, mediated by diet.

Characteristics of diet patterns in metabolically obese, normal weight adults (Korean National Health and Nutrition Examination Survey III, 2005) (Choi et al., 2010 Nutrition, Metabolism & Cardiovascular Diseases)

This is essentially the Korean equivalent to the United States’ NHANES

In brief, the authors of this study collected data from ~3,000 normal weight Koreans and divided them into two groups: ‘metabolically healthy normal weight (MHNW)’ and ‘metabolically obese normal weight (MONW)’ (remember everyone in both groups had a ‘healthy’ BMI; overweight and obese people were specifically excluded).  MONW was defined as having a waist circumference > 90cm (35″) for men or >80cm (31″) for women and at least 3 out of the next 4 criteria: elevated triacylglycerols, low HDL, hypertension, and impaired fasting glucose.  Basically, MONW is the Metabolic Syndrome for skinny people.

Disclaimer: The MONW population differs from MHNW in more ways than their diet and metabolic profile, and these differences probably have a lot to do with why they eat what they eat.  For example, MONW are less educated and makeless money than MHNW.  But for the purposes of this blog post, it is not why they eat what they eat, but rather what they eat.  And as seen in the table below, MONW eats fewer calories per day and a higher proportion of carbohydrates than MHNW (at the expense of protein and fat).

Divide and conquer


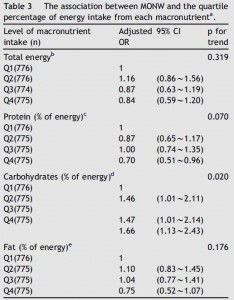
MONW ingests less protein (78 vs. 67 g/d) on an absolute basis, which is most likely why they have more fat mass at the same body weight (lower protein intake accommodates less muscle mass).  And it is this lower protein intake that most closely correlates with being metabolically obese:


Importantly, these odds ratios were controlled for confounding variables such as age and gender.  The last analysis is probably the most interesting, and it breaks down the risk of being metabolically obese by the intake of each macronutrient (in quartiles) for the entire population.


Increasing intakes of total energy, protein, or fat do not increase the risk of being metabolically obese.  Only carbohydrates significantly increased the risk across all 4 quartiles of intake.  The tolerable upper limit of carbohydrate intake was statistically extrapolated to be 59.9% of calories… which is within the recommended range of 55% – 70%.  IOW, by following the government’s dietary recommendations you will be significantly increasing your risk of metabolic derangement.  A prudent recommendation, based on these data, would be more like “less than 50%” (since no lower limit or deficiency was established).

Last but not least, and I’m not sure why, but the metabolic derangements associated with a low protein high carbohydrate diet were far more severe in women than men.

So the take-home message?  A low protein, high carbohydrate diet was significantly associated with metabolic deterioration, and this was most likely not simply correlative.  No, I contend this dietary pattern caused metabolic obesity.

One final note before moving on:  this study was specifically not looking at causes of obesity.  Obese and overweight people were excluded and this study focused solely on lean individuals.  Therefore we can’t conclude that any of the variables that cause metabolic obesity also cause weight gain… although they might (and probably do), the study was simply not designed that way.

Dear Drs Choi and Park,

If you’re reading this, please re-assess diet, blood parameters, insulin sensitivity, and body composition in these subjects in 5-10 years and report your findings.  I am very curious to see how metabolic obesity affects health outcomes.

Sincerely,

Bill Lagakos


In a similar study on the NHANES III data (United States), Zhu and colleagues analyzed risk factors for the metabolic syndrome across a wide range of BMIs.  In order to be more directly comparable to Choi’s findings, we’ll only consider the subjects with a health BMI (less than 25).

Lifestyle behaviors associated with lower risk of having the metabolic syndrome (Zhu et al., 2004 Metabolism)

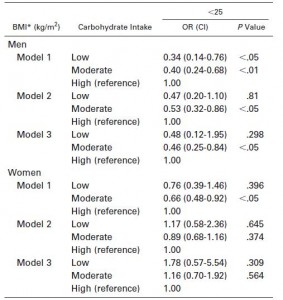
The table below is divided by gender, regression analysis (Model 1 is the most direct correlation, while Models 2 and 3 control for a variety of confounding factors), and carbohydrate intake (less than 30% of total calories, 30-60%, and greater than 60%).


The correlation between MONW and a high carb intake is stronger for men than women, but present in both.  For men, the association is not weakened by controlling for confounding factors (age, race, education, and income).  For women, the association is present in the general population (Model 1) but no longer exists in Models 2 and 3.  In both men and women, a high-fat diet was associated with lower risk of MONW in Model 1 but not 2 or 3.

In Choi’s study on a Korean population, a high carb and low protein diet was associated with MONW, with a smaller influence of low fat.  In Zhu’s study on an American population, high carb and low fat were associated with MONW and protein intake wasn’t analyzed.  Collectively, these results suggest that lean people eating a diet high in carbs but low in protein and fat are the most likely to have metabolic abnormalities and possibly may be unwittingly diabetic.  Skinny on the outside, fat on the inside.  A carbohydrate intake greater than 60% of total calories significantly increased the risk of MONW in Choi’s population, while an intake of less than 30% significantly decreased the risk in Zhu’s study.  Greater than 60% = bad.  Less than 30% = good.


Calories proper


Trans fats, take III

Man vs. ape     Or
Postmenopausal women vs. Africa green monkeys


Two good and potentially somewhat contradicting studies on our good old friends, trans fats.

Trans fat diet induces abdominal obesity and changes in insulin sensitivity in monkeys. (Kavanagh et al., 2007 Obesity)

In this study, Kavanaugh and colleagues fed either a control diet or one fortified with trans fatty acids to a group of African green monkeys for 6 years.  Two immediate strengths of this study are 1) the use of primates, who respond to dietary intervention much more similarly to humans than rodents, and 2) the duration is long enough to model what would be seen in a human population.  Furthermore, to prevent differences in food intake from affecting the outcome, all of the animals were fed 70 kcal/kg of their initial body weight.  This feeding regimen was chosen specifically to prevent an energy imbalance, i.e., the monkeys were to be “weight stable” for the entire study.  This method is superior to pair feeding, where one group is fed ad libitum and the other group is given the same amount of calories as the first group, but instead of grazing all day (normal behavior) they get it all in one sitting.  Pair feeding is stressful for the animals and causes a whole host of other problems.  Both groups in this study received exactly the same amount of food (70 kcal/kg of initial body weight) every day for 6 years.

At the beginning of the study, the monkeys weighed ~6.5 kg (14.3 pounds); thus, for the rest of the study they were fed 455 kilocalories every day.  The diet consisted of 35% fat, 17% protein, and 48% carbohydrates.

The diet for half of the monkeys was supplemented with 8%, or ~4 grams, of trans fatty acids.  The average intake for humans is 3%, or ~7 grams per day.  An intake level of 8% for humans is around 18 grams, which could be accomplished by eating fast food or microwave popcorn a few times per week.  So besides being informative and shedding a new light on energy balance, this study is also of practical relevance.

Furthermore, the trans fat they chose was similar to the most abundant trans fat found in human diets (processed foods): partially hydrogenated soybean oil.

The diet:
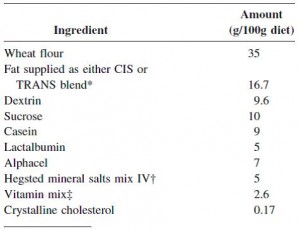
 

TRANS refers to trans fatty acids, and CIS is the opposite of trans.  Cis fatty acids are the form of most natural fatty acids.  People don’t usually call regular fatty acids “cis” because it is assumed; this is how most unsaturated fatty acids are found in nature.

To the data.


divide and conquer.
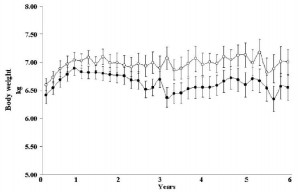
 

Body weight was roughly similar in CIS (closed circles) and TRANS (open circles) but started to diverge toward the end of the study.

The control group (CIS) weighed 6.41 kg at baseline and 6.55 kg at follow-up, an increase of less than 2%.  This was expected because at baseline, 70 kcal/kg per day was precisely enough food to keep them weight stable, so essentially nothing changed in these monkeys.  More specifically, since food intake and body weight didn’t change, we can say that there were probably no major perturbations in energy balance in this group.


TRANS, on the other hand, gained almost 3 times more weight despite eating exactly the same amount of food as the control group, which was exactly the same amount of food they were eating when they were weight stable at baseline.  Energy balance was clearly perturbed by trans fats.

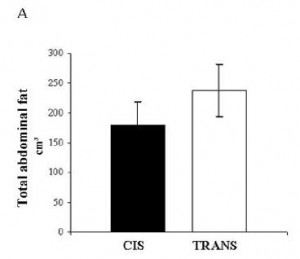
As seen below, the excess weight in the TRANS group was primarily in the form of increased visceral fat:
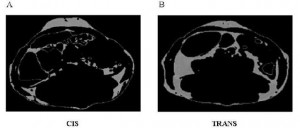
 

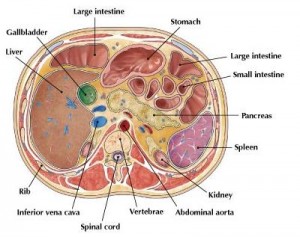
An abdominal CT scan.  The lighter areas represent fat tissue.  Both pictures depict roughly similar amounts of fat in the outer region (subcutaneous fat), whereas the TRANS group had significantly more fat tissue within the viscera.

For reference:
 

In all, TRANS had 27% more fat mass.  Fasting glucose and insulin levels were unchanged but postprandial insulin levels were markedly elevated in TRANS (see below), suggesting that dietary trans fats indeed caused insulin resistance.  I boldly use the term “caused” because this was a fairly well-controlled intervention study; the only thing different between the groups was the diet.
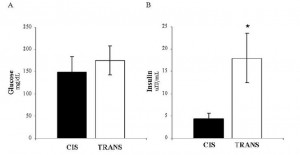
 

The TRANS group gained a significant amount of fat mass despite an absence of excess calories.  This was most likely caused by the trans fat-induced insulin resistance and subsequent postprandial hyperinsulinemia.

It would appear as though trans fatty acids defied the laws of energy balance.  The TRANS group gained fat mass despite an absence of excess calories.  Even the most practical explanation bodes poorly for trans fatty acids… it would appear as though trans fats were capable of inducing nutrient anti-partitioning independent of food intake.

I can see two ways to interpret these data.

  1. Trans fatty acids have an independent effect on energy balance.  That is, they specifically reduce energy expenditure, which would make the initial 70 kcal/kg*day excessive.  This would account for the excess fat mass, compared to controls, but not necessarily the increased body weight.  455 kilocalories (70kcal/kg*d) should be sufficient to support a specific amount of body weight; it is difficult to imagine a scenario whereby muscle mass declined enough to significantly reduce metabolic rate to the point where 455 kilocalories was so excessive that fat mass increased significantly more than the amount of muscle lost.  IOW, if this possibility were true, I would have expected, at most, a similar body weight but more fat and less muscle, not simply way more fat.

Of course, these processes would occur simultaneously and discreetly in vivo, but for simplicity’s sake I’ve broken it down.

6.6 kg monkey, x 70 kcal/kg*d = 462 kcal/d

Loses 0.022 kilograms of muscle, new body weight = 6.578 kg… since FFM is reduced, BMR should be reduced.  It was a 0.33% loss of body weight which was entirely from muscle (in this theoretical example), so perhaps BMR declines proportionately 460.46 kcal/d (? there are more accurate formulas in the literature, but this approximation is sufficient for our purpose)

all of those excess calories formerly burned in the lost muscle are now available for storage in fat.

462 – 460.46 = 1.54 excess kcal/day.  1.54 excess kcal every day for 6 years = 3,372.6  total excess kcal, which translates to ~0.438 kg fat mass.

0.438 kg new fat mass – 0.022 kg muscle lost = 0.416 kg overall weight gain.

6.6 kg + 0.416 = 7.016 kg.  Actual final body weight was 7 kg.  Pretty darn close.

Wow, can the loss of less than one ounce of muscle really cause such a drastic change in fatness?!? I don’t know for sure, but exchanging the microwave popcorn for a little resistance exercise seems prudent.

(in case you were wondering, no. I didn’t guess 22 grams. I did a ton calculations to quantify the metabolic rate reduction necessary to cause an energy surplus big enough to lay down enough fat mass to compensate for the reduction in muscle [which theoretically declined in proportion to the reduction in metabolic rate] and end up as close to 7 kg as possible… it could be calculated exactly but this has taken up 30 minutes already, and I think the point has been made)

2. Alternatively:  Energy expenditure varies day-to-day, hour-to-hour, second-to-second.  When we eat, we are transiently in positive energy balance, which reverses after a few hours, especially at night when a negative energy balance ensues and the fuel stored during the positive energy balance is utilized.  During those stints of positive energy balance, some of the excess energy is stored as fat tissue, while the rest is used to fuel the body.  Somehow, trans fatty acids shift the balance in favor of fat storage.

2a.  can there exist a positive energy balance selectively in adipose tissue?

2b. more likely, trans fatty acids reduce some component of energy expenditure, possibly basal metabolic rate, or perhaps the thermic effect of feeding.  Neither of these was measured, but I firmly believe energy balance was maintained.  It’s always maintained.

But the frightful conclusion remains the same: the TRANS group got fatter without eating more.  They didn’t eat more than they were supposed to but got fatter anyway.  Sad but true.

What about in humans?

Effect of trans-fatty acid intake on insulin sensitivity and intramuscular lipids-a randomized trial in overweight postmenopausal women. (Bendsen et al., 2011 Metabolism)

This study gave a group of 52 overweight but otherwise healthy postmenopausal women 16 grams of trans fatty acids in pumpkin muffins.  The control group received olive & palm oil-enriched pumpkin muffins.  In terms of the dosing, this study is almost directly comparable to Kavanaugh’s study.  However, this study only lasted 16 weeks (probably due to ethical reasons).  They also included a lean control group (for good measure?), baseline subject characteristics are below:
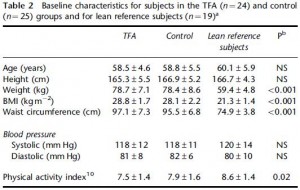
 

Nothing out of the ordinary.

And the investigators measured compliance empirically.  You are what you eat.  When a specific type of fat is consumed, its constituent fatty acids accumulate in body tissues like adipose and red blood cells.  So the researchers measured red blood cell trans fatty acid content.  Kudos!  (biomarkers are superior to almost any other measurement of compliance to a dietary intervention in humans)
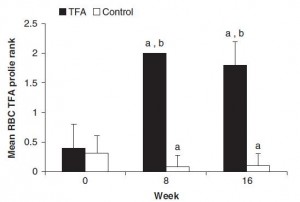
 

Indeed, the women ate their muffins.  But no effect on body weight!
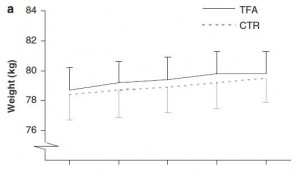
 

Body weight increased by about 2% in both groups.  If you want to get nit-picky, then we can make a few verrry long stretches concerning the body composition data:
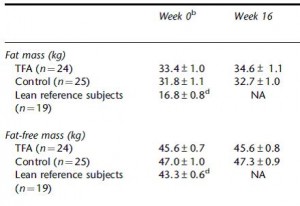
 

The increase in fat mass was 33% greater in TFA compared to controls!  (fat mass increased by 3% in the control group and 4% in TFA).  The increase in percent body fat was twice as big in TFA compared to controls!  (body fat percent increased by 1% in the control group and 2% in TFA).  IOW, the changes in body composition were nil.  This does not necessarily refute Kavanaugh’s African green monkeys because that study lasted 6 years; the insignificant changes in fat mass in Bendsen’s women over the course of 16 weeks could very well add up to significant changes after 6 years.  Actually, if the endpoint was indeed a 6% weight gain after 6 years (like the monkeys) (78.7 * 1.06 = 83.422 -78.7 = 4.722 / 6 years = 2.156 grams per day x 16 weeks = 241 grams) we might have expected these women to gain less than they actually did (~ 241 grams in 16 weeks compared to 1,200 grams).  In truth, however, these numbers are well beneath what can actually be measured accurately even in a laboratory setting.  So it is bona fide nit-picking.

Maybe it’s time to throw in the towel and confess that trans fats are significantly worse for African green monkeys than for overweight but otherwise healthy postmenopausal women.  There was no change in visceral adipose between the groups:
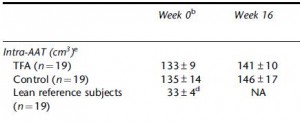
 

Potential confounding?  I’m really grasping at straws… but here it goes anyway:
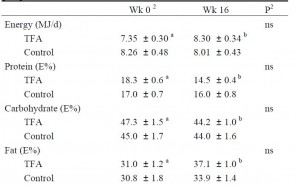
 

The TFA group reduced their carbohydrate consumption over the course of the study.  Carbohydrate consumption is directly correlated with liver fat accumulation.  But as per the trans fat study, trans fat consumption is inversely correlated with liver fat.  So we might expect trans fat-induced increase in liver fat to be cancelled out by the carb reduction-induced decrease in liver fat.  And this is exactly what happens!
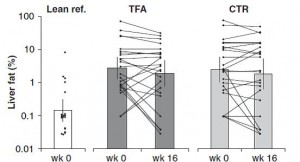
 

Furthermore, liver fat didn’t change in the control group because 1) their carbohydrate intake didn’t decline, and 2) they weren’t eating a ton of trans fats.  IOW, neither of the major dietary determinants were altered.

So, according to these colorful explanations, trans fats may have been just as harmful to Bendsen’s women as they were to Kavanaugh’s monkeys.  The reason why the results differ can be at least partially explained by the inferior dietary intervention utilized by Bendsen.  IOW, Kavanaugh’s dietary intervention was perfect; the subjects (monkeys) ate their prescribed diet exactly, no cheating, no sneaking in any snacks.  The diet changed markedly in Bendsen’s study; all women gained weight meaning that the test foods were probably not isocalorically substituted for foods in their normal diet.  Perhaps they just ate the foods in addition to their normal foods (unlikely considering the marked changes in macronutrient consumption).

Some more data from Bendsen’s overweight but otherwise healthy postmenopausal women were reported in another paper, and hints of trans fat-induced insulin resistance were revealed…

Here are the results from an oral glucose tolerance test:
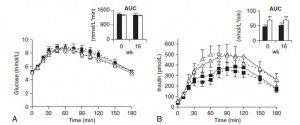
 

Glucose:  Just like Kavanaugh’s monkeys, there was no change in the glycemic response to a glucose load.

On the right, insulin levels.
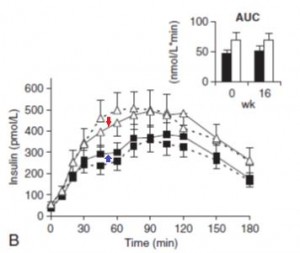
 

Insulin:  The open triangles are the control group, solid squares are the TFA group..  The dashed lines indicate insulin responses at baseline and the solid lines represent insulin responses at 16 weeks. In a randomized controlled intervention study, ALL changes in the intervention group must be compared not only to baseline measurements (pre-treatment), but more importantly they must be compared to the changes in the control group.  Over the 16 weeks, insulin response declined very slightly in the control group (see the little red arrow around the 45 minute mark).  However, insulin response increased slightly in the TFA group.  Take either of these changes individually and they would amount to nil.  But when you consider the change in control vs that in TFA, a modest trend appears.  The TFA group is beginning to show a hint of peripheral insulin resistance.  Maybe I’m seeing something where there is nothing, but the Kavanaugh’s study lasted 6 years and Bendsen’s study was only 16 weeks.  We must expect the changes to be ~20 times smaller in the Bendsen study.

OK, perhaps I got lost in the minutiae, or lost sight of the forest for the trees, but that doesn’t mean I’ll be eating microwave popcorn any time soon.  And on the bright side, creating this post was a great brain exercise

calories proper


attention nutrition researchers

how not to do a diet study.

As previously blogged about here, pair-feeding is an interesting phenomenon.

A high oxidised frying oil content diet is less adipogenic, but induces glucose intolerance in rodents. (Chao et al., 2007 British Journal of Nutrition)

Basically, these researchers wanted to test the effects on body weight and glucose tolerance of soybean oil that was used for deep frying, like for French fries.  WRT diet and food intake, the study was well designed.  There were four diets:

Divide and conquer

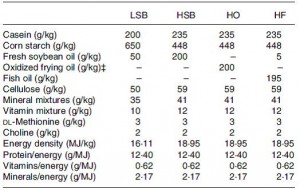
The “L” stands for “low,” as in Low SoyBean oil diet; this was the low fat control group.  The “H” stands for “high,” as in High SoyBean oil, High Oxidised oil, and High Fish oil.  Apparently, High Oxidised oil is not as delicious in rat chow as it is in French fries, so the rats fed HO ate considerably less.  But if the rats on HO ate less food, they would gain less weight and might exhibit improved glucose sensitivity compared to the other groups simply because of calorie restriction.  This would be a problematic confounding factor

Enter: pair-feeding.   In pair-feeding, the amount of HO ingested is regularly measured and an equivalent amount of calories are disbursed to the other groups, so that all groups are eating the same amount of calories.  Essentially, this controls for food intake so the effects of the diet can be tested directly, e.g., without being confounded by food intake.

As seen below, the pair-feeding regimen was successful:

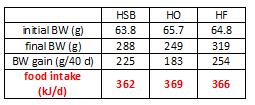
The row outlined in red shows food intake.  Note: it is very similar in all four groups; this was due to pair-feeding.


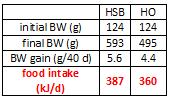
For the purpose of clarity, and since I’m not concerned with what was actually being tested, here is a simplified table.


In red, the HO group ingested 369 kJ/d, so the HSB and HF groups were fed approximately 369 kJ/d.  However, look at the markedly different amounts of weight gained.  HO gained significantly less weight than HSB and HF despite eating the same amount.  Similarly, HSB gained less weight than HF despite similar food intake.  don’t jump down my throat just yet, there was no attempt to quantify energy expenditure in any group, but that doesn’t take away from my point.  Taken at face value, these data suggest a diet high in oxidized soybean oil hinders fat gain (regardless of the mechanism).

The researchers figured that if all the groups were fed ad libitum (could eat as much as they pleased), HO would gain less fat because they ate less (as opposed to a specific effect of the dietary fat composition, which was the question they wanted to address).  This was their justification for pair-feeding.

Since HO gained less fat despite pair-feeding, their first point was proven.  Therefore, the researchers discarded the difficult and labor-intensive pair-feeding for experiment #2.  As seen below, rats fed HO ad lib do indeed ingest less than HSB.  AND they gain less weight.


So my question is: did pair-fed HSB rats gain more fat than HO because of an anti-fattening effect of HO, or because of the stress imposed by being pair-fed???  Normally, ad libitum feeding occurs all throughout the night (lots of small meals).  When an animal is pair-fed, they are given the food all at once and they gorge because: 1) they are being under-fed (given less than for what they are hungry); and 2) they don’t know when will be their next meal.

So back to my question: for what exactly does pair-feeding control?  in the first experiment, calories were the same, but HO were ingesting oxidized oils while HSB had a stressful feeding regimen… there are two variables.  The results from experiment #2 show nothing but what we’d expect, i.e., eat less = gain less fat.  My point is simple: pair-feeding might control for one problem but it introduces another.  If there are any nutrition researchers reading, please consider this.

Their experiments therefore specifically do NOT address the question they asked.  Maybe it was good enough for the British Journal of Nutrition, but it tells us nothing definitive about “the adipogenic effect of high oxidized frying oil.”

For ways around this, and to learn how to design a much better experiment, I am happy to consult for a small fee 🙂     for some more free background information, read on:

The effect of feeding frequency on diurnal plasma free fatty acids and glucose levels. (Bortz et al., 1969 Metabolism)

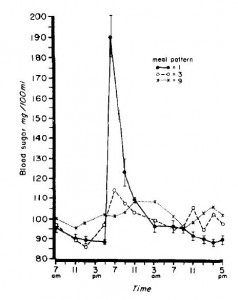
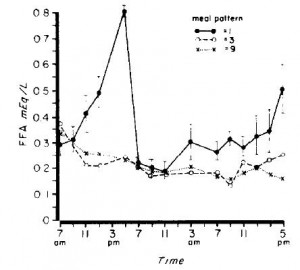
In this experiment, they fed young healthy men the following diet divided into one meal per day, 3 meals per day, or 9 meals per day.  Rodents feed all night long, so they would be most similar to the men being fed 9 times per day.  A pair-fed rodent, on the other hand, is fed only once and they eat everything in one sitting, just like the men in this study who were given all their calories at once.

The differences in blood glucose and free fatty acid responses to the meal were robust:


Hyoooge differences in serum glucose and free fatty acids.

So in addition to the stress-inducing nature of being pair-fed, there are also profound physiological differences in nutrient handling which most likely contribute to differential fuel partitioning.

For more examples of how a restricted feeding regimen can go terribly wrong, see here and here.

When you consider the possibility that the act of pair-feeding can have distinct metabolic effects, independent from whatever intervention is being administered, the results become increasingly difficult to decipher.

Effects of pair-feeding and growth hormone treatment on obese transgenic rats (Furuhata et al., 2002 European Journal of Endocrinology)

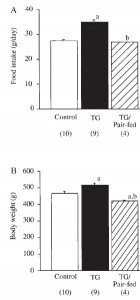
In brief, there were 3 groups: control, transgenic growth hormone-expressing mice (who eat considerably more than control mice, abbreviated “TG”), and transgenic growth hormone-expressing mice pair-fed with control.  As seen below, the pair-fed group ate (by design) and weighed just as much as control:


But when looking at the metabolic profiles of these mice, things get somewhat complicated:


Lets start out with the second row, FFA. OK, so TG mice eat more, weigh more, and have higher FFA than control (1.34 vs. 0.88 mM).  The elevated FFA could be caused by: 1) increased food intake; 2) increased body weight; or 3) the transgene.  To determine if it was caused by option #3, we look to the TG/pair-fed group.  If FFA are similar to TG, then it was caused by the transgene (option #3).  If FFA are similar to control then it was caused by options #1 or #2.  Alas, FFA in the TG/pair-fed group are similar to TG suggesting it is a specific of the transgene, independent of food intake body weight.

However, if we take a look at the first row, triglycerides, it is not so clear.  Again, we know that TG mice eat more, weigh more, and have higher triglycerides than control.  The elevated triglycerides could be caused by: 1) increased food intake; 2) increased body weight; or 3) the transgene.  To determine if it was caused by option #3, again we look to the TG/pair-fed group.  If triglycerides are similar to TG then it was caused by the transgene (option #3).  If triglycerides are similar to control, then it was caused by options #1 or #2.  But oh no!  Triglycerides in the TG/pair-fed group are significantly lower than TG and control!  This means we have to consider the fourth option: it was caused by pair-feeding.

The other two rows are easier to interpret, as insulin and leptin in the TG/pair-fed group exhibited an intermediate phenotype between control and TG, suggesting they were partially mediated by downstream effects of the transgene (i.e., increased food intake or body weight).  In the conclusion of the paper, the authors aptly explain the changes in insulin and leptin but cleverly avoid the triglycerides.  In their favor, the depressed triglycerides could have been an artefact, but the possibility that they were a product of the pair-feeding per se cannot be ruled out.  So depending on the question being addressed, pair-feeding has the potential to royally screw things up.


Calories proper


… if it ain’t broke …

“what to do with your cholesterol” or “it may not be a good idea to artificially manipulate your cholesterol levels (pharmaceutically or otherwise)”

Exhibit A: diet study, circa 1962.

A controlled clinical trial of a diet high in unsaturated fat – preliminary observations (Dayton et al., 1962 NEJM)

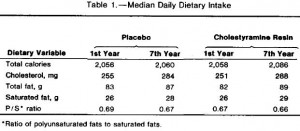
directly from the manuscript [sic]: “The control diet was a conventional food pattern containing 40 per cent fat calories, mostly of animal origin. The design of the experimental diet involved substitution of vegetable oils for about two thirds of the animal fat, total fat content being kept about 40 percent. An attempt was made to stabilize the iodine value of the control diet at 55 and that of the experimental diet at 100. Multiple vegetable oils were used, the choice depending more on pragmatic than on theoretical considerations. In order of decreasing quantity, corn, soybean, safflower and cottonseed oils were employed.”

basically, the experimental diet exchanged animal fat for vegetable fat (corn & soybean oil).  Iodine value reflects dietary fat unsaturation… vegetable fat has a higher iodine value because it has more unsaturated fats

A controlled clinical trial of a diet high in unsaturated fat in preventing complications of atherosclerosis (Dayton et al., 1969 Circulation)

[sic] “The control diet was similar to the regular institutional diet, which is a standard American diet. It provided, by analysis, 40.1% of calories as fat, having a mean iodine value of 53.5; cholesterol intake was 262 mg/1,000 calories (653 mg/day). The experimental diet provided 38.9% of calories as fat, with an iodine value of 102.4, and had a cholesterol content of 146 mg/1,000 calories (365 mg/day). Linoleic acid content of the two diets was 10% and 38% of total fatty acid, respectively.”

Clearly, the experimental diet successfully lowered serum cholesterol…  Total mortality was not significantly different, but:  “Deaths due to nonatherosclerotic causes numbered 71 in the control group and 85 in the experimental group.” keep those numbers in mind.


Exhibit B: an early cholesterol drug study, circa 1984

not for the faint-hearted.

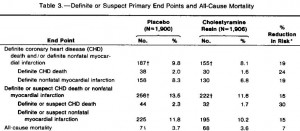
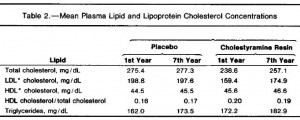
The Lipid Research Clinics Coronary Primary Prevention Trial (LRCC) is one of the first and biggest trials of a cholesterol lowering drug (cholestyramine) and mortality.  They collected a ton of data for both the placebo and treatment group, much of which is quite interesting.  The Lipid Research Clinics Coronary Primary Prevention Trial results. I. Reduction in incidence of coronary heart disease. (1984 JAMA)

It was a randomized, double-blind, placebo-controlled primary prevention trial of cholestyramine (24 g/d), lasting 7.4 years.  Roughly 3,800 healthy men aged 35-49 with LDL levels greater than 190 mg/dL.  This drug is used to treat high blood cholesterol.  P.S.  this study was done on people who were initially perfectly healthy (“primary prevention” trial).

Divide and conquer

The placebo group: cholesterol intake increased from 255 to 284 mg/d.  But their plasma cholesterol decreased from 198.8 to 197.6 mg/dL.  LDL decreased from 198.8 to 197.6 mg/dL AND their HDL increased from 44.5 to 45.5 mg/dL.


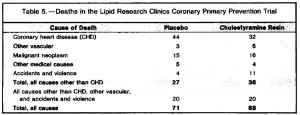
CHD mortality was reduced by 30% in the cholestyramine group but all-cause mortality only decreased by 7%.  Therefore some of the lives saved from CHD were lost to something else.  What else?


11 deaths from accidents and violence in the treatment group compared to 4 in placebo.  5 people were killed via homicide or suicide, compared to 2 in placebo.  6 people treated by cholestyramine died in car crashes compared to 2 in placebo.  Of all the people who died from accidents, half had high cholesterol.  That means that of the 8 people who died from car crashes, 4 had high cholesterol.  3 people on cholestyramine and 1 control died with high cholesterol of accidents.  4 people on cholestyramine killed themselves compared to 2 on placebo.

Did cholestyramine cause a 7% reduction in all-cause mortality because it lowered serum cholesterol levels?  Of the 8 people who died, 3 people on cholestyramine were drunk compared to 1 on placebo.

an alternative yet equally equivocal interpretation: when treated with cholestyramine, patients are twice as likely to kill themselves and 3 times as likely to die by drunk driving.

dramatic pause

Exhibit C: fibrates on trial, circa 1987

Helsinki Heart Study: primary-prevention trial with gemfibrozil in middle-aged men with dyslipidemia. Safety of treatment, changes in risk factors, and incidence of coronary heart disease. (Frick et al., 1987 NEJM)

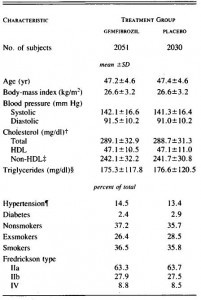
Randomized, double-blind, placebo-controlled primary prevention trial of gemfibrozil (600 mg BID), lasting 5 years.  Roughly 2,000 healthy men aged 40 – 55 with cholesterol levels greater than 200 mg/dL.  This drug is used to treat high cholesterol and lipids.  P.S.  this study was done on people who were initially perfectly healthy.


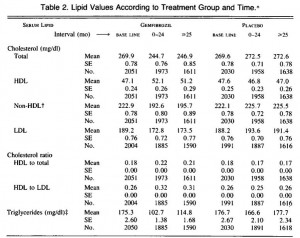
Here’s what gemfibrozil does to blood lipids:


Wham!  LDL and triacylglycerols go way down and HDL sky rockets.


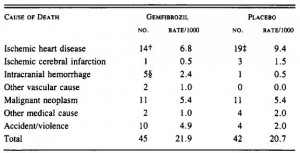
Indeed, gemfibrozil does to which it is supposed. … with some minor side effects: cancer rate: 15.1 in the treated group compared to 12.8 in placebo…  10% lower LDL and 18% more cancer.   Overall, gemfibrozil was associated with a 6% increase in mortality:


Patients taking gemfibrozil were 2.5 times more likely to die of accidents or violence. That is strikingly similar to what was caused by a 20% reduction in LDL during cholestyramine treatment in the LRCC (above) and the 20% reduction in overall cholesterol levels when animal fat was exchanged with vegetable fat.

Exhibit D, et cetera:

The Pfizer drug Torcetrapib nearly doubles HDL but increased total mortality by 60%.

Addition of nicotinic acid to a statin raises HDL but also increased total mortality (trial halted by Abbott Labs).

Most of these studies were on “healthy” subjects.  Maybe high LDL is bad.  …  Maybe low HDL is bad.  …


don’t fuck with your cholesterol levels.


calories proper


Ketosis, III

Ketosis series, take III

Hepatic steatosis, inflammation, and ER stress in mice maintained long-term on a very low-carbohydrate ketogenic diet (Garbow et al., 2011 AJP)

This study is similar to the one discussed in Ketosis series # 2, (A high-fat, ketogenic diet induces a unique metabolic state in mice [Kennedy et al., 2007 AJP]), both were 12 weeks long and used identical ketogenic diet.  However, the high fat/Western diets and body composition of mice on the ketogenic diet are different.

Nitpicking 101:  I don’t understand why researchers can’t select proper diets for these so-called “diet studies.”

KD, ketogenic diet; WD, Western diet

The macronutrient ratios are all over the place, but the worst part is that there is no attempt to control for the types of fat, protein, and carbs.  For example, the fats in the ketogenic diet are primarily lard and butter, while those in the Western diet are tallow and shortening… so basically the ketogenic diet is MUFA and PUFA while the Western diet is SFA and trans fat!  What exactly are we trying to compare, the effects of different dietary fats?  sacrebleu!

Divide and conquer

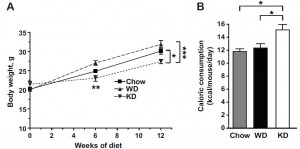
In accord with previous studies, mice on a ketogenic diet weigh less and eat more than those on chow or high fat diets.  Yada yada yada, just show this figure to the next person who promotes “eat less and move more” for weight loss.  (activity wasn’t measured in this study, but was here, which showed no change or even slightly reduced activity in mice on a ketogenic diet)


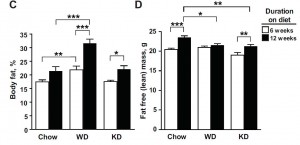
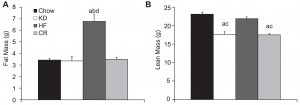
Divergences from Kennedy 2007: #1) body composition of KD mice in this study is identical chow;  lean mass in WD is less than chow and similar to KD.


WRT body fat, KD = chow < WD (HFD).  WRT lean mass, chow > WD = KD.

To refresh your memory, here are the data from Kennedy 2007:


The high fat diets are different, so a direct comparison is not possible.   But there is definitely a difference in how KD mice fared relative to chow, and the ketogenic diets were identical so a direct comparison is OK  (there were some other minor differences, like the age when the mice were started on the diet [6 wks vs. 8 wks]).  In Kennedy 2007, chow mice had the lowest body fat percentage, while in Garbow 2011 chow and KD are equivalent.  The differences are small, so it can slide (for now).  But FTR, since the ketogenic diets are identical, it would’ve been nice for Garbow to address some of these discrepancies in their discussion.

crackin’

From the body fat data above and food intake data below (which I extrapolated from diet composition and caloric intakes), it is clear that eating a lot of dietary fat won’t make you fat, even if it’s lard and butter.  KD mice ate 3x more fat than WD and almost 10x more than chow, but it didn’t cause them to get fat.  It’s only when sugar is added into the mix, as in the Western diet (40% carbs from sucrose & starch), when fat mass begins to accumulate.


Again, it’s surprising that KD mice ingested so much less protein yet maintained all of their muscle mass.  However the textbooks do say, explicitly, that nitrogen balance can be maintained when dietary protein is reduced if total caloric intake increases.  And that’s what happened (caloric intake increased), and maybe that explains the lean mass.  But it seems to me as if the increase in calorie intake (+20%?) was too much less than the reduction in protein intake (-75%) to completely account for the lean mass.  IOW, these data confirm that ketogenic diets are at least 50% magic.  I say that because the relationship between lean mass, protein, and calories is firmly adhered to by the other groups in this study.  I.e., chow mice ingested more protein than WD but the same amount of calories, and accordingly they had more muscle mass.

Moving on,

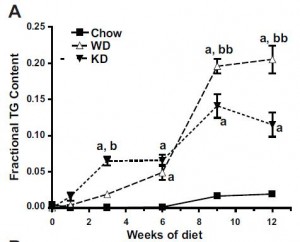
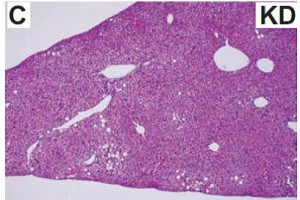
As expected, the ketogenic diet caused an increase in liver fat.  Not to worry, this is simply a product of the diet … KD = very low carbohydrate intake, so hepatic glycogen stores will be reduced; but the liver still needs energy and fat is in high abundance, so the liver accumulates fat instead.  It’s more physiological than pathological.


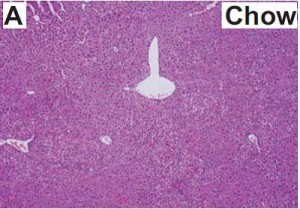
Normal liver:

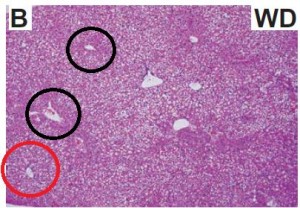
Pathological fatty liver:

lots of fat around the portal vein (red circle), less fat around the central vein (black circles).

Physiological fat stores: sparse lipid droplets

From Kennedy 2007:


KD mice in both studies, and also in Jornayvaz et al. (2010 AJP), accumulated more fat in their livers than chow-fed mice, but the livers in Kennedy’s WD mice accumulated more fat than KD while the livers in Garbow’s HF mice accumulated less fat than KD …  and the high-fat diets were apparently similar in both groups:

Kennedy’s High fat diet (D12451)

Garbow’s Western diet (TD.96132)

Both diets were casein-based high fat diets, with carbs coming from sucrose and starch.  However, the fat source in D12451 is lard/soybean oil (7:1) while that in TD.96132 shortening/tallow (1:1).  Therefore, despite being fed a similar amount of fat, the WD mice in Garbow’s study were fed trans fat, which is surely worse for the liver than the lard that was fed to the HFD mice in Kennedy’s study.  This likely explains why the livers of Kennedy’s HFD mice were ~1.3x fattier than control while the livers of Garbow’s WD fed mice were ~10.3x fattier than control.

So, going back to the eternal complaint against most diet researchers: get a clue about what you’re feeding your mice or consult a nutritionist before wasting taxpayer’s money on bunk diet studies.

Alternatively, perhaps Kennedy was out to vilify the ketogenic diet.  If that were the case, then he would cunningly select a high-fat diet that produced a liver that was less fatty compared to the ketogenic diet.  This would certainly make the ketogenic diet appear worse than the horrid high-fat diet, which everyone already knows is bad :/

but that sounds like slander


calories proper
 

Hedonism, take II


More on the relationship between obesity, delicious food, and the magic of gastric bypass.

Roux-en-Y gastric bypass surgery changes food reward in rats (Shin et al., 2011 Intl Journal of Obesity)

I wish I knew how, but this study definitely shares a theme with the remarkable effects of a bland diet and spontaneously reduced caloric intake in obese but not lean subjects, (from the first post in this series, found here).

In brief, there were 3 groups of rats in this study: 1) diet-induced obese (“sham”); 2) diet-induced obese rats that underwent gastric bypass surgery (“RYGB”); 3) chow-fed lean controls (“lean”).  The dietary regimen was a kerfuffle, but that wasn’t really the point of the study; to make the rats obese, they were given standard chow, a purified high sugar high fat diet, and chocolate-flavoured Ensure all at once…  and we have no idea how much of each they were consuming :/    But here’s the nutrient breakdown of each anyway, by calories: 

and here is a rough ingredient list:

HFD, high fat high sugar diet

They performed a battery of psychological evaluations designed to empirically measure how much an animal “wants” or “likes” a rewarding food.  Call me simple, but I would’ve rather just seen how much of each of the above diets the rats consumed when presented with all 3 simultaneously.  If most of their calories came from the sweet chocolate-flavored Ensure, then I’d say they still liked rewarding foods.  If on the other hand they selected more of the sugar-free chow, then they probably don’t care as much for rewarding food.  Maybe this wouldn’t fly in psychonutrition circles, but I don’t really think such circles exist.  Alternatively, would RYGB rats have lost more weight if they were fed exclusively chow compared to those given Ensure?  Fortunately, this question was addressed in an earlier manuscript by Zheng (Meal patterns, satiety, and food choice in a rat model of Roux-en-Y gastric bypass surgery [Zheng, Berthoud, et al., 2009 AJP])

When given the sugar-free chow diet, the control rats eat less.  When given a high sugar high fat diet, the control rats eat more.  RYGB rats don’t seem to care.  But that’s kind of exactly what Shin showed by complicated psychological tests:

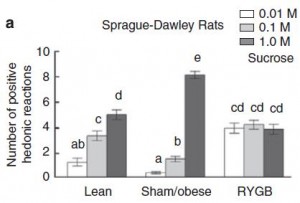
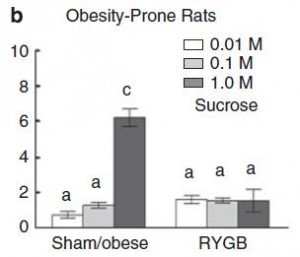
Lean and sham (obese) rats like a very sweet beverage (1.0 M sucrose) significantly more than a more bland solution (0.01 M sucrose).  RYGB rats don’t seem to care.  This was repeated to a tee in another group of “obesity-prone” rats suggesting it might be a true product of the gastric bypass surgery:

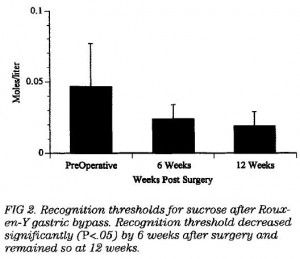
And oddly enough, human subjects that have undergone roux-en-Y gastric bypass surgery seem to be able to detect much lower concentrations of sucrose but not like it as much (they can “taste” it more, but might not “like” it more)  (they are satisfied with less-sweet foods) (Changes in patients’ taste acuity after Roux-en-Y gastric bypass for clinically severe obesity [Burge et al., 1995 JADA])


Are these findings related to obese humans who spontaneously consume significantly less of a bland diet?  (recall obese but not lean human subjects lost weight on the bland diet).  Similarly, rats consume significantly more of a tasty junk-food cafeteria diet.  There is definitely something magical about roux-en-Y gastric bypass surgery; it is the single most effective treatment [cure] for obesity.  Obese humans eat less of a bland diet, roux-en-Y gastric bypass surgery decreases the “liking” of a sugar-rich beverage (but enhances one’s ability to detect sucrose)… RYGB and that bland diet caused massive weight loss in their respective [obese] subjects…   These things just have to be related, my spidey-sense is going wild


calories proper
Hedonism

Sometime in the late ‘90’s I thought a bland diet would cure obesity.  If meals consisted of baked chicken and plain rice, or hard-boiled eggs and oatmeal, for example, then soon people wouldn’t look forward to eating and mealtimes would be unpleasant.  Eventually, food intake would revert to being governed properly by hunger as opposed to the rewarding or hedonistic aspects of delicious [junk] foods.  Furthermore, food intake might even be less than energy expenditure because the reduced caloric intake would be supplemented with stored energy from fat tissue until a normal body weight was regained (an early version of the set point theory?).

I still think this is true, but completely impractical.  Suggesting the removal of tasty junk food is generally considered militaristic and is often countered with loaded [and relatively meaningless] phrases like “everything in moderation.”

which brings me to this hilarious ms: Studies in normal and obese subjects with a monitored food dispensing device (Hashim and Van Itallie, 1965 Annals of the New York Academy of Science)

There are a ton of complicated studies involving lean and obese subjects, given bland or sweet foods while electroencephelograms measure brain electrical activity in attempt to determine if obesity affects a person’s response to or liking of sweets….

this study is way cooler.

The abstract, in its entirety [sic]: 

This is possibly one of the best controlled human dietary intervention studies of all time.

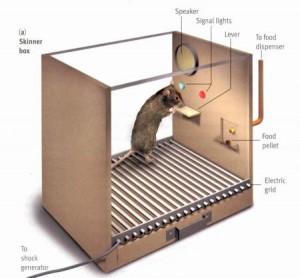
In brief, this study used a human-sized Skinner box to measure consumption of a bland yet nutritionally complete food-like liquid substance (“It’s a single cell protein combined with synthetic aminos, vitamins, and minerals.  Everything the body needs.” –Dozer, The Matrix).  50% carb, 20% protein, 30% fat (strictly in terms of macronutrients, not too different from the modern Western diet [~60% carb, 15% protein, 25% fat])

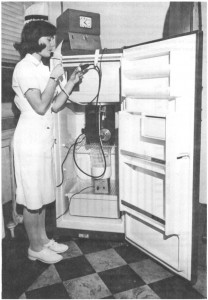
the actual device: 

Whenever a subject was hungry, they would put the straw in their mouth and press a lever to dispense exactly 7.6 mL of Nutrament.  Intake was monitored by a microwave-sized computer, and the only instruction was to feed exclusively from the machine, ad libitum, i.e., with no restrictions whatsoever.

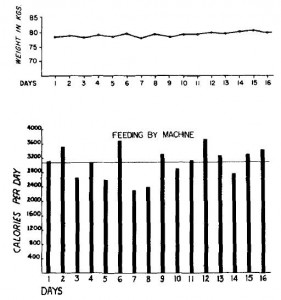
Experiment #1: a lean man, 60 years of age, studied for 16 days.  

This subject quickly adapted to the diet and was able to maintain body weight for the entire duration of the intervention.  Similar results were obtained from another male subject, 20 years of age, studied for 9 days.

Interpretation: 1) the machine works equally well for young and old [lean] subjects, and 2) switching from a normal diet to the bland Nutrament didn’t appreciably affect food intake or energy expenditure because calorie intake and body weight were unchanged.

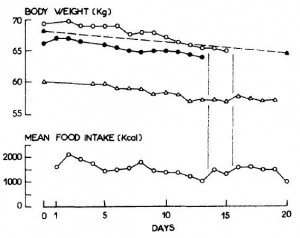
Here is where it gets interesting.  Next they tested a 400-lb [obese] man, 27 years of age.  His caloric intake and body weight dropped markedly for 70 days straight despite being encouraged to eat whenever hungry.  After 70 days, he was switched to a similarly bland meal-replacement beverage for another 6 months, during which time body weight continued to rapidly decline.  “ … the patient never complained of hunger or gastrointestinal discomfort.” 

Body weight (top half), calorie intake (bottom half). Red dot, baseline; orange dot, machine feeding period; green dot, switched to drinking from a cup instead of from the machine; blue dot, feeding from the machine and the cup; purple dot, given a liquid formula to consume at home with instructions to restrict physical activity.  The last part of the study was the only time when food intake was restricted, and given the consistent reduction in body weight, adherence was likely 100%.

They switched him to drinking from a cup to determine if there was something about “the bizarre feeding situation,” i.e., feeding exclusively from the machine, which inhibited food intake.  Calories increased a little, but not much.  NB when he was sent home, they instructed him to restrict physical activity (probably to reduce excess stimulation of hunger).  Overall, he lost 200 pounds.  Similar results were obtained with a 390-pound woman, 36 years of age, who over the course of 23 days lost 23 pounds.  In all of these cases, food intake spontaneously decreased to an extremely low level if the subject was obese.

The authors thought it was important that 1) the liquid was bland, 2) the subjects didn’t know how many calories they were ingesting, and 3) they were no longer eating in a social atmosphere.  “In other words, [the subject] is guided principally by subjective hunger.”  couldn’t have said it better myself.

Although Hashim’s sample sizes were small, this isn’t an isolated phenomenon.  Influence of a monotonous food on body weight regulation in humans (Cabanac and Rabe, 1976 Physiology & Behavior)

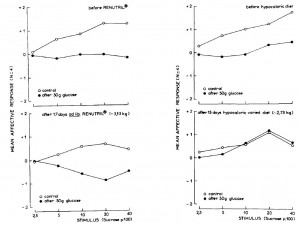
These researchers carried out a similar intervention, subjects were provided a bland liquid supplement “Renutril” as their sole source of calories, of which they were instructed to consume ad libitum while avoiding “as much as possible the odor, the sight, and even the thought of any other foods.”  Alliesthesia, or the “liking” of sweet foods with a full or empty belly, was also assessed before and after weight loss.  These subjects ingested significantly more calories than those in Hashim’s study (> 1000 vs. < 500 kcal) but they still lost a lot of weight (similar bland liquid calories: “Renutril”).  

Alliesthesis (see figure below): Normally, a sucrose-sweetened beverage is perceived to be sweeter as sucrose concentration increased, and this is blunted after a 50-gram bolus of glucose is delivered directly into the stomach (via naso-gastric tube) (top left in figure below).  IOW, with a belly full of calories, food tastes less delicious (hunger IS the best spice).  Similar results were obtained after weight loss with ad lib Renutril (bottom left), but not with a calorically-restricted, flavorful “mixed” diet (top right [pre-weight loss] vs. bottom right [post-weight loss]).  

Interpretation?  Caloric restriction-induced weight loss on a flavorful “mixed” diet must induce somewhat of a starvation response (since it tastes good, your “wanting more of it” overpowers the signal from the calories in your belly).  Importantly, this is not the case with ad libitum Renutril-induced weight loss; these subjects were honestly not hungry.  They weren’t sad or depressed about the new liquid diet; they just simply weren’t hungry.

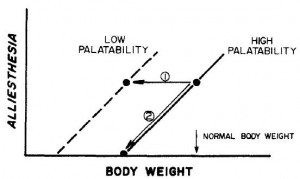
Apparently, cravings were not a problem in Hashim’s or Cabanac’s studies.  It’s a weird paradigm, but I like Cabanac’s final figure:

translation: body weight set point on a bland diet is lower than on a flavorful diet

Furthermore: sounds like torture!

From Hashim we saw that a bland diet could promote the loss of excess fat mass by reducing hunger.  Starvation does not ensue because the subjects have excess fat mass (by definition, as this only works in obese people) to supply energy for the body.  One important point here is that these effects seem to be dependent on the presence excess fat mass; caloric intake was normal and body weight maintained in lean subjects.  The second important point, garnered from Cabanac, is that the diet must be bland to prevent the rebound ravenous hunger experienced by most dieters.  Subjects who lost weight by a calorie-restricted mixed diet were not adequately satiated even when they had a belly full of calories (hypocaloric flavorful diet –> impaired alliesthesis).  IOW it’s not “calories” because they were reduced in both cases; it is the diet.  (yes this is further confirmation that the type of calories matters)

Last but not least, the complete opposite is also true. From a recent [infamous] rodent study: Cafeteria diet is a robust model of human metabolic syndrome with liver and adipose inflammation: comparison to high-fat diet (Sampey et al., 2011 Obesity)

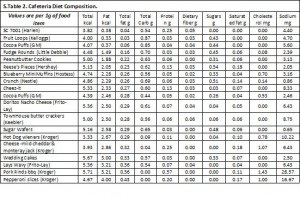
I applaud these researchers for their extremely meticulous and detailed food intake data, which was particularly difficult and labor-intensive because the “cafeteria diet” was employed. The cafeteria diet provides rodents with their usual chow, but also includes a rotating selection of bona fide human junk foods like Fruit Loops, Hostess Blueberry Muffins, Cheez-it crackers, Frito’s, etc., etc.  So measuring food intake isn’t as simple as collecting the leftover pellets, they have to really dig around to get all the crumbs, etc., and separate them to know exactly how much of each food was consumed.

A sample menu:

At the end of the day, when all of the hard work is done, we get this neat little table:

Divide and conquer

Note to nutrition researchers: this is a great way to present food intake data.  The only thing missing is one or two more columns stating the primary source of the fat and proteins (could actually get rid of the “Fat kcal” column because it’s redundant).

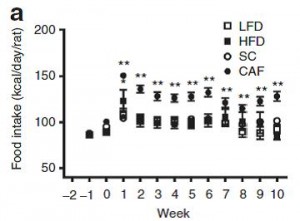
The cafeteria diet is a wide variety of junk food (a double whammy: variety & junk).  And as seen below, the cafeteria diet hijacks food intake homeostasis.  On either the low-fat (open squares, “LFD), high-fat (closed squares, “HFD”), or standard chow (open circles, “SC”) diets, rats ate about the same number of calories.

But they go crazy for the cafeteria diet (closed circles, “CAF”).  NB the 3 “control” diets (LFD, HFD, & SC) represent a wide variety of macronutrient ratios, and none of them are consumed as much as CAF.  That’s because of one simple reason: the cafeteria diet is delicious.  A bland diet will promote the loss of excess fat mass (Hashim & Cabanac), and a delicious junk food diet will promote the accumulation of excess fat mass:

Cafeteria rats gained almost twice as much weight as chow, who gained the least amount of weight (probably because standard rodent chow has the least sugar of all the diets).  So palatability plays a big role in determining hunger and food intake in humans (Hashim & Cabanac) AND rodents (Sampey).  Macronutrient composition is important, as it will determine how the ingested calories are partitioned (see figure e, above).  Sugar makes everything taste better; Crisco is gross, but if you add some sugar the resulting ‘icing’ is delicious.  disclaimer, I don’t condone the consumption of straight sugar, Crisco, or any combination therein.

Lastly, think about the bland diet / weight loss connection.  think it would work?  (the difference between obese and lean subjects was quite robust, much more so than anything that has come from an electroencephalogram)… If the patients really didn’t feel hungry, is it such a bad idea?  eating delicious food is “rewarding,” but it’s not like they’re being asked to avoid all rewarding activities (e.g., sex).

That’s all for now!

For personalized health consulting services: drlagakos@gmail.com.

Affiliate links: Still looking for a pair of hot blue blockers? TrueDark is offering 10% off HERE and Spectra479 is offering 15% off HERE. Use discount code LAGAKOS for a deal on CarbonShades. If you have no idea what I’m talking about, read this then this.

calories proper
Episode 2 of the ketosis series

Time for the second edition of our ketosis series. Some background:  physiological ketosis occurs when the body is burning fat very rapidly, like after an overnight fast or during low carb high fat dieting (e.g., Atkins induction phase).  NB this is not the same as pathological diabetic ketoacidosis or alcoholic ketoacidosis.  In humans, ketotic diets work like a drug for fat loss.  In rodents, there are a variety of responses which although they vary widely between studies, they all provide insight into this “unique” state.

Without further ado, today’s post: A high-fat, ketogenic diet induces a unique metabolic state in mice (Kennedy et al., 2007 AJP)

This study included four! diet groups.  Although the dietary interventions were poorly designed from a nutrition perspective, the fact that there were four of them means that we should be able to learn something from this paper.

The fourth group is 66% calorie restricted (CR) chow.


As a brief aside, although the diets could have been designed better, at least their KD was a bona fide ketogenic diet (in contrast to the first paper in the ketosis series, where the ketogenic diet group was only mildly ketotic [bHB was only 50% greater in KD relative to control).   As seen in the table above, b-hydroxybutyrate, the major circulating ketone body, was markedly elevated in KD compared to the other groups.

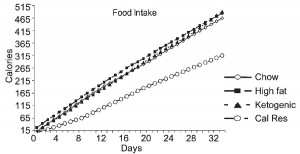
Caloric intake was similar among the groups (except CR [open circles], who ingested 33% fewer calories [by design])

One minor point: the HF diet is high in fat and sugar; KD is only high in fat, chow is low in fat, and neither KD nor chow have any sugar.  Does palatability affect food intake in mice?  If so, we might expect mice to eat more HF than KD (HF = cake icing; KD = Crisco).  And by “more,” do we mean “more calories” or “more food?”  Palatability probably doesn’t affect food intake [in the mice in this study] because although HF mice were eating just as many calories as KD and chow, they were eating much less food (higher calorie density etc.).

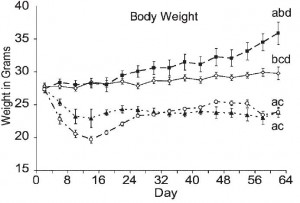
Interestingly, however, body weight differed markedly between the groups … [i sense a diatribe on the laws of energy balance… ]

HF (closed squares, top line) gained the most weight, followed by chow (open diamonds), then CR (open circles) and KD (closed triangles).  That last part is pretty amazing; mice on the ketogenic diet (KD, closed triangles) were eating half more calories than CR but they weighed just as much.  Alternatively, CR mice were eating 33% fewer calories than KD but they weighed just as much!  Either KD increases energy expenditure, or CR reduces it.

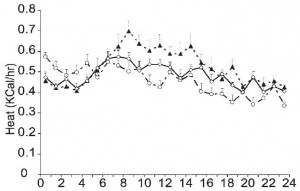
…err… or both.  Looks like KD (closed triangles) was always a little higher while CR (open circles) was always a little lower.  The figure above is showing total metabolic rate.  FTR, the units are kcal/hr which in this instance is the appropriate metric.  It is not uncommon for researchers to present these data as kcal/kg*hr, which corrects for differences in body weight.  Even though there were differences in body weight, “kcal/hr” is still the proper way to present these data because absolute, not relative, differences in metabolic rate produce changes in body weight that can be compared across groups.  Relative differences in metabolic rate, such as those that are normalized for body mass (kcal/kg*hr), are interesting and informative, but they don’t describe a variable that directly impacts body weight and can be compared across groups, which is what we are looking for in this case.

One more point needs to emphasized at this … point.

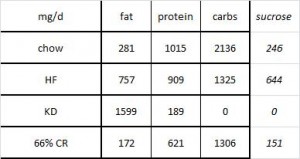
Mice fed chow, HF, and KD all ingested the same kcal/d (~15, as per figure 1.)  Since we know the composition of the diets, the amount consumed of each macronutrient can be calculated:


KD mice ate >2x more fat than HF (1599 mg vs. 757 mg).  HF mice ate the most sugar, while KD ate the least sugar.  Thus, HF mice (who were also eating a high sugar diet) diet weighed 50% more than those on the ketogenic diet, despite eating only half as much fat (and equal calories)!  Why?  *

CR mice lost weight, but their metabolic rate declined significantly (think: sluggishness, fatigue, etc.).  KD mice ate 50% more calories than CR mice but weighed exactly the same and had a higher metabolic rate (think: lots of energy, high activity level, etc.).  *

Well, actually, in terms of body composition, chow guys did the best:

HF mice accumulated the most fat mass (the product of a carb-rich high fat diet).  They also had as much lean mass as the chow group.  If we were to transcribe these data to percent body fat, chow would have the lowest (they weigh more than KD & CR, but have the same amount of fat mass; the numerator [fat mass] is the same but the denominator [body weight] is higher in the chow group).

Chow-fed mice ate the most protein and had the highest lean mass.  Coincidence?  By this you might argue that KD ate the least protein therefore they should have less lean mass than CR.  *You’re forgetting that the ketogenic diet is 0% carbs and 50% magic.

KD & CR had the lowest lean mass.  A few points about this:  for starters,  the ultra-low protein intake caused this in KD mice (muscle wasting), while in CR mice it was more likely due to a combination of deficient calories and suboptimal protein intake.  When calorie intake goes down, the amount of protein required to maintain nitrogen balance increases.  So if you reduce calories, lean mass will decline unless protein intake is increased.  In CR, calories and protein intake declined.

WRT the KD mice, they exhibited reduced lean mass but their relative metabolic rate was the highest out of all 4 groups.  Usually a loss of lean mass is accompanied by (or causes) a reduced metabolic rate, but the opposite happened.  I find this interesting.  Very interesting.

The researchers did a few more experiments*, and further confirmed that the ketogenic diet increases the absolute energy expenditure and markedly increases relative energy expenditure which allows the animals to eat just as much food while losing weight.

*actually, they did a ton more experiments, this paper was a bear.  Kudos.

They also tested “overall well-being” by measuring how much the mice explored a novel environment.  They found no difference between KD & chow, but HF mice exhibited “reduced exploratory activity.”  Translation: a high fat (ketogenic) diet is good (e.g., KD), but a high fat high carb diet is bad (e.g., HF).

For the inquiring minds, the mechanism of KD’s anti-obesity effects were most likely due to elevated heat dissipation via brown adipose tissue .  This is in contrast to which what was alluded above; although “exploratory behavior” was similar in KD mice, physical activity was not measured directly so it can’t be concluded that KD mice ran around and played more than the other mice.  Given the brown fat data, it is possible that basal metabolic rate (total heat production) was increased due to the ketogenic diet.  This could be good news for some; on a ketogenic diet, weight loss is not dependent on increased physical activity, the fat mass would simply (almost literally) melt away, no need to exercise.

This study is another example of how “eat less and move more” is wrong.  KD mice didn’t “eat less,” they ate differently; and the composition of the diet alone accomplished the “move more” part without requiring any type of exercise by increasing basal metabolic rate.  The diet did all the hard work for them.  And these mice were eating ad libitum, which means they were never hungry in contrast to the CR mice that were eating 33% fewer calories.   Calorie restricted diets are optimal for neither fat loss nor well-being.


calories proper
 

The Candy War

We interrupt your regularly scheduled program for this urgent message:  the National Health and Nutrition Examination Survey (NHANES) has issued a declaration of war.

Candy consumption was not associated with body weight measures, risk factors for cardiovascular disease, or metabolic syndrome in US adults: NHANES 1999-2004. (O’Neil et al., 2011 Nutrition Research)

en guard

OK, jk, the title of this manuscript is certainly eye-catching, but after a few days of brooding, plotting, and scheming, and some sleepless nights, I’ve come to the conclusion that while it may be “eye-catching,” it’s really not saying very much.

NHANES is a government run program that has been going on forever and is basically an enormous database of diet, health, disease, etc., risk factors, and is used to make nutrition or health recommendations.  There have probably been a million publications using data from NHANES.

This study included roughly 15,000 people over 18 years of age and had a follow-up period of 5 years.  They divided participants into 6 groups: people who ate candy and chocolate, those who ate only candy, those who ate only chocolate, and the people who did the opposite (e.g., those who didn’t eat only candy).

Sugar candy was defined as flavored/colored, crystalline/semisolid, sugar (e.g., peppermint, lollipops, licorice, gum drops, etc.).  Chocolate candy was defined as a mixture of cacao, cocoa butter, sugar and some extra’s (nuts, milk, fruit, caramel, etc.).

Reason #1 why this study isn’t saying very much:  we are not talking about a Halloween pillow case or Easter basket full of candy.  Not even close.  More like 4 Hershey Kisses, or 1 Reese’s Peanut Butter Cup (not even the whole package).  On average, everyone in the total population eats less than one serving per day which means that on most days no candy or chocolate is eaten at all.  This seems like a very low threshold for deeming someone to be a candy consumer, but it still includes about 10 – 20 % of their population.  Think of 10 people you know personally (friends, family, co-workers), how many of them have eaten candy in the past 48 hours?  If your answer includes more than 1 person, then these data don’t apply because the study population is not representative of the population from whence you hail.  phew!  Without going any further, I think this one point disqualifies the applicability of these results for about 95% of internet-accessing people.

If it looks like a duck, quacks like a duck, and you’re still not sure, send me the link.

Other anomalies in their data:

(divide and conquer)

Of course it’s perfectly plausible for one subgroup of people to eat significantly more yet weigh less than another subgroup selected from the same population, but how likely is that to occur in all 6 subgroups above?

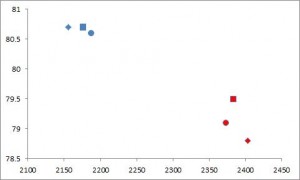
More simply, here is a graph of calorie intake vs. body weight:

Blue, nonconsumersRed, consumers; Diamond, total candy; Square, chocolate only; Circle, sugar only.

In each case, the blue symbols (nonconsumers) eat less but weigh more than the red symbols (consumers).    The only “normal” outcome, i.e., where those who eat more also weigh more, is comparing the red circle (people who eat both candy and chocolate) to the red square (people who eat chocolate but not candy).  I’m not saying these data are incorrect or were falsified, I’m just saying they are unique.  And when graphed this way, it is easy to see that consumers are eating over 150 more kilocalories per day than nonconsumers despite weighing ~2 pounds less.

Given the old (outdated) relationship between the amount of additional kilocalories required to gain one pound of fat mass, a difference of 150 kilocalories per should result in an additional pound of fat gained every 24 days… (which could theoretically be prevented by running an additional 1.5 miles every day) … yet those people are 2 pounds lighter

Furthermore, the candy consumers weigh significantly less and are more active, so their risk for a variety of metabolic disorders should be reduced, right?  Nope:

Candy: 0

Nutrition: 1

Will eating a piece of candy every day make you fat?  No.  Will stressing out about food or abandoning indulgences improve your health or quality of life?  Certainly not.  Do I feel all preachy now?  yes, a little.


Calories proper


Episode 1 of the ketosis series

Episode 1 of the ketosis series

Ketosis vs. leptin

My current running hypothesis, based on a few rodent-diet studies, is that leptin resistance is mediated entirely by sugar and is not influenced by dietary fat.  The relationship between leptin resistance and obesity is somewhat less clear (does leptin resistance cause hyperphagia and obesity?  does hyperphagia and obesity cause leptin resistance?  The latter example seems odd, but it would imply that leptin resistance develops after the onset of obesity… which would be supported by the observation of leptin sensitive obesity (e.g., here)

The study discussed below is another example of obesity sans leptin resistance.  To review, leptin resistance can occur without obesity on a high fructose diet, but it does not occur on a sugar free high fat diet.

Sensitivity to the anorectic effects of leptin is retained in rats maintained on a ketogenic diet despite increased adiposity (Kinzig et al., 2010 Neuroendocrinology)

Unfortunately, this was a pretty bad “diet” study from a nutrition perspective because there are way too many variables.  Are the results due to increased dietary fat?  lower protein?  lower carbs?  Aargh.  We will never know because they were all manipulated and uncontrolled.  (psychologists and neuroscientists should NOT be allowed to design nutrition experiments).  Even the types of protein and fat were different between the groups.

This study in a nutshell: leptin sensitivity and various other metabolic parameters were measured in rats fed chow or a ketogenic diet.

Divide and conquer.

What is a ketogenic diet?

exhibit A:

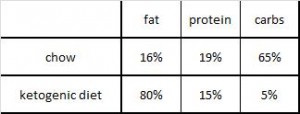
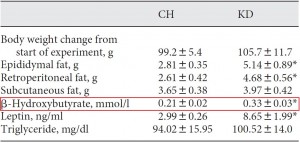
A ketogenic diet is insulinopenic = low carb, high fat.  The biochemical signature is elevated serum ketone bodies.  ?-hydroxybutyrate (red box in the table above) is the most abundant, and its elevation in the ketogenic diet-fed rats (KD) confirms that indeed, this was a ketogenic diet (note, b-Hb @ 0.33 mM is a very mild ketosis).

Unfortunately, these authors quantified fat mass by tissue excision and weighing, which is an inferior and inaccurate technique.  However, since the fat mass and leptin data* concur, we can infer KD rats were probably a little fatter by the end of the study.

*Leptin increases when fat mass increases.

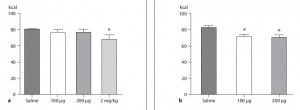
Leptin sensitivity was measured by injecting leptin i.p. and measuring food intake for the next 24 hours.  Higher leptin sensitivity results in a greater reduction in food intake.  As seen in the figures below, chow-fed rats (figure a, on the right) were more leptin resistant than KD rats (figure b, on the right). 

In fact, KD rats responded to 100 ug of leptin whereas it took almost 6 times more (2 mg/kg = ~600ug) to achieve a similar reduction in chow-fed rats.

One minor critique: the authors believed that a key novel finding of their study was that KD rats were more leptin sensitive despite being fatter… Given that adiposity was such a critical factor in their conclusion, they should have used something better than the worst way to measure fat mass.  Thus, a weak point of this study is that the validity of the conclusion (which is also in the title of the paper) is based on a notoriously inaccurate technique.

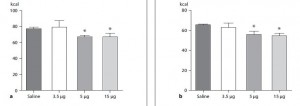
Interestingly, despite exhibiting resistance to peripherally administered leptin (above), chow-fed (below, figure a) rats were equally sensitive to KD rats (figure b) when leptin was centrally administered (i.c.v.):

The authors proceeded to speculate that leptin is less able to cross the blood-brain barrier in chow fed rats compared to KD.  It’s possible.  One theory on the mechanism of leptin resistance states that elevated triacylglycerols impair leptin’s ability to cross the BBB.  This is probably not true, as KD rats were more leptin sensitive despite having higher triacylglycerols.  $

One more minor critique, which I only mention because this issue arises frequently and is often ignored.  although I still don’t know what it means:

1)      If KD rats were significantly more sensitive to leptin, why was their 24h food consumption similar to chow-fed rats? (see saline injections in any of the figures above and here)

2)     Leptin levels in KD rats were significantly higher than those in chow-fed rats (8.65 vs. 2.99 ng/mL).  If they were indeed more leptin sensitive, then shouldn’t their food intake been lower than chow-fed rats?

3)      KD rats had significantly higher leptin levels (8.65 vs. 2.99 ng/mL).  So injecting KD rats with 100ug leptin increased their leptin from 8.65 ng/mL to 8.65 + X.  Whereas injecting chow rats with 100ug leptin increased their leptin from 2.99 to 2.99 + X.  Since “8.65 + X” will always be mathematically greater than “2.99 + X,” circulating leptin in the KD rats injected with 100ug of leptin should have been significantly greater than circulating leptin in chow-fed rats injected with 100ug leptin, so KD rats would have ingested less than chow-fed rats even if they were equally leptin sensitive. As such, I don’t think it’s proper to conclude, from those experiments alone, that KD rats were more leptin sensitive.  $$
3.5)  Is there a difference between endogenous and exogenous leptin?  I.e., is exogenous leptin stronger than endogenous leptin?  If so, this is very important.  Food for thought.


calories proper