Category Archives: Dietary fat

Circadian phase delays and metabolism

Remember the “jet lag-resistant” mice?  Guess what: screw with circadian biology and metabolism pays the price.

In brief, vasopressin was classically thought of as an anti-hypotensive hormone.  The vasopressin analog Desmopressin is used to treat bed-wetting.  But vasopressin biology is much more interesting than that: mice lacking both vasopressin receptors require very little time adapting to large circadian phase changes.  And as with many fundamental concepts in chronobiology, this is intimately linked with metabolism.

People with certain polymorphisms of the vasopressin receptor, V1A, exhibit elevated blood glucose levels and are at greater risk for diabetes (Enhorning et al., 2009):

genotype

This risk is strongest in men in the highest quartile of fat intake, and is statistically more significant after adjusting for age and physical activity:

Fat consumption

This study wasn’t designed to be a very powerful indicator of diet-disease relationships, but a little speculation: some think higher fat [and lower carb] intake should be protective against diabetes… which may be true, for people who can tell time.  Alter one nucleotide in the vasopressin 1A receptor gene and the game changes.

Continue reading

Protein “requirements,” carbs, and nutrient partitioning 

One way to determine protein requirements is the nitrogen balance technique.  If all of the nitrogen from dietary protein intake is equivalent to that lost via feces, urine, and sweat, then one is in nitrogen balance.  Growing children and pregnant women are usually in positive nitrogen balance, because much of the nitrogen is being invested in the growth of new tissue.  Cachectic cancer patients and sarcopenic elderly may be in negative nitrogen balance, because they’re losing lean mass.

Protein requirements to maintain nitrogen balance are largely dependent on total energy intake.  More calories in, less protein needed.  For people in negative energy balance (losing weight), this usually means more protein is required else muscle will be wasted.

Exercise lowers, not raises, protein “requirements,” because exercise is a potent anabolic stimulus; it helps preserve nitrogen at any level of dietary protein.  That’s not to say more won’t improve functional outcomes; just that it’s not “necessary” to prevent muscle loss.

Need =/= optimization.

Lastly, total grams, not percent of calories, is the most relevant way to talk about protein requirements in the context of nutrient partitioning and body composition.  This is just how protein operates.

Part 2.  The poor, misunderstood Randle Cycle

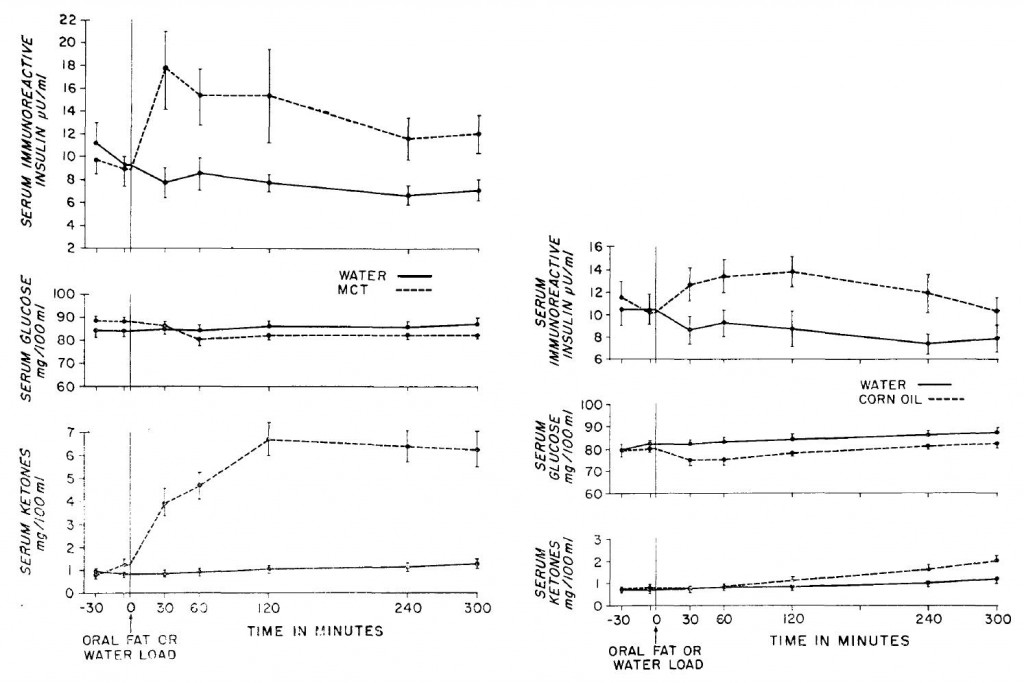
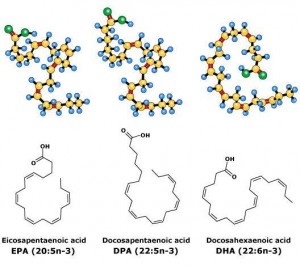
“The glucose-sparing effect of fat-derived fuels” …when you’re body starts burning more fat (and fat-derived fuels; ie, ketones), it’s use of glucose declines.  Thus, it’s “glucose-sparing” (spares glucose for the brain and obligatory glycolytic tissues, yada yada yada).

During starvation, much of that glucose comes from amino acids from skeletal muscle proteins, so it can also be phrased as: “the muscle-sparing effect of fat-derived fuels,”  which is equally biologically relevant, because similar to zeroglycemia, an unabated loss of muscle is incompatible with survival.

That is, in starvation, where the “protein” is skeletal muscle, not dietary (because starvation)… but what about when following a low carb or ketogenic diet – do ketones (fat-derived fuels) exert a muscle-sparing effect in this context?

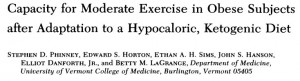
One study compared the impact of two isonitrogenous diets, low carb (Diet A) vs. high carb (Diet B), on nitrogen balance and showed that, except at very high levels of energy intake, nitrogen balance was consistently better on high carb.

carbs vs protein req


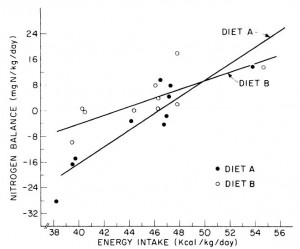
However, 51 kcal/kg is the textbook number of kcals “required” for young, moderately active adults.  With this understanding, it could be interpreted to mean that nitrogen balance is better with low carb (Diet A) for people in energy balance; and better with high carb (Diet B) if energy deficit.

edit: 51 kcal/kg is for athletes; probably about 20-25% less for non-athletes.

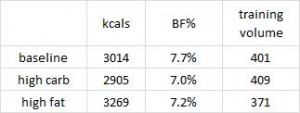
Or not: in another study, a low carb diet promoted better nitrogen retention albeit less weight loss than an isocaloric low fat diet.  The low carb group lost slightly more fat mass, which, combined with nitrogen balance data, suggest modestly improved body composition.  The differences were small, because this was a “non-ad lib” isocaloric diet study.  In the absence of large differences in intake, the most we can expect from such studies are subtle alterations in nutrient partitioning (which are usually difficult to detect).

Cancer cachexia is a condition of severe muscle wasting, and one study set out to determine, more directly, if ketones spared muscle in this context.  The study only lasted one week, but I suspect a certain degree of expedited ketoadaptation because: 1) it was very low in carbohydrate; 2) the fat was primarily MCTs; 3) they supplemented oral ketones; and 4) energy expenditure is elevated in this population.  Both the control and ketogenic diets were modestly hypercaloric, but nitrogen balance was more favorably improved by the high carb diet, in contrast to the above studies.

Thus, ketones don’t work in the context of a hypercaloric diet; however, pharmacologically elevating ketones via intravenous infusion in fasting subjects does work (because it’s more like starvation).

The muscle-sparing effect of fat-derived fuels is conceptually and physiologically more relevant to starvation, not nutritional ketosis.

Part 3.  Protein “requirements”

Effects of high-protein diets on fat-free mass and muscle protein synthesis following weight loss: a randomized controlled trial (Pasiakos et al., 2013) 

Protein intake was 1x, 2x, or 3x the RDA; fat was 30% of calories, and carbs made up the rest; on a weight maintenance diet and again on 30% calorie restriction (it was technically a 40% energy deficit, because they tried to ramp up energy expenditure with exercise).

RDA

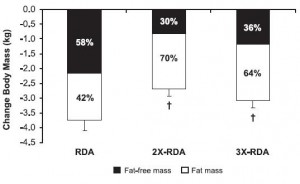
All groups lost weight, but the ratio of fat to muscle loss was significantly higher in the 2x and 3x RDA groups, which amounted to ~120 and 185 grams of protein per day, respectively.  The 3x group didn’t fare as well, possibly, because that much protein induces a high degree of satiety – this group ended up consuming significantly fewer calories than the 2x group.  So the interplay between energy intake and protein requirements is back on the table: the added energy deficit apparently increased protein requirements to some level above 185 grams per day.  Not much, given the small difference in muscle loss, but increased none the less.

Side note: be cautious when interpreting a study about the amount of protein required for xyz endpoint, because such studies usually only measure one of many important markers, and they don’t report absolute changes in size, strength, etc.  Also, context matters.

For example, Moore and colleagues (2014) showed that 0.24 g/kg (17 grams for a 70 kg adult) was enough to maximally stimulate myofibrillar fractional synthetic rate (mFSR):

mFSR

However, in the contexts of three square meals and energy balance (or deficit), 0.72 g/kg (50 g/d) is woefully inadequate.  Point being: mFSR (in this case) is only one measurement and shouldn’t be extrapolated to total daily requirements.  Perhaps you could eat six 17 g servings in order to fully maximize 24-hour mFSR, or you could realize that going above what saturates mFSR isn’t a bad thing, or wasteful.  mFSR is just one of many measurements of muscle protein balance.

My opinion

For those who need exact numbers, hopefully one point I’ve made is that there’s no answer to this question.  I’d guess that most people “need” 100+ grams of protein per day (more if losing weight), and 100 grams is probably too much in one sitting.  Also, need =/= optimization, and context matters.

Nutritional ketosis doesn’t appear to reduce the amount of dietary protein necessary to maintain lean mass.  The muscle-sparing of fat-derived fuels works during starvation; in other contexts, all bets are off.

calories proper

Paleo Plants and Carnivory

From what I gather, it’s been difficult to pinpoint the role of plants in the diet of our ancestors for a variety of reasons.  For example, evidence of plants on cooking tools and dental remains is suggestive but doesn’t disprove the possibility that said evidence came from preparing the plants for some other purpose (eg, tools, weapons, or medicine), or that the stomach contents of an herbivore was ingested (which gets partial credit).

That said, after reviewing a few studies on the topic (see below), it’s safe to say that plants were eaten, probably frequently, and the types & quantities varied seasonally & geographically.  Collectively, the data suggest we aren’t carnivores.

…you had to have something to hold you over until the next fish fell prey to your deadly hunting spear…

Continue reading

Lipid Hypothesis 2.0: Eat Butter

The original lipid hypothesis stated, more or less, that lowering blood cholesterol would reduce premature mortality from heart disease.  At the time, it was thought that dietary cholesterol and saturated fat increased the ‘bad’ type of blood cholesterol, so the advice was to restrict those foods.  All of that was wrong.

Time

Lipid Hypothesis 2.0: Eat Butter

Continue reading

More on physical performance and ketoadaptation

The various studies on how low carbohydrate diets impact physical performance are very nuanced.  Here’s what I mean by that.

Exhibit A. Phinney 1980

Phinney 1980

In this [pioneering] study, obese patients were subjected to a variety of performance assessments in a baseline period, then after 1 and 6 weeks of weight loss via protein-sparing modified fast (1.2 g/kg ideal body weight from lean meat, fish, or fowl; probably around 80 grams of protein/d, 500-750 kcal/d). They lost a lot of weight, 23 pounds on average, two-thirds of which was body fat. There was no exercise intervention, just the performance assessments.

During the ‘exercise to exhaustion’ treadmill exercise, RQ steadily declined from baseline to week 1 to week 6, indicating progressively more reliance on fat oxidation.  This was confirmed via muscle glycogen levels pre- and post-exercise: during the baseline testing, they declined by 15%; after 6 weeks of ketoadaptation, however, they only declined by 2%, while ‘time to exhaustion’ increased by 55%.  After only 1 week of the diet, time to exhaustion plummeted, as expected, by 20%.

This was, as mentioned above, a pioneering study in the field of ketoadaptation. It also challenges one of the prevailing theories of ‘fatigue’ …while carb-adapted, the subjects fatigued after 168 minutes, with muscle glycogen levels of 1.29 (reduced by 15%); while ketoadapted, they fatigued after 249 minutes with muscle glycogen levels of 1.02 (reduced by 2%).  In other words, they had less glycogen to begin with, used less glycogen during exercise, and performed significantly better (running on fat & ketones).

Exhibit B. Vogt 2003

Highly trained endurance athletes followed a high fat (53% fat, 32% carbs) or high carb (17% fat, 68% carbs) diet for 5 weeks in a randomized crossover study. In contrast to Phinney’s study, these participants were: 1) highly trained; and 2) exercised throughout the study.

Maximal power output and VO2max during a similar ‘time to exhaustion’ test was similar after both diet periods.  Same for total work output during a 20 minute ‘all-out’ cycling time trial and half-marathon running time.  Muscle glycogen was modestly, albeit statistically non-significantly lower after ketoadaption; however, ketoadapted athletes relied on a higher proportion of fat oxidation to fuel performance as indicated by lower RQ at every level of exercise intensity:

Vogt RQ

Again, this is the essence of ketoadaptation. Physical performance as good as or better using fat and fat-derived fuels.

One reason Phinney’s glycogen-depeleted ketoadapted subjects may have done so well is their reliance on ketones (probable) and intramyocellular lipids (IMCL) (possible).  In Vogt’s study, IMCL increased from 0.69 to 1.54% after ketoadaptation…

Also, food intake and body fat declined, and training volume increased in the low fat group; whereas food intake increased, and body fat and training volume declined in the high fat group.  Reminiscent of anything?

High fat, low carb -> eat more, exercise less, STILL LOSE BODY FAT.

Vogt data

Sorcery?  No.  Diet impacts more than just mood and body composition – resting energy expenditure increased in the ketogenic dieters.  This isn’t an isolated finding.

Exhibit C. Fleming 2003 

This was another study in non-trained athletes, consuming high fat (61% fat) or control (25% fat) diets for 6 weeks.  The tests were the 30-second Wingate, to examine supramaximal performance, and a 45-minute timed ride, to examine submaximal performance.

This study differed from the previous two in several significant ways.  For starters, peak power output declined in both groups, slightly more so in the high fat group (-10% vs. -8%).  Furthermore, RQ didn’t wasn’t significantly lower during this test in the high fat group, which possibly suggests they weren’t properly ketoadapted.  In Phinney’s study, the large energy deficit ensured ketoadaptation; this study lacked that aspect, somewhat more similar to Vogt’s, although unlike Vogt’s, these participants weren’t athletes which presumably makes ketoadaptation more difficult.

There are many factors at play… I wasn’t kidding when I said these studies are very nuanced!

Exhibit D. the infamous, Paoli 2012 

These were ‘elite artistic gymnasts,’ who could likely beat you in a race running backwards.  The ketogenic phase consisted of 55% fat and much more protein than the control phase (39% fat; protein: 41% vs. 15%). The significantly higher protein content was modestly offset by slightly more calories in the control phase, which reduces the amount of protein required to maintain nitrogen balance.

In this study, performance was, for the most part, ‘maintained,’ with relative increases in a few of the tests; eg, the “legs closed barrier.”  Changes in body composition were more robust: significantly reduced body fat and increased lean body mass after 30 days of ketogenic dieting (with their normal exercise routine).

Paoli data

The major confounder in this study was the use of an herbal cocktail only in the ketogenic diet group; despite this, the results are largely in line with the other studies.  For more on this study, see here.

Exhibit E. the most dramatic one to date: Sawyer 2013 

Please see here for the details, but in brief, strength-trained athletes showed improvements in high intensity exercise performance after only 7 days of carbohydrate restriction.  The nuances of this particular study are discussed more here.

barbell

Collectively, these studies show that physical performance in both endurance and high intensity realms does not always suffer, can be maintained, and in some cases is improved by ketogenic dieting.  Important factors are duration (to ensure adequate ketoadaptation), energy balance, and regular physical activity (athletes and regular exercisers can adapt to burning fat much quicker than sedentary folks).


calories proper

New study: high intensity exercise on a low carb diet.

Switch an athlete from their standard carbohydrate-rich diet to a low carb ketogenic one and suddenly performance tanks.  It is known.  Give them a few weeks to adapt, however, and it recovers.  This much was established for mainly endurance-related performance parameters by Steve Phinney and colleagues in the 1980’s (eg, Phinney et al., 1983).  Then, along came Antonio Paoli, Dominic D’Agostino, and others who showed a similar phenomenon in gymnasts, a population that routinely exercises at higher levels of intensity (Paoli et al., 2012).  Notably, in these studies the athletes were allowed adequate time to adapt to the new metabolic milieu – sometimes referred to as ketoadaptation.  Three weeks appears to be the minimum amount of time required for ketoadaptation; ie, studies of shorter duration generally show: low carb = poor physical performance.

…which is why I was surprised to see this one:

Effects of a short-term carbohydrate-restricted diet on strength and power performance (Sawyer et al., 2014)

These researchers subjected ~30 strength-trained individuals to a battery of performance assessments before and after 7 days of a low carb [ketogenic] diet.  Usually I would’ve stopped reading at this point because 7 days is too short.  But there were some nuances in the way this particular study was designed which piqued my interest.

Continue reading

Diet study: American Diabetes Association vs. Low Carb Ketogenic

A randomized pilot trial of a moderate carbohydrate diet compared to a very low carbohydrate diet in overweight or obese individuals with type 2 diabetes mellitus or prediabetes (Saslow et al., 2014)

Disclaimer: this study was not ground-breaking; it was confirmation of a phenomenon that is starting to become well-known, and soon to be the status quo. That is, advising an obese diabetic patient to reduce their carb intake consistently produces better results than advising them to follow a low fat, calorie restricted diet.

The two diets:

Moderate carbohydrate diet: 45-50% carbs; 45 grams per meal + three 15 gram snacks = 165 grams per day; low fat, calorie restricted (500 Calorie deficit).  Otherwise known as a “low fat diet (LFD).”

In their words: “Active Comparator: American Diabetes Association Diet.  Participants in the American Diabetes Association (ADA) diet group will receive standard ADA advice. The diet includes high-fiber foods (such as vegetables, fruits, whole grains, and legumes), low-fat dairy products, fresh fish, and foods low in saturated fat.

Very low carbohydrate diet: Ketogenic; <50 grams of carb per day, no calorie restriction, just a goal of blood ketones 0.5 – 3 mM.

In their words: “Experimental: Low Carbohydrate Diet.  Participants will be instructed to follow a low carbohydrate diet: carbohydrate intake 10-50 grams a day not including fiber. Foods permitted include: meats, poultry, fish, eggs, cheese, cream, some nuts and seeds, green leafy vegetables, and most other non-starchy vegetables. Because most individuals self-limit caloric intake, no calorie restriction will be recommended.

Both groups were advised to maintain their usual protein intake.

Continue reading

Fermented meat & probiotics

From Slate: “Sausage made with bacteria from baby poop isn’t as gross as it sounds.” 

and my favorite: “Pooperoni? Baby-poop bacteria help make healthy sausages.

Much ado about: Nutritionally enhanced fermented sausages as a vehicle for potential probiotic lactobacilli delivery (Rubio et al., 2014)

The media seems to have missed the ball, but not by far.  They focused on healthy microbes being incorporated into fermented meats, whereas the scientists seemed to want to make a “healthier” low-salt, low-fat sausage.

The low-salt part seems to partially make sense from a fermentation-perspective: using probiotics instead of salt to reduce the potential for pathogenic microbial contamination.  However, I doubt reducing the sodium by 25% will have any appreciable impact on health outcomes.  The effect of adding beneficial microbes, on the other hand, might.

They also mentioned making it lower in fat, but that doesn’t make as much sense; I don’t think there’s a big contamination risk of having a higher fat content.  #lipophobia

Continue reading

Insulin, dietary fat, and calories: context matters!

Jane Plain recently wrote a great article about the relationship between insulin, dietary fat, and calories.  There are a lot of data on this topic, which collectively suggest: context matters! 

For example,

Insulin and ketone responses to ingestion of MCTs and LCTs in man. (Pi-Sunyer et al., 1969)

14 healthy subjects, overnight fasted; dose: 1g/kg.

In brief, MCTs are more insulinogenic than corn oil.  But it’s not a lot of insulin.  Really.  Enough to inhibit lipolysis, perhaps, but that’s not saying much… & certainly not enough to induce hypoglycemia.

Pi-Sunyer MCT Corn oil

Continue reading

Fish, dark chocolate, and red wine.

Fish oil fatty acids: EPA & DHA.

I’ve read that EPA tends to show slightly better results in outcomes related to mood, whereas DHA tends to be slightly better for cognition.  Not mutually exclusive; probably a lot of overlap.  This meta-analysis by Martins showed EPA fared better than DHA for depressive symptoms (2009); another one here, stressing the high %EPA relative to %DHA necessary for improvements (Sublette et al., 2011).  Whereas the reverse is true for certain cognitive outcomes in this study by Sinn and colleagues (2012).  Very few studies test EPA vs. DHA directly, and their effects on metabolism are relatively similar.  They’re the ball bearings of fatty acids.epa dpa dha

Continue reading