Category Archives: diet

A historical argument against caloric equality

80 years later, a calorie still isn’t a calorie.

Exhibit A.

The treatment of obesity   (Lyon and Dunlop, 1932)

As early as 1932, Lyon and Dunlop recognized that the calories from as little as one slice of bread every day could result in pounds of fat mass gained every year.  For whatever reason, this doesn’t happen to lean people; so they decided to study the effect of different diets on obese subjects in a metabolic ward at the Royal Infirmary.

Their idea of a “diet:” If they could only see how much times have changed!  (this is a hotly debated topic.)

Lyon and Dunlop first tested weight loss vs. total calorie intake.  The diet was roughly 40% carbs, 24% protein, and 36% fat.  Not surprisingly, people fed 800 kcal/d lost more weight than those given 1,000 or 1,200 kcal/d (200 vs. 172 vs. 157 grams of body weight lost per day over the period of 7 – 10 days), confirming that the less you eat, the more weight you lose (duh).  A calorie is a calorie after all, right? …

Continue reading

The easy diet diet II

Full disclosure.  IMHO, with regard to obesity and weight loss diets, low carb is a little bit better, most of the time.  It’s not such a huge difference that it’s ridiculously obvious, and in situations where low carb proper is too impractical, it might just be more important to focus on eliminating as many empty calories as possible.  Because as discussed in the Easy diet diet, Op. 72, you don’t have to go militant zero carb; simply “low carb seems to work pretty well.

In type 2 diabetes, randomization to advice to follow a low-carbohydrate diet transiently improves glycaemic control compared with advice to follow a low-fat diet producing a similar weight loss (Gulbrand et al., 2012)

[if you follow the advice, that is, at least to some degree] Continue reading

Nutrient timing, Op. 101

There is no longer a debate on the value of protein supplements for exercisers.  Now I’d like to make the case for protein timing, or more specifically the value of pre-workout protein supplementation.

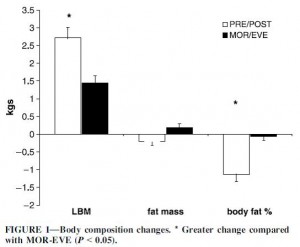
Cribb and Hayes (2006) examined the two extremes of protein consumption: immediately before and after working out (“PRE-POST”) vs. 8 hours before and 8 hours after working out (early morning and late evening; “MOR-EVE”).  Each protein shake contained 40 grams protein, 43 grams glucose, and 7 grams creatine.  The subjects were recreational weight lifters, an interesting choice in terms of data interpretation.  I.e., novices are expected to see much greater gains from beginning a new exercise program than experienced exercisers.  Thus, any difference between the groups is expected to be greater.  For example: compare the difference between 5 and 10 to that of 1 and 2.  The relative difference (2x) is the same in both cases, but the absolute difference between 5 and 10 is significantly greater and thus easier to detect.  This stacked the odds against seeing a difference between treatments.  The advantage is that experienced lifters know how to do a high intensity workout, and the results are applicable to people who already exercise.

Notes on the wonders of energy balance:
The protein shakes added ~272 kcal to their total food intake, which caused them to eat less during the rest of the day.  Interestingly, food intake declined by 74 kcal in the PRE-POST group and over twice as much (172 kcal) in MOR-EVE.  Food intake declined in MOR-EVE because the extra calories were just floating around in the bloodstream and thus available to register lots of “excess energy” to the brain.  But the increase in muscle was 2x greater in PRE-POST than MOR-EVE; thus, the extra calories in PRE-POST were immediately invested in laying down new lean mass and therefore weren’t around to signal “excess energy” to the brain.

energy in energy out is bollocks

How the “energy in” is handled is critically important.  With regard to an energy excess, dessert before bedtime is stored as fat but the same amount of calories from protein before exercise are invested into muscle.

A calorie isn’t a calorie because body composition matters.

Continue reading

These nutters ate only meat for a year. Place your bets!

Who defines “moderation,” anyway?  An homage to pioneering nutrition research III, Op. 100.  Keep an open mind!  (and remember these words: “no clinical evidence of vitamin deficiency was noted.”)

MY LIFE WITH THE ESKIMO (Stefansson, 1913)

The effects on human beings of a twelve months’ exclusive meat diet (Lieb, 1929)

Prolonged meat diets with a study of kidney function and ketosis (McClellan and Du Bois, 1930)

Vilhjalmur Stefansson traveled with Eskimos in the Arctic for 9 years and lived almost exclusively on meat.  Then he and a fellow expeditioner (Andersen) decided to recapitulate this in a well-controlled, albeit warmer (New York), laboratory setting so they could document the metabolic insanity that ensued. At the time, the Eskimo diet was moderate protein, very high fat, yet they had no heart or kidney problems, were glucose tolerant, and exhibited no signs of ketoacidosis.  So the scientists said: “why not?”  (they were really hoping this apparent healthiness wasn’t due to the frigid Arctic temperatures.)

The studies describe the Central Plains’ Indians who subsisted almost entirely of buffalo meat, which they called the “staff of life,” and South American tribes which eat solely beef and water, then go on to say [sic]: “All of these races are noted for their endurance of exertion and hardships.”  They cite two tribes of Eskimos:  Greenlanders, who ate the typical diet (described above) and showed no signs of rickets or scurvey; and the Labradors, who had both diseases but ate more potatoes, flour, and cereals.  While traversing the Arctic, Andersen developed scurvy at a time when he was eating canned foods and very little meat; this was immediately cured by with raw meat :/

Food for thought: this diet is seriously deficient in vitamin C by today’s standards, but they exhibited NO symptoms.  Perhaps vitamin requirements vary based on the background diet?  Maybe our vitamin C requirement is increased by a Western diet (>50% carbs and lots of vegetable oils).  just sayin’

Continue reading

Adipose, Horcrux of Metabolism

Part II.  The importance of the ability to un-store fat: implications for resistance exercise and muscle function in humans.

Adipose triglyceride lipase contributes to cancer-associated cachexia  (Das et al., 2011)

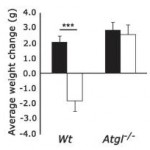
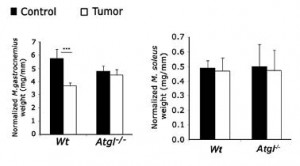
Mice and humans with certain types of cancer lose a lot of weight, a condition known as cachexia.  Besides causing a major decline in quality of life, this usually predicts mortality.  But tumor-burdened ATGLko mice exhibit none of this (closed bar = control; open bar = mice with tumors):

Unfortunately, much of this weight is type II muscle (left), while type I muscle is largely spared (right).  ATGLko mice are immune to muscle loss.

Type II muscle is white, burns sugar, and flexes fast and strong (that’s why I said “unfortunately,” above).  Type I muscle is red, burns fat, and flexes slow and weak.

Continue reading

adipose, horcrux of metabolism

You wanna burn fat?  ATGL (Adipocyte Triacylglycerol Lipase) is your man.  ATGL is responsible for breaking down fat, a necessary precondition for fat burning.  Mice lacking ATGL accumulate tons of fat: 20x more in the heart, 10x more in testis, 3x more in skeletal muscles, 2x more in the GI tract, etc., etc.  Not surprisingly, they’re overweight.

Part 1.  The importance of the ability to un-store fat: appetite, body composition, and insulin.

Continue reading

the bang for your exercise bucks

Exercise causes weight loss when it’s accompanied by diet…  but then again, so does art lessons.  a continuation of “Exercise alone won’t cut it

Effect of an energy-restrictive diet, with or without exercise, on lean tissue mass, resting metabolic rate, cardiovascular risk factors, and bone in overweight postmenopausal women (Svendsen et al., 1993)

Svendsen divided postmenopausal women in their mid-fifties into three groups for 12 weeks: 1) diet; 2) diet + exercise; and 3) none of the above (a weight-maintenance control, kudos!).  Dieters went from eating 1800 to 1000 kcal/d of a high protein low fat diet.  The exercise consisted of 1.5 hours of aerobic and resistance training 3x per week.  The results, in a nutshell: dieting was effective (they lost weight).  Exercising was effective (fitness improved).  So how much additional benefit did exercise provide? Not much.  The diet alone group lost 21 pounds, while the diet + exercise group lost 23 pounds.  Is that worth 4.5 hours of high intensity exercise?  Body composition was mildly improved by the addition of exercise, as body fat percent declined 19% with diet + exercise and only 14% with diet alone.  But 4.5 hours of high intensity exercise is a LOT of work; and resting metabolic rate declined the most in the exercise group.  To its credit, exercise improved fitness considerably, which bodes well for quality of life, but just to keep it straight, diet alone reduced body weight by 21 pounds; exercise took off an additional 2 pounds… BUT as it turns out, those additional two pounds were probably also from diet, as the exercisers reduced food intake by an additional 57 kcal/d.  This doesn’t sound like much, but over the course of 12 weeks it adds up to 4788 kcal (that’s over a pound of fat mass).  In other words, exercise didn’t contribute to the weight loss.  The Laws of Energy Balance can be cruel.

Resistance training does not contribute to improving the metabolic profile after a 6-month weight loss program in overweight and obese postmenopausal women (Brochu et al., 2009)

Study design was similar to Svendsen’s (postmenopausal women, mid-fifties, etc.), with the exceptions that the diet was less strict and the exercise was resistance training, not aerobic (e.g., treadmill).  Dieting worked (both groups lost weight).  Exercising worked (they got significantly stronger).  So how much additional benefit did exercise provide?  You guessed it: not much.  The diet alone group lost 11 pounds; diet + exercisers lost 13 pounds.  3 sessions of high intensity exercise per week for 6 months led to 2 additional pounds of weight loss.  Unlike Svendsen’s exercisers, however, those two hard-earned pounds were probably due to the exercise, as metabolic rate and food intake declined to the same extent in both groups.  6 months of high intensity weight training for two pounds?  The Laws of Energy Balance: merciless.

Effect of diet and exercise, alone or combined, on weight and body composition in overweight-to-obese postmenopausal women (Foster-Schubert et al., 2012)

Saved the best for last: this study included both a weight maintenance control AND an “exercise only” group.  Kudos, Dr Foster-Schubert.  Study design was similar to Brochu’s and Svendsen’s: 12 months; moderate to high intensity aerobic exercise 3-5x per week, yada yada yada.  Dieting worked (the diet alone and diet + exercise groups lost weight).  Exercising worked (the exercise alone and diet + exercise groups got fitter).  So how much additional benefit did exercise provide?  Fail.  The dieters lost 16 pounds while the diet + exercise group lost 20 pounds.  The exercisers lost 4 pounds.  From those numbers, it might appear as though weight loss from exercise contributed mathematically to diet (4 + 16 = 20).  NOPE.  The exercisers cheated, by dieting :/
Exercisers reduced food intake by 185 kcal/d which amounts to a whopping 66600 kcal over the course of a year.  Theoretically, this could’ve amounted to a loss of over 15 pounds of fat mass.  But it didn’t.  Exercise caused a great enough reduction in metabolic rate to dwindle a 20 pound fat loss all the way down 4 pounds.  Exercise made them 16 pounds slothier.  And what about the diet + exercise group; they lost the most weight so surely exercise had to have added something to it?  NOPE, not here either.  They reduced their food intake more than any other group. The Laws of Energy Balance scoff at exercise.

bollocks

So there you have it.  Trying to lose weight via exercise alone is like bringing a cup of water to a forest fire.  It is too easily compensated for by reductions in metabolic rate.  In studies spanning the course of 20 years, exercise has consistently failed to contribute to weight loss.  Exercisers lost weight if and only if they dieted.  Diet + exercise might be as effective as diet + art lessons or diet + Facebook, although the latter two are less likely to make you slothier.  Exercise will make you better, and maybe even happier, just not skinnier.

calories proper

skinny is the new fat, Op. 95

I’ve been known to rave about the phenomenon of metabolically obese normal weight (MONW), or fat skinny people.  In brief, this population exhibits insulin resistance, metabolic syndrome, hypertension… all things usually associated with obesity… but they’re lean.   In fat skinny people, I wrote about two epidemiological studies on markedly different populations (Americans and Koreans); these two peoples have virtually nothing in common (culture, foods, genetics, etc.).  Despite these differences, there was a strong similarity in the macronutrients associated with metabolic dysregulation in otherwise lean individuals (aka fat skinny people): in the first study, high carb and low protein diets were the major culprits, with a smaller contribution of low fat.  In the second study, high carb and low fat were at fault (protein intake wasn’t analyzed).

A new study that is about to hit the presses didn’t intend to say anything about fat skinny people, but they weren’t counting on ME.

Body mass index, diabetes, hypertension, and short-term mortality: a population-based observational study, 2000-2006 (Jerant and Franks, 2012)

This study included over 50,000 people aged 18-90.  Between the years 2000 and 2005 about 3% died, which was statistically just enough to ask “why?”  In brief, they compared body weight, blood pressure, smoking, and diabetes with mortality risk.  

In each BMI category, the square is higher than the circle.  DM = diabetes (the squares).  Diabetes increases mortality risk independent of BMI.  Now just focusing on the squares; as you move from left to right, body weight is increasing but mortality risk in diabetics is decreasing.  A 150 pound diabetic has a higher mortality risk than a 200 pound diabetic, who has a higher mortality risk than a 250 pound diabetic.  Huh?

Perhaps the lean diabetics are fat skinny people, the elusive MONW?  If so, according to the research discussed HERE, their diet might have made them that way.  The lean diabetics (aka fat skinny people aka MONW aka NOD [non-obese diabetics]) eat less protein, more carbs, and less fat.  This might be a reach, but collectively (1 + 2 + 3) these data imply a poor diet might be worse than obesity for diabetics.

disclaimer: this is not true in most circumstances, i.e., skinny people can usually whatever they want.  There are skinny diabetics, but they are significantly rarer than obese diabetics.  In other words, most type II diabetics are obese, the lean ones just eat a crappier diet. You might be wondering: “how are they skinny if they eat so poorly?”  My guess is that they just haven’t eaten enough of it [yet]; it’s rare to stay lean on a “crappier diet.”

So is skinny the new fat?  Being lean with type II diabetes is an indicator of EMPTY CALORIES; it could be riskier for all-cause mortality than obesity in diabetics.

“Attention endocrinologists, diabetologists, and general practitioners: don’t assume diet is not a problem in your skinny diabetics because they are skinny.  Indeed, diet might be THE problem.”

And no, if you’re a skinny diabetic, this DOESN’T mean gaining weight will make you live longer.  it just doesn’t.


it just doesn’t.

calories proper

Yo-yo dieting revisited, a thought experiment

If at first you do not succeed, try, try again.  Opus 94.
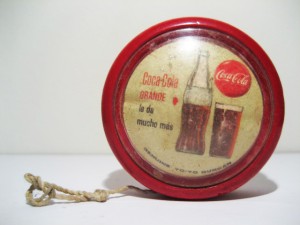
Yo-yo dieting is “probably” not good, but giving up is worse IMO.  I say “probably” because obesity researchers have empirically tested just about every single weight loss intervention except this one.  Furthermore, you’d be hard pressed to find an obese population who’d agree to undergo an intensive weight loss regimen, only to intentionally regain the weight.  Rinse.  Repeat.  The study would be a nightmare to design from a philosophical perspective, and psychological torture to the volunteers.  But what if they did?  Would they end up with more fat mass?  Less?  Right back to where they began?
Changes in energy expenditure resulting from altered body weight (Leibel, Rosenbaum, and Hirsch, 1995)

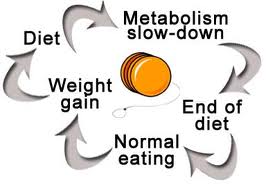
Maybe you don’t recognize the study by name, but you have definitely heard about their key finding: weight loss causes a decline in metabolic rate which makes further weight loss or simply maintaining more difficult.  The other finding was that the opposite also occurs: during weight gain, metabolic rate increases to drive weight back down to its starting point.
bollocks

All-in-all this was a great experiment and it has a lot of street cred; nobody including myself has ever had anything really bad to say about it.  In brief, volunteers were fed either: 1) the maximally tolerated amount of self-selected foods (~6500 kcal!) until they gained 10% of their body weight; or 2) 800 kcal of a liquid formula (40% fat, 45% carbs, and 15% protein) until they lost 10% of their body weight.  
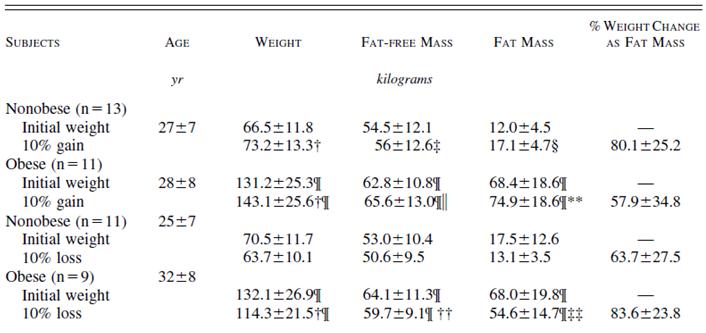
When lean subjects gain 10% of their initial body weight, 80.1% of it is fat mass.  In obese subjects, however, only 58% is fat mass.  Thus, obese people gain more muscle and less fat than lean people during weight gain (e.g., the holidays).  After a 10% weight loss, 64% of the weight is fat mass in lean subjects while a whopping 84% is fat mass in obese subjects.  Thus, obese people lose more fat and less muscle than lean people during weight loss (e.g., New Year’s resolutions).

Here goes nothing:
Take a 100 kg (220 pounds) obese person who has 50 kg fat mass (50% body fat) and a 70 kg (154 pounds) lean person with 14 kg fat mass (20% body fat). After 10% weight loss, body weight declines by 10 kg in the obese subject and 7 kg in the lean subject.  83.6% of the weight lost (~8 kg) is fat mass in the obese subject and 63.7% (~4 kg) is fat mass in the lean subject:

After 10% weight regain, body weight increases 9 kg in the obese subject and 6 kg in the lean subject.  60% of the weight gained (5 kg) is fat mass in the obese subject and 80% (5 kg) is fat mass in the lean subject:

Rinse.  Repeat:

Encore!:
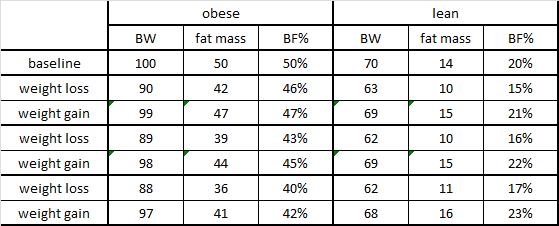
By the end of 3 complete yo-yo cycles, the obese person is down 3 kg body weight, but more importantly their fat mass has declined by 9 kg, from 50% to 42% of their body weight (winner!).  The unfortunate lean subject, however, despite being 2 kg lighter, now has an additional 2 kg of fat mass; in other words, they lost weight but got fattier (20% body fat to start out, 23% by the end).

To be clear, this study has never been done.  But Leibel, Rosenbaum, and Hirsch’s data are impeccable so any flaws in this hypothesis don’t stem from there.  The lean subjects in their study were 154 pounds; clearly not a population in dire need of weight loss.  Perhaps yo-yo dieting got a bad rap from skinny people trying to get skinner, who instead got fattier and told everyone else to give up if dieting didn’t work the first time.  I’m not against pharmacotherapy or bariatric surgery for those in whom diet has failed, but saying “I’m not against” it is a far cry from saying “I’m for it.”  Furthermore, given the results from this thought experiment, among other things, I’m definitely saying “try, try again.”

calories proper

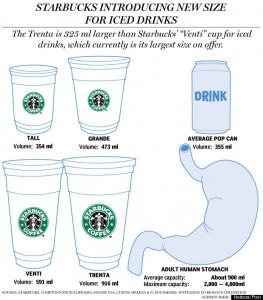
Trenta

Tired at night? Sleepy first thing in the morning?  Bid farewell to your woes, Trenta has arrived.

One small step for man, 1 Litre of coffee for mankind.

>600 mg caffeine = ~10mg/kg

Your nearest Trenta dealer

Bad news if you’re a spider…

Some observations about coffee

1)      Caffeine vs. placebo

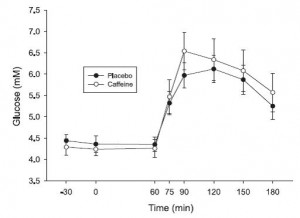
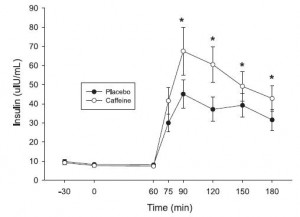
Acute caffeine reduces glucose tolerance.  This would suggest adding sugar to coffee is a no-no.  Sweetener? Perhaps.  The jury is still out.  The caffeine dose used in the study below is 5 mg/kg; that is HALF of the Trenta.

Graham et al., 2001 Canadian Journal of Physiological Pharmacology

2)      Coffee vs. decaf

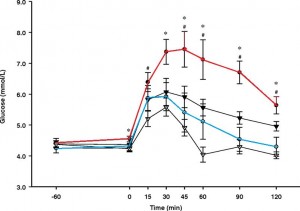
But wait!  coffee (5 mg/kg; red line) vs. decaf (blue line) consumed prior to eating a high glycemic index meal (Moisey L L et al. Am J Clin Nutr 2008;87:1254-1261).  Is caffeine the bad guy?

3)      Coffee vs. decaf vs. caffeine vs. placebo

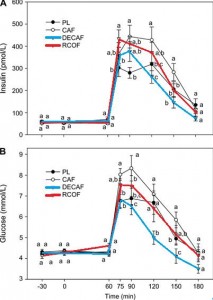
A Ha!   Coffee was worse than decaf (Moisey et al. 2008; Battram et al., 2008)   Caffeine (open circles) was worse than placebo (closed circles) (Graham et al., 2001; Battram et al., 2008)   But caffeine is worse than coffee!?

Battram et al., Journal of Nutrition 2006

What does this mean?  Caffeine is toxic? Coffee inhibits caffeine?  Decaf was almost healthier than placebo.

Decaf + caffeine = coffee?  What else does decaffeination do to coffee?

The whole is greater than the sum of its parts.

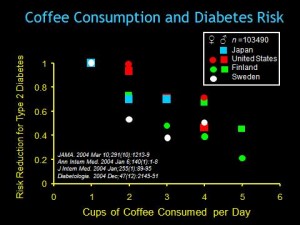
4)      Coffee vs. diabetes risk

BUT epidemiological data suggest the opposite; coffee is protective.

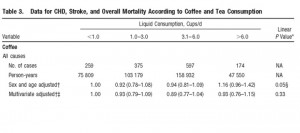
5)      Coffee vs. mortality

de Koning Gans  et al., Arteriosclerosis, Thrombosis, and Vascular Biology. 2010

Coffee had no effect on mortality… or did it?  High coffee drinkers tend to be less healthy – eat more, weigh more, and smoke a lot more than low coffee drinkers.  Thus, uou’d expect their mortality to be higher due to lifestyle habits.  but it’s not.  Either coffee protects against the effects of a poor lifestyle, or we need to re-evaluate what defines a poor lifestyle.


calories proper


Become a Patron!