Tag Archives: carbs

A historical argument against caloric equality

80 years later, a calorie still isn’t a calorie.

Exhibit A.

The treatment of obesity   (Lyon and Dunlop, 1932)

As early as 1932, Lyon and Dunlop recognized that the calories from as little as one slice of bread every day could result in pounds of fat mass gained every year.  For whatever reason, this doesn’t happen to lean people; so they decided to study the effect of different diets on obese subjects in a metabolic ward at the Royal Infirmary.

Their idea of a “diet:” If they could only see how much times have changed!  (this is a hotly debated topic.)

Lyon and Dunlop first tested weight loss vs. total calorie intake.  The diet was roughly 40% carbs, 24% protein, and 36% fat.  Not surprisingly, people fed 800 kcal/d lost more weight than those given 1,000 or 1,200 kcal/d (200 vs. 172 vs. 157 grams of body weight lost per day over the period of 7 – 10 days), confirming that the less you eat, the more weight you lose (duh).  A calorie is a calorie after all, right? …

Continue reading

The easy diet diet II

Full disclosure.  IMHO, with regard to obesity and weight loss diets, low carb is a little bit better, most of the time.  It’s not such a huge difference that it’s ridiculously obvious, and in situations where low carb proper is too impractical, it might just be more important to focus on eliminating as many empty calories as possible.  Because as discussed in the Easy diet diet, Op. 72, you don’t have to go militant zero carb; simply “low carb seems to work pretty well.

In type 2 diabetes, randomization to advice to follow a low-carbohydrate diet transiently improves glycaemic control compared with advice to follow a low-fat diet producing a similar weight loss (Gulbrand et al., 2012)

[if you follow the advice, that is, at least to some degree] Continue reading

Nutrient timing, Op. 101

There is no longer a debate on the value of protein supplements for exercisers.  Now I’d like to make the case for protein timing, or more specifically the value of pre-workout protein supplementation.

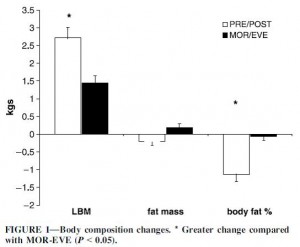
Cribb and Hayes (2006) examined the two extremes of protein consumption: immediately before and after working out (“PRE-POST”) vs. 8 hours before and 8 hours after working out (early morning and late evening; “MOR-EVE”).  Each protein shake contained 40 grams protein, 43 grams glucose, and 7 grams creatine.  The subjects were recreational weight lifters, an interesting choice in terms of data interpretation.  I.e., novices are expected to see much greater gains from beginning a new exercise program than experienced exercisers.  Thus, any difference between the groups is expected to be greater.  For example: compare the difference between 5 and 10 to that of 1 and 2.  The relative difference (2x) is the same in both cases, but the absolute difference between 5 and 10 is significantly greater and thus easier to detect.  This stacked the odds against seeing a difference between treatments.  The advantage is that experienced lifters know how to do a high intensity workout, and the results are applicable to people who already exercise.

Notes on the wonders of energy balance:
The protein shakes added ~272 kcal to their total food intake, which caused them to eat less during the rest of the day.  Interestingly, food intake declined by 74 kcal in the PRE-POST group and over twice as much (172 kcal) in MOR-EVE.  Food intake declined in MOR-EVE because the extra calories were just floating around in the bloodstream and thus available to register lots of “excess energy” to the brain.  But the increase in muscle was 2x greater in PRE-POST than MOR-EVE; thus, the extra calories in PRE-POST were immediately invested in laying down new lean mass and therefore weren’t around to signal “excess energy” to the brain.

energy in energy out is bollocks

How the “energy in” is handled is critically important.  With regard to an energy excess, dessert before bedtime is stored as fat but the same amount of calories from protein before exercise are invested into muscle.

A calorie isn’t a calorie because body composition matters.

Continue reading

These nutters ate only meat for a year. Place your bets!

Who defines “moderation,” anyway?  An homage to pioneering nutrition research III, Op. 100.  Keep an open mind!  (and remember these words: “no clinical evidence of vitamin deficiency was noted.”)

MY LIFE WITH THE ESKIMO (Stefansson, 1913)

The effects on human beings of a twelve months’ exclusive meat diet (Lieb, 1929)

Prolonged meat diets with a study of kidney function and ketosis (McClellan and Du Bois, 1930)

Vilhjalmur Stefansson traveled with Eskimos in the Arctic for 9 years and lived almost exclusively on meat.  Then he and a fellow expeditioner (Andersen) decided to recapitulate this in a well-controlled, albeit warmer (New York), laboratory setting so they could document the metabolic insanity that ensued. At the time, the Eskimo diet was moderate protein, very high fat, yet they had no heart or kidney problems, were glucose tolerant, and exhibited no signs of ketoacidosis.  So the scientists said: “why not?”  (they were really hoping this apparent healthiness wasn’t due to the frigid Arctic temperatures.)

The studies describe the Central Plains’ Indians who subsisted almost entirely of buffalo meat, which they called the “staff of life,” and South American tribes which eat solely beef and water, then go on to say [sic]: “All of these races are noted for their endurance of exertion and hardships.”  They cite two tribes of Eskimos:  Greenlanders, who ate the typical diet (described above) and showed no signs of rickets or scurvey; and the Labradors, who had both diseases but ate more potatoes, flour, and cereals.  While traversing the Arctic, Andersen developed scurvy at a time when he was eating canned foods and very little meat; this was immediately cured by with raw meat :/

Food for thought: this diet is seriously deficient in vitamin C by today’s standards, but they exhibited NO symptoms.  Perhaps vitamin requirements vary based on the background diet?  Maybe our vitamin C requirement is increased by a Western diet (>50% carbs and lots of vegetable oils).  just sayin’

Continue reading

adipose, horcrux of metabolism

You wanna burn fat?  ATGL (Adipocyte Triacylglycerol Lipase) is your man.  ATGL is responsible for breaking down fat, a necessary precondition for fat burning.  Mice lacking ATGL accumulate tons of fat: 20x more in the heart, 10x more in testis, 3x more in skeletal muscles, 2x more in the GI tract, etc., etc.  Not surprisingly, they’re overweight.

Part 1.  The importance of the ability to un-store fat: appetite, body composition, and insulin.

Continue reading

skinny is the new fat, Op. 95

I’ve been known to rave about the phenomenon of metabolically obese normal weight (MONW), or fat skinny people.  In brief, this population exhibits insulin resistance, metabolic syndrome, hypertension… all things usually associated with obesity… but they’re lean.   In fat skinny people, I wrote about two epidemiological studies on markedly different populations (Americans and Koreans); these two peoples have virtually nothing in common (culture, foods, genetics, etc.).  Despite these differences, there was a strong similarity in the macronutrients associated with metabolic dysregulation in otherwise lean individuals (aka fat skinny people): in the first study, high carb and low protein diets were the major culprits, with a smaller contribution of low fat.  In the second study, high carb and low fat were at fault (protein intake wasn’t analyzed).

A new study that is about to hit the presses didn’t intend to say anything about fat skinny people, but they weren’t counting on ME.

Body mass index, diabetes, hypertension, and short-term mortality: a population-based observational study, 2000-2006 (Jerant and Franks, 2012)

This study included over 50,000 people aged 18-90.  Between the years 2000 and 2005 about 3% died, which was statistically just enough to ask “why?”  In brief, they compared body weight, blood pressure, smoking, and diabetes with mortality risk.  

In each BMI category, the square is higher than the circle.  DM = diabetes (the squares).  Diabetes increases mortality risk independent of BMI.  Now just focusing on the squares; as you move from left to right, body weight is increasing but mortality risk in diabetics is decreasing.  A 150 pound diabetic has a higher mortality risk than a 200 pound diabetic, who has a higher mortality risk than a 250 pound diabetic.  Huh?

Perhaps the lean diabetics are fat skinny people, the elusive MONW?  If so, according to the research discussed HERE, their diet might have made them that way.  The lean diabetics (aka fat skinny people aka MONW aka NOD [non-obese diabetics]) eat less protein, more carbs, and less fat.  This might be a reach, but collectively (1 + 2 + 3) these data imply a poor diet might be worse than obesity for diabetics.

disclaimer: this is not true in most circumstances, i.e., skinny people can usually whatever they want.  There are skinny diabetics, but they are significantly rarer than obese diabetics.  In other words, most type II diabetics are obese, the lean ones just eat a crappier diet. You might be wondering: “how are they skinny if they eat so poorly?”  My guess is that they just haven’t eaten enough of it [yet]; it’s rare to stay lean on a “crappier diet.”

So is skinny the new fat?  Being lean with type II diabetes is an indicator of EMPTY CALORIES; it could be riskier for all-cause mortality than obesity in diabetics.

“Attention endocrinologists, diabetologists, and general practitioners: don’t assume diet is not a problem in your skinny diabetics because they are skinny.  Indeed, diet might be THE problem.”

And no, if you’re a skinny diabetic, this DOESN’T mean gaining weight will make you live longer.  it just doesn’t.


it just doesn’t.

calories proper

what is our proper “natural” diet?

Figuring out how best to eat, physiological insulin resistance, and an homage to pioneering nutrition research.

Insulin resistance, as we know it today, is associated with poor nutrition, obesity, and the metabolic syndrome.  But it’s FAR more interesting than that.  Indeed, it could even save your life.  At the time when the pioneering studies discussed below were occurring, the researchers had no idea insulin resistance was going to become one of the most important health maladies over the course of the following century.  Furthermore, these somewhat-primitive studies also shed some light, possibly, on how we should be eating.  hint: it might all come down to physiological insulin resistance.

The reduced sensitivity to insulin of rats and mice fed on a carbohydrate-free, excess fat diet (Bainbridge 1925, Journal of Physiology)

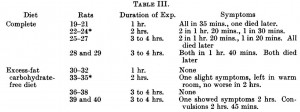
Rats were fed either a normal starch-based diet (low fat), or a high butter diet (low carb) for one month, then fasted overnight and injected with a whopping dose of insulin (4 U/kg).  First, take a guess, what do you think happened and why.  Then, click on the table below.

To make a long story short, all the starch-fed rats died while all the butter-fed rats lived.

On a high-fat zero-carb diet, plasma insulin levels are low.  Insulin is low because there no carbs (i.e., it’s supposed to be low).  Under conditions of low insulin, unrestrained adipose tissue lipolysis leads to a mass exodus of fatty acids from adipose tissue.  These fatty acids accumulate in skeletal muscle and liver rendering these tissues insulin resistant.  But this doesn’t matter, because insulin sensitivity is unnecessary when there aren’t any carbs around.  So if that rogue research scientist who’s always trying to jab you with a syringe filled with insulin actually succeeds, you won’t die.  The high-fat diet prevents insulin-induced hypoglycemic death.  This is physiological and absolutely critical insulin resistance.

To determine if this was specific to dairy (butter) or a general effect of a high fat zero carb diet, Bainbridge repeated the experiments with lard.  Lo-and-behold, lard-fed rats were just as fine as those dining on butter.  

To be sure, these studies exhibited a high degree of animal cruelty… but their simplicity is laudable.  And Bainbridge’s findings are not an isolated case.

Studies on the metabolism of animals on a carbohydrate-free diet.  Variations in the sensitivity towards insulin of different species of animals on carbohydrate-free diets (Hynd and Rotter, 1931)

Instead of starch, lard, and butter, Hynd and Rotter used milk and bread, cheese, and casein.  And their findings were essentially identical to Bainbridge’s: mice, rats, or rabbits fed carbohydrate-free diets were insulin resistant and protected against insulin-induced tragedies.

The interesting finding was in kittens, who sadly maintained insulin sensitivity when fed fish (high protein) or cream (high fat).

You’re probably thinking: why would I say any state of heightened insulin sensitivity is “sad?”  WELL, I say “sad” because we’re talking about physiological insulin resistance; a condition when resistance to the hypoglycemic effect of insulin is essential, and lack thereof is incompatible with survival.  To be clear: 1) kittens remain insulin sensitive on high fat and protein diets; and 2) this is OK because there aren’t any rogue research scientists running around trying to jab them with insulin.  While I can’t say for sure, this might have something to do with what kittens are supposed to eat, i.e., their natural diet.  High protein and fat diets won’t make them insulin resistant because unlike rodents, that is their normal diet.  (real mice eat fruits and seeds; laboratory mice eat pelleted rodent chow; cartoon mice eat cheese.)   Lard causes ectopic lipid deposition in insulin sensitive tissues in rodents because they aren’t accustomed to it.  Mice are optimized to eat a high carb diet.  Kittens eat protein and fat, usually in the form of mice.  But when given bread, kittens develop insulin resistance.  There is no bread in mice.

While we shouldn’t base our diet around the possibility of turning a corner and being jabbed with a syringe filled with insulin, perhaps we are simply more similar to kittens.  Hypercaloric diets loaded with sugar, excess carbohydrates, and empty calories cause [pathological] insulin resistance (which could theoretically save your life if a rogue research scientist jabbed you with insulin), whereas the opposite is true for diets high in fat and protein.  This is repeatedly demonstrated in diet intervention studies, most recently in the notorious Ebbeling study (Missing: 300 kilocalories).  When people were assigned to the very low carbohydrate diet, insulin sensitivity was significantly higher than when they were on low fat diets:Soapbox rant: I’m not saying low carb is what we are supposed to eat.  Nor am I saying it is the optimal diet.  IMHO any diet which excludes processed junk food and empty calories is “healthy.”  The Paleo diet isn’t healthy because some nutritionista says it’s what we are supposed to eat; Paleo is healthy for the same reason as Atkins, Zone, South Beach, and a million others: no junk food.

Maybe the diet we’re supposed to eat has nothing to do with the healthiest diet.  Maybe not.  But it probably isn’t bad for you.  just sayin’

calories proper

Coconut flour is a protein & fiber powerhouse, Op. 90

and similar to almond flour, it’s gluten-free and anti-hyperglycemic (i.e., the opposite of white flour).

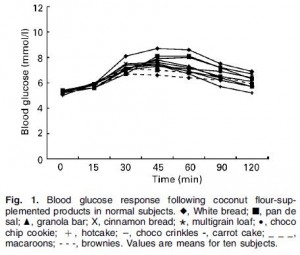
Glycaemic index of different coconut-flour products in normal and diabetic subjects (Trinidad et al., 2003)

In this CROSSOVER study, different doses of coconut flour were incorporated into common test foods to see how they impacted the blood glucose response to said test foods.  The total carbohydrate load of each food was 50 grams and to make a long story short, coconut flour dose-dependently reduced the glycemic index.

There’s a lot happening in that figure, but basically the foods with the least coconut flour (e.g., white bread) elicited far greater increases in blood glucose than foods with the most coconut flour (e.g., coconut flour brownies).  Mechanistically, this is most likely due to coconut flour’s fiber and/or fat content (both of which slow down glucose absorption and both of which are markedly higher in coconut flour compared than white flour).

Coconut flour: anti-hyperglycemic

Moving on,
the lipid component of coconut flour, coconut oil, is kind-of-amazing in itself.

1) Coconut oil is a perfectly suitable substitute for butter if you’re following a casein-free diet (e.g., GFCF).  You don’t need to be a molecular gastronomer or food scientist to try it; refined coconut oil can be used just like butter (“virgin” coconut oil, on the other hand, retains a strong coconut flavor).

2) Coconut oil is rich in the magical ketogenic medium chain fatty acids (e.g., C12 laurate) and to over-simplify a series of very elegant studies on diet and diabetes (detailed in Diet, diabetes, and death [oh my] [highly recommended reading if you’re into fatty acids, etc.]), coconut oil is remarkably protective against diabetic pathophysiology; a property not shared with lard, corn oil, or shortening.

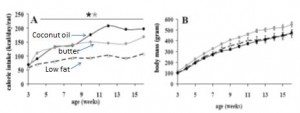
Indirect confirmation of the presence of ketogenic medium chain fatty acids in coconut oil can be seen in this study by Romestaig.  Rats fed a diet rich in coconut oil ate more calories but gained less weight than rats fed a high butter or low fat diet:

Coconut oil-fed rats (solid black circles) ate more than the butter group but weighed less.  Coconut oil-fed rats ate WAY more than the low fat group but weighed just as much.  Nice, huh?  Getting back to the point, this is virtually identical to what happens on bona fide ketogenic diets (see Episode 2 of the ketosis series and Ketosis, III), where carbohydrates are kept below 5% of calories (which is phenomenally low, 25 grams on a 2000 kcal diet).

Coconut flour: anti-hyperglycemic
Coconut oil: ketogenic
Coconut protein ?  … calorie for calorie, coconut flour has more protein than most other flours.

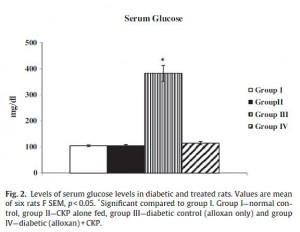
In recent study on diabetic rats, Salil showed that coconut protein completely protected against alloxan-induced diabetes (this study was published in 2011; unlike the earlier studies referenced above, researchers are no longer allowed to give fatal doses of alloxan to rats and count the days until they die.  Nowadays they just look at the surrogate marker blood glucose [it goes up very high in diabetes]).  Alloxan is a pancreatic toxin which destroys insulin-producing beta cells.

Group 1 (open bar) = controls group.  Group II (black bar) = fed coconut protein.  Group III (vertical stripes) = diabetic.  Group IV (diagonal stripes) = diabetic and fed coconut protein.  A diet high in coconut protein made these rats invincible to alloxan… just like coconut oil.  Coincidence?  (to be continued)

Coconut oil and coconut protein are both present in coconut flour.   While it’s not as expensive as almond flour, coconut flour is still pricier than regular white flour.  But people love their baked goods, pastas, and breads.  If there is ever going to be a way for these foods exit the realm of “empty calories,” the first step is abandoning white flour.  Maybe your muffins won’t be so big and fluffy, but neither will your ass.

calories proper


Almonds: nutrition’s coolest drupe, Op. 89

(it’s a “drupe,” not a nut.  [Thank you Wikipedia.])

Should almonds be upgraded from “snack” to food?  Should almond flour be used in place of some or all white flour?  Yes and yes, IMHO.

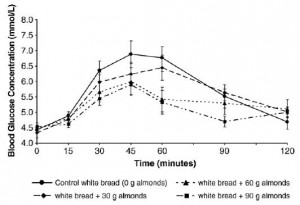
In 2007, Josse and colleagues did a quick-and-dirty study on almonds and glucose tolerance.  They fed a group of volunteers 50 grams of carbs from white bread and either 0, 30, 60, or 90 grams of almonds and then measured blood glucose over the following two hours.  “Quick” because they probably had almonds and bread in the refrigerator, and glucometers in their desk drawers; “dirty” because there were a lot of uncontrolled variables; for example: fiber, protein, and fat content of the test meals differed wildly:In a proper study, they might have tried to feed everyone the same amount of fiber, protein, and fat, because each of these is known to affect blood glucose.  In any case, the result was pretty cool:

Whole almonds dose-dependently blunted the blood glucose response to the test meal.  Conclusion: almonds = anti-hyperglycemic.  But almonds are complex lil’ things; they’re made of protein, fat, fiber, and a lot of nutrients; so what’s responsible for all the anti-hyperglycemic effect?  this post is not simply an academic pursuit; indeed, almond flour and almond oil are commercially available, affordable, widely used, and are comprised of different fractions of the almond.  So Mori and colleagues decided to study.

Acute and second-meal effects of almond form in impaired glucose tolerant adults: a randomized crossover trial.  (Mori et al., 2011)

In this excessively high quality study, the effect of 4 different types of almond preparations on glucose tolerance was assessed.

What was tested (in a FIVE-WAY crossover study):
WA = whole almonds
AB = almond butter
AF = defatted almond flour (remember this stuff? lacks all the bifidogenicity of regular almond flour )
AO = almond oil
V = vehicle: negative control.

Basically, the participants were fed a breakfast of OJ and Cream of Wheat with the equivalent of 33 almonds (42.5 grams) for a total of 75 grams of carbs, and blood glucose was measured over the next 2 hours.

Notable nutritional differences between the almond preparations:  they all contain a similar fat content except for the defatted almond flour; whole almonds and almond butter have 2-3 times more fiber than almond flour and almond oil; almond oil has half the protein as all the others.

In brief, no almond preparation affected insulin or free fatty acids.

Whole almonds, almond butter, and almond oil, on the other hand, all blunted the glycemic response.  Defatted almond flour, which only really differs in its lack of almond fat, did not.  Thus, according to last post, almond fat is a potent bifidogen (i.e., good for gut bacteria); and now we see it’s also responsible for the anti-hyperglycemic effect of almonds.  These two effects are probably unrelated, however, as any effect on gut bacteria will take significantly longer than a few hours as the almond fat hasn’t even reached the large intestine by then… (the anti-hyperglycemic effect is evident within 2 hours; the bifidogenic effect noted by Mandalari was 8-24 hours).

OK, almond fat slows the absorption of glucose, so what? this is not exciting… it’s common among most fats- “dietary fat reduces the glycemic index of food.”  But this has a greater implication: one could alternatively conclude that almond flour’s lack of fiber was at fault, as dietary fiber is also known to slow glucose absorption.  However, almond oil, which has even less fiber than defatted almond flour, was also anti-hyperglycemic.  So it’s not the fiber (… perhaps because almond fiber is predominantly insoluble).

With regard to all-things-almonds: almond fat, not almond fiber, is anti-hyperglycemic and bifidogenic (what can’t it do?).

Almond fat: +2

Solution: whole almonds (with meals?), almond oil (with whatever), and regular [non-defatted] almond flour (for baking?).  WRT the latter, get all the benefits, a boost for the gut microbiota, and significantly fewer carbs than with white flour (while actually attenuating the glycemic impact of said white flour).

An argument for almond flour: most baked goods are made with white flour.  These foods are predominantly empty calories, the bane of human health and well-being.  Substituting almond flour for white flour is one way to decrease the emptiness of those calories, and thus of life itself (it’s gluten-free too).

calories proper

Missing: 300 kilocalories

or
Weight-loss maintenance, part II (as promised)

Effects of dietary composition on energy expenditure during weight-loss maintenance (Ebbeling et al., 2012)

A three-way crossover study!  Excellent study design.  In brief, the participants lost 30 pounds in 12 weeks on a pseudo-Zone diet (the official version) consisting of 45% carbs, 30% fat, and 25% protein, then switched to one of 3 “weight-loss maintenance” diets for 4 weeks.  (FTR “weight-loss maintenance” cannot even be remotely assessed in 4 weeks, but what the heck, it was a THREE-WAY CROSSOVER.)

To put the issue to bed before it is even raised, the volunteers were given professionally prepared food for about half a year and paid ~$2,500 if they stuck to the plan.  They STUCK to the plan.

or more simply: 

The diets were classified by the authors as high glycemic load (high carb low fat), low glycemic index (e.g., Mediterranean Diet), & low carb (e.g., Atkins Diet).

These “glycemic” indices in general are primarily determined by the carb & fat contents.  A low carb diet will always have a low glycemic index and low glycemic load, and the opposite is true for a low fat high carb diet.  Any high glycemic index food turns into a low glycemic index meal when it’s combined with other foods (like we normally eat).  The only way to make a strictly high GI diet is with low fat; the easiest way to make a low GI diet is with low carb.

The major outcome measurements dealt with energy expenditure, with the premise being that preservation of metabolic rate after weight loss should improve “weight-loss maintenance.”

Resting energy expenditure (REE) is measured by indirect calorimetry.  It’s the amount of calories that a total couch potato would burn daily and is usually determined by body composition (more muscle = higher REE).  While body composition was similar in each group, REE was modestly higher in subjects on the low carb diet.

RQ (respiratory quotient) measures the relative amount of fat and carbs you’re burning: 0.7 = fat oxidation; 1.0 = carb oxidation.  It is determined by diet (eat more carbs, burn more carbs), body composition (have more body fat, burn more body fat), and exercise intensity (marathons burn fat; sprints burn carbs).  The higher carb oxidation on the low fat diet and higher fat oxidation on the low carb diet likely reflect the respective dietary compositions.


Total energy expenditure (TEE) is exactly what its name implies.  It’s the total amount of calories you burn in a day.  If your body weight is stable, then this is also approximately how many calories you’re eating.  This result is actually pretty interesting.  TEE on the low carb diet was over 300 kcal higher relative to the low fat diet.  This is probably at least partially due to the higher protein content of the diet (30% vs. 20% of total calories or 150 vs. 100 grams per day).  TEE of the intermediate low GI diet was in between low fat and low carb diets (2937 kcal/d), so TEE increased as carb intake declined and fat intake increased across all 3 diet groups.  Follow the blue boxes in the figure below to see the averages, and since this was a THREE-WAY CROSSOVER (!), you can follow the lines to see how each person fared individually:
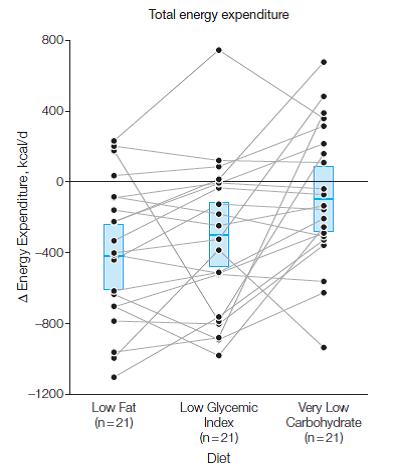
300 kcal is equivalent to an hour of exercise, yet subjects on low carb weren’t exercising more (although the slowly-losing-his-wits-Dr Bray suggested otherwise in an editorial, arguing that the increased TEE/REE ratio meant increased physical activity, despite the actual data, which showed if anything, slightly lower total and moderate-vigorous intensity physical activity in the low carb group).

Burning an additional 300 kcal per day is like losing over 2 pounds of fat per month by doing exactly nothing.  BUT

to be clear (e.g., disclaimer, mea culpa, evidence of heresy, etc.):

  1. all participants in the study ate the same amount of calories
  2. low carbers burned over 300 more calories per day compared to low fat dieters
  3. body composition  and body weight were similar between the groups

300 calories per day is a LOT of calories, why didn’t it impact weight loss?

This seemingly paradoxical conclusion suggests energy intake is the primary determinant of weight loss, independent of energy expenditure and diet composition.  It is either a violation of The Laws of Energy Balance, experimental error, or evidence of dark magic.

Moving on,

the authors were quick to note urinary cortisol (an anti-inflammatory and stress hormone) and CRP (a marker of systemic inflammation) were highest on low carb, and this could cause insulin resistance.  However, I’d note 2 things: 1) CRP declined in ALL groups relative to baseline, but the reduction was less in low carbers compared to the other groups; and 2) CRP was low and within the normal range in all subjects throughout the entire study. But most importantly, hepatic and peripheral insulin sensitivity improved most in low carbers, in whom CRP and cortisol was the highest.

Similar to the Jakubowicz study (dessert for breakfast), the Ebbeling study was interesting but not groundbreaking; nothing to write home about.  Both showed modest benefits for low carb over low fat.  The news media haven’t feasted on these studies yet, but when they do, however, I’m sure they’ll disagree.  “Weight-loss maintenance” is a riddle wrapped in a mystery inside an enigma, not a simple question to be elucidated by a mere 4-week diet study, even if it’s a three-way crossover.  even if it has dark magic.

If you’d like to consult with me, reach out: drlagakos@gmail.com.

Check out my Patreon campaign! Five bucks a month gets you full access and there are many other options. It’s ad-free and you can quit if it sucks 🙂

Affiliate links: Still looking for a pair of hot blue blockers? TrueDark is offering 10% off HEREand Spectra479 is offering 15% off HERE. If you have no idea what I’m talking about, read this then this.

Join Binance and get some cryptoassets or download Honeyminer and get some Bitcoins for free

20% off some delish stocks and broths from Kettle and Fire HERE

If you want the benefits of  ‘shrooms but don’t like eating them, Real Mushrooms makes great extracts. 10% off with coupon code LAGAKOS. I recommend Lion’s Mane for the brain and Reishi for everything else

Join Earn.com with this link.

Start your OWN Patreon campaign!

calories proper


Save