Category Archives: Uncategorized

Empty calories III

Empty calories.  Nutrient density.  Empty calories.  The ANDI score?

With the advent of the ANDI, it is safe to say the phrase, school of thought, and cult following to “a calorie is a calorie” is fading.  All calories were not created equal; some make you fat, others make you strong.  Cantankerous old biochemists and low-fat diet proponents will likely remain loyal, however, with the former citing heat production in a bomb calorimeter (mumbo), and the latter citing the equivalency of nutrient density and animal fat scarcity (jumbo).

But for the rest of us, there is gravitas in this concept       empty calories.

A good place to start might be a critical view of Fuhrman’s  Aggregate Nutrient Density Index (ANDI).  In brief, ANDI is an index of healthiness and is calculated by dividing the amount of nutrients in a given whole food by the calories.

Pro’s and con’s

1)      it only applies to whole foods.  This is convenient because most processed foods would score miserably low unless they’ve been industrially fortified with synthetic vitamin-like chemicals.  Perhaps Fuhrman restricted ANDI to whole foods because something like Diet Coke Plus would score about a million (lots of vitamins, few if any calories), rendering ANDI utterly meaningless to the masses and downright offensive to people like me.


2)       “nutrients per calorie” is a far more biologically meaningful and physiologically relevant concept than “calories per gram.”

  1. “Calories per gram” can be too easily manipulated.  E.g., one ounce (~28 grams) of soybean oil has 248 kilocalories: 248 kilocalories / 28 grams ? 9 kcal/g.  Add it to an ounce of water and you get 248 / 56 ? 4.4 kcal/g.  It’s still the same nutritionally, but the “caloric density” was halved by trickery.
  2. “Nutrients per calorie” is relatively unchangeable.  Let’s say there are 14 grams of omega-6 fatty acids in an ounce of soybean oil; that would be 14 grams per 248 kcal.  Add it to an ounce of water and it’s still true.  Drink it on the moon and it’s still true (relatively).

However,

1)      ANDI selectively quantifies only one aspect of a food’s nutritional value.  It is an important aspect, but please note that a diet based on high ANDI foods would be nutritionally inadequate.  Furthermore, there are highly relevant health parameters that ANDI completely ignores.  More questions:

  1. Shouldn’t more important nutrients be given a higher score?
  2. Shouldn’t excess amounts of a nutrient detract from the score?
  3. What about other non-nutritive health-promoting properties of a food?  E.g., foods that are healthier than indicated by their ANDI score:
    1. i.      foods that have some as-of-yet undiscovered nutrients
    2. ii.      foods that indirectly promote health (like pre- or pro-biotics)

2)      Furthermore, ANDI is fundamentally flawed in its application to foods whose value is based at least partially on the actual calories themselves.

  1. Fuhrman uses the ANDI score on fats, which score dismally low because they contain few “nutrients” and a lot of calories.  Thus, industrially-modified, partially-hydrogenated trans fat-rich soybean oil has the same ANDI score as olive oil.
  2. Animal proteins, including grass-fed beef, wild salmon, and pastured eggs, also score incredibly low.  These foods are far more healthful than many most others, essential for life (unlike kale, which is the highest-scoring ANDI food), and much of their value is contained in the quality of their calories.
    1. i.      the fatty acids in salmon are healthy in and of themselves; they don’t contain any nutrients per se; they ARE the nutrient.  But ANDI doesn’t take this into account; it views all fatty acids as empty calories, a grave mistake.
    2. ii.      the same goes for animal proteins.  Eggs, for example, are higher in protein quality than any other food on the ANDI scale yet they score quite low.  And getting a bio-equivalent amount of protein from lower quality plant proteins would require consuming many more calories.

The failure of ANDI to incorporate any measure of fat or protein quality is its demise; why it is unable to stand alone as an indicator of healthiness… a diet consisting exclusively of high ANDI foods is incompatible with life.  A protein deficiency would be vastly more severe than a low ANDI diet, and on a lighter note, the fish oil fatty acids would provide much greater benefits than a high ANDI diet.  These nutritional factors play too big a role in determining healthspan and quality of life to be ignored.

BUT, ANDI is nice in its simplicity, and it works very well for most plant-based foods.  E.g., spinach and cabbage have very high ANDI scores; rice, grains, and pasta have very low ANDI scores.

The diets of many cultures are based almost exclusively on low-ANDI foods.  This is largely because it is much easier to produce enough calories to feed a village than to produce enough nutrients.  Starvation is deadlier than dermatitis.  In the Western world, however, we are fighting a different battle: you need to eat a LOT of empty calories in order to get enough nutrients, but then you get fat.


calories proper


Empty calories, part I

Empty calories, part I


Moderation- the avoidance of excess or extremes

Balanced- arranged in good proportions

What is a well-balanced diet?  Everything in moderation?

WRT nutrition, these phrases are meaningless.  There are healthy people around the world who consume a wide variety of diets.  A dietary staple in one culture may be completely absent or even shunned from another equally healthy culture.  And that same dietary staple could be the cause of disease in yet another culture.  Furthermore, “moderation” and a “well-balanced diet” are generally used reflectively, whereby the speaker is referring to their own diet as the healthy baseline, and any deviations can be included but only in “moderation,” as any deviations would certainly be less healthy, otherwise the speaker would be touting that diet instead.

Does it refer to whole foods, or the individual food components.  IOW, should we consume in moderation processed foods? How about the trans-fats found in hydrogenated soybean oil from said processed foods?

If a diet contains 100 grams of fat how much of that would be considered “moderate?”  Half?  Not if we are talking about industrial trans fats.  Certain foods should be minimized or avoided altogether…  neither in moderation nor as part of a well-balanced diet.

For a very basic example, carbohydrate’s provide ~62% of the calories for Indian city-dwellers, yet the rate of carbohydrate intolerance is 14%!

Dietary intake and rural-urban migration in India: a cross-sectional study (Bowen et al., 2011)

But the Kitavan’s get 69% of their calories from carbohydrates and there isn’t a diabetic on the entire island!

How can this be?  There are too many confounding variables to put an exact number on “moderation.”   The Indian urbanites from Bowen’s study consumed over 3,200 kcal per day, while the Kitavans are closer to 2,100…  But ¾ of the Kitavans smoke and they get little physical activity…?

Low serum insulin in traditional Pacific Islanders—the Kitava Study (Lindeberg et al., 1999 Metabolism)

The “well-balanced diet” does not exist.

The Mediterranean diet might be optimal for people living in Italy and Greece, but the long-term consequences of mismatching diet and the seemingly infinite lifestyle variables confounds the application of this to other cultures.  And even within a given culture, there will be pen pushers and manual laborers who would be optimally suited with vastly different macronutrients and calories.

And the reverse is also true.   Exercise and a high level of physical activity may keep one population lean and fit, but that doesn’t mean increasing exercise and physical activity will prevent a different population from becoming obese.

Physical activity energy expenditure has not declined since the 1980s and matches energy expenditure of wild animals (Westerterp and Speakman, 2008 International Journal of Obesity)

WRT nutrition, “moderation” is meaningless.


Calories proper

Trans fats, take III

Man vs. ape     Or
Postmenopausal women vs. Africa green monkeys


Two good and potentially somewhat contradicting studies on our good old friends, trans fats.

Trans fat diet induces abdominal obesity and changes in insulin sensitivity in monkeys. (Kavanagh et al., 2007 Obesity)

In this study, Kavanaugh and colleagues fed either a control diet or one fortified with trans fatty acids to a group of African green monkeys for 6 years.  Two immediate strengths of this study are 1) the use of primates, who respond to dietary intervention much more similarly to humans than rodents, and 2) the duration is long enough to model what would be seen in a human population.  Furthermore, to prevent differences in food intake from affecting the outcome, all of the animals were fed 70 kcal/kg of their initial body weight.  This feeding regimen was chosen specifically to prevent an energy imbalance, i.e., the monkeys were to be “weight stable” for the entire study.  This method is superior to pair feeding, where one group is fed ad libitum and the other group is given the same amount of calories as the first group, but instead of grazing all day (normal behavior) they get it all in one sitting.  Pair feeding is stressful for the animals and causes a whole host of other problems.  Both groups in this study received exactly the same amount of food (70 kcal/kg of initial body weight) every day for 6 years.

At the beginning of the study, the monkeys weighed ~6.5 kg (14.3 pounds); thus, for the rest of the study they were fed 455 kilocalories every day.  The diet consisted of 35% fat, 17% protein, and 48% carbohydrates.

The diet for half of the monkeys was supplemented with 8%, or ~4 grams, of trans fatty acids.  The average intake for humans is 3%, or ~7 grams per day.  An intake level of 8% for humans is around 18 grams, which could be accomplished by eating fast food or microwave popcorn a few times per week.  So besides being informative and shedding a new light on energy balance, this study is also of practical relevance.

Furthermore, the trans fat they chose was similar to the most abundant trans fat found in human diets (processed foods): partially hydrogenated soybean oil.

The diet:
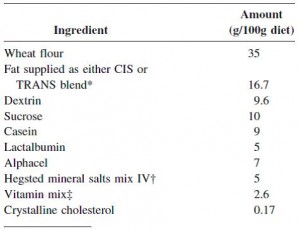
 

TRANS refers to trans fatty acids, and CIS is the opposite of trans.  Cis fatty acids are the form of most natural fatty acids.  People don’t usually call regular fatty acids “cis” because it is assumed; this is how most unsaturated fatty acids are found in nature.

To the data.


divide and conquer.
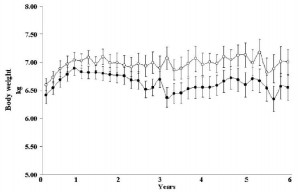
 

Body weight was roughly similar in CIS (closed circles) and TRANS (open circles) but started to diverge toward the end of the study.

The control group (CIS) weighed 6.41 kg at baseline and 6.55 kg at follow-up, an increase of less than 2%.  This was expected because at baseline, 70 kcal/kg per day was precisely enough food to keep them weight stable, so essentially nothing changed in these monkeys.  More specifically, since food intake and body weight didn’t change, we can say that there were probably no major perturbations in energy balance in this group.


TRANS, on the other hand, gained almost 3 times more weight despite eating exactly the same amount of food as the control group, which was exactly the same amount of food they were eating when they were weight stable at baseline.  Energy balance was clearly perturbed by trans fats.

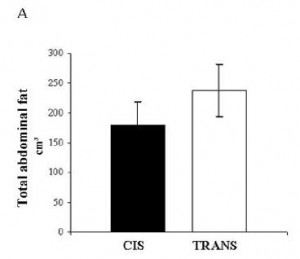
As seen below, the excess weight in the TRANS group was primarily in the form of increased visceral fat:
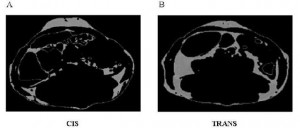
 

An abdominal CT scan.  The lighter areas represent fat tissue.  Both pictures depict roughly similar amounts of fat in the outer region (subcutaneous fat), whereas the TRANS group had significantly more fat tissue within the viscera.

For reference:
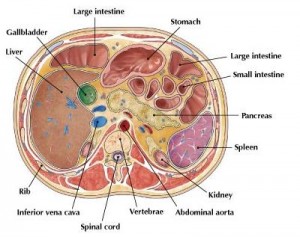
 

In all, TRANS had 27% more fat mass.  Fasting glucose and insulin levels were unchanged but postprandial insulin levels were markedly elevated in TRANS (see below), suggesting that dietary trans fats indeed caused insulin resistance.  I boldly use the term “caused” because this was a fairly well-controlled intervention study; the only thing different between the groups was the diet.
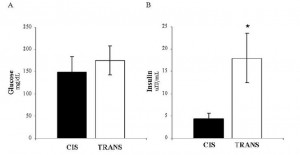
 

The TRANS group gained a significant amount of fat mass despite an absence of excess calories.  This was most likely caused by the trans fat-induced insulin resistance and subsequent postprandial hyperinsulinemia.

It would appear as though trans fatty acids defied the laws of energy balance.  The TRANS group gained fat mass despite an absence of excess calories.  Even the most practical explanation bodes poorly for trans fatty acids… it would appear as though trans fats were capable of inducing nutrient anti-partitioning independent of food intake.

I can see two ways to interpret these data.

  1. Trans fatty acids have an independent effect on energy balance.  That is, they specifically reduce energy expenditure, which would make the initial 70 kcal/kg*day excessive.  This would account for the excess fat mass, compared to controls, but not necessarily the increased body weight.  455 kilocalories (70kcal/kg*d) should be sufficient to support a specific amount of body weight; it is difficult to imagine a scenario whereby muscle mass declined enough to significantly reduce metabolic rate to the point where 455 kilocalories was so excessive that fat mass increased significantly more than the amount of muscle lost.  IOW, if this possibility were true, I would have expected, at most, a similar body weight but more fat and less muscle, not simply way more fat.

Of course, these processes would occur simultaneously and discreetly in vivo, but for simplicity’s sake I’ve broken it down.

6.6 kg monkey, x 70 kcal/kg*d = 462 kcal/d

Loses 0.022 kilograms of muscle, new body weight = 6.578 kg… since FFM is reduced, BMR should be reduced.  It was a 0.33% loss of body weight which was entirely from muscle (in this theoretical example), so perhaps BMR declines proportionately 460.46 kcal/d (? there are more accurate formulas in the literature, but this approximation is sufficient for our purpose)

all of those excess calories formerly burned in the lost muscle are now available for storage in fat.

462 – 460.46 = 1.54 excess kcal/day.  1.54 excess kcal every day for 6 years = 3,372.6  total excess kcal, which translates to ~0.438 kg fat mass.

0.438 kg new fat mass – 0.022 kg muscle lost = 0.416 kg overall weight gain.

6.6 kg + 0.416 = 7.016 kg.  Actual final body weight was 7 kg.  Pretty darn close.

Wow, can the loss of less than one ounce of muscle really cause such a drastic change in fatness?!? I don’t know for sure, but exchanging the microwave popcorn for a little resistance exercise seems prudent.

(in case you were wondering, no. I didn’t guess 22 grams. I did a ton calculations to quantify the metabolic rate reduction necessary to cause an energy surplus big enough to lay down enough fat mass to compensate for the reduction in muscle [which theoretically declined in proportion to the reduction in metabolic rate] and end up as close to 7 kg as possible… it could be calculated exactly but this has taken up 30 minutes already, and I think the point has been made)

2. Alternatively:  Energy expenditure varies day-to-day, hour-to-hour, second-to-second.  When we eat, we are transiently in positive energy balance, which reverses after a few hours, especially at night when a negative energy balance ensues and the fuel stored during the positive energy balance is utilized.  During those stints of positive energy balance, some of the excess energy is stored as fat tissue, while the rest is used to fuel the body.  Somehow, trans fatty acids shift the balance in favor of fat storage.

2a.  can there exist a positive energy balance selectively in adipose tissue?

2b. more likely, trans fatty acids reduce some component of energy expenditure, possibly basal metabolic rate, or perhaps the thermic effect of feeding.  Neither of these was measured, but I firmly believe energy balance was maintained.  It’s always maintained.

But the frightful conclusion remains the same: the TRANS group got fatter without eating more.  They didn’t eat more than they were supposed to but got fatter anyway.  Sad but true.

What about in humans?

Effect of trans-fatty acid intake on insulin sensitivity and intramuscular lipids-a randomized trial in overweight postmenopausal women. (Bendsen et al., 2011 Metabolism)

This study gave a group of 52 overweight but otherwise healthy postmenopausal women 16 grams of trans fatty acids in pumpkin muffins.  The control group received olive & palm oil-enriched pumpkin muffins.  In terms of the dosing, this study is almost directly comparable to Kavanaugh’s study.  However, this study only lasted 16 weeks (probably due to ethical reasons).  They also included a lean control group (for good measure?), baseline subject characteristics are below:
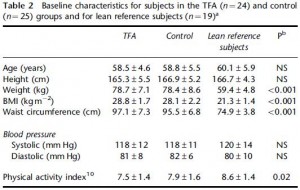
 

Nothing out of the ordinary.

And the investigators measured compliance empirically.  You are what you eat.  When a specific type of fat is consumed, its constituent fatty acids accumulate in body tissues like adipose and red blood cells.  So the researchers measured red blood cell trans fatty acid content.  Kudos!  (biomarkers are superior to almost any other measurement of compliance to a dietary intervention in humans)
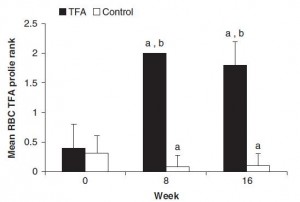
 

Indeed, the women ate their muffins.  But no effect on body weight!
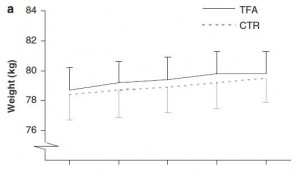
 

Body weight increased by about 2% in both groups.  If you want to get nit-picky, then we can make a few verrry long stretches concerning the body composition data:
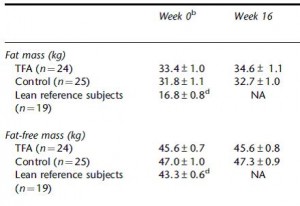
 

The increase in fat mass was 33% greater in TFA compared to controls!  (fat mass increased by 3% in the control group and 4% in TFA).  The increase in percent body fat was twice as big in TFA compared to controls!  (body fat percent increased by 1% in the control group and 2% in TFA).  IOW, the changes in body composition were nil.  This does not necessarily refute Kavanaugh’s African green monkeys because that study lasted 6 years; the insignificant changes in fat mass in Bendsen’s women over the course of 16 weeks could very well add up to significant changes after 6 years.  Actually, if the endpoint was indeed a 6% weight gain after 6 years (like the monkeys) (78.7 * 1.06 = 83.422 -78.7 = 4.722 / 6 years = 2.156 grams per day x 16 weeks = 241 grams) we might have expected these women to gain less than they actually did (~ 241 grams in 16 weeks compared to 1,200 grams).  In truth, however, these numbers are well beneath what can actually be measured accurately even in a laboratory setting.  So it is bona fide nit-picking.

Maybe it’s time to throw in the towel and confess that trans fats are significantly worse for African green monkeys than for overweight but otherwise healthy postmenopausal women.  There was no change in visceral adipose between the groups:
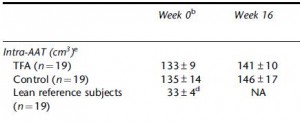
 

Potential confounding?  I’m really grasping at straws… but here it goes anyway:
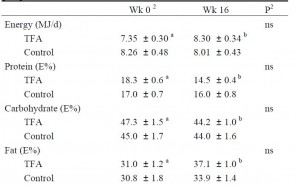
 

The TFA group reduced their carbohydrate consumption over the course of the study.  Carbohydrate consumption is directly correlated with liver fat accumulation.  But as per the trans fat study, trans fat consumption is inversely correlated with liver fat.  So we might expect trans fat-induced increase in liver fat to be cancelled out by the carb reduction-induced decrease in liver fat.  And this is exactly what happens!
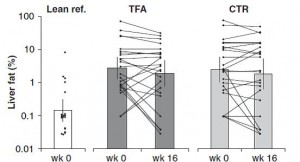
 

Furthermore, liver fat didn’t change in the control group because 1) their carbohydrate intake didn’t decline, and 2) they weren’t eating a ton of trans fats.  IOW, neither of the major dietary determinants were altered.

So, according to these colorful explanations, trans fats may have been just as harmful to Bendsen’s women as they were to Kavanaugh’s monkeys.  The reason why the results differ can be at least partially explained by the inferior dietary intervention utilized by Bendsen.  IOW, Kavanaugh’s dietary intervention was perfect; the subjects (monkeys) ate their prescribed diet exactly, no cheating, no sneaking in any snacks.  The diet changed markedly in Bendsen’s study; all women gained weight meaning that the test foods were probably not isocalorically substituted for foods in their normal diet.  Perhaps they just ate the foods in addition to their normal foods (unlikely considering the marked changes in macronutrient consumption).

Some more data from Bendsen’s overweight but otherwise healthy postmenopausal women were reported in another paper, and hints of trans fat-induced insulin resistance were revealed…

Here are the results from an oral glucose tolerance test:
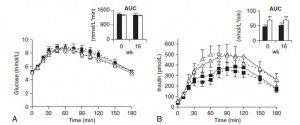
 

Glucose:  Just like Kavanaugh’s monkeys, there was no change in the glycemic response to a glucose load.

On the right, insulin levels.
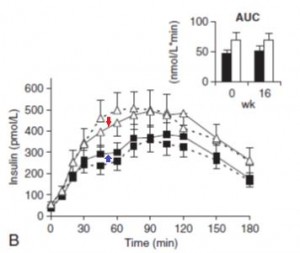
 

Insulin:  The open triangles are the control group, solid squares are the TFA group..  The dashed lines indicate insulin responses at baseline and the solid lines represent insulin responses at 16 weeks. In a randomized controlled intervention study, ALL changes in the intervention group must be compared not only to baseline measurements (pre-treatment), but more importantly they must be compared to the changes in the control group.  Over the 16 weeks, insulin response declined very slightly in the control group (see the little red arrow around the 45 minute mark).  However, insulin response increased slightly in the TFA group.  Take either of these changes individually and they would amount to nil.  But when you consider the change in control vs that in TFA, a modest trend appears.  The TFA group is beginning to show a hint of peripheral insulin resistance.  Maybe I’m seeing something where there is nothing, but the Kavanaugh’s study lasted 6 years and Bendsen’s study was only 16 weeks.  We must expect the changes to be ~20 times smaller in the Bendsen study.

OK, perhaps I got lost in the minutiae, or lost sight of the forest for the trees, but that doesn’t mean I’ll be eating microwave popcorn any time soon.  And on the bright side, creating this post was a great brain exercise

calories proper


attention nutrition researchers

how not to do a diet study.

As previously blogged about here, pair-feeding is an interesting phenomenon.

A high oxidised frying oil content diet is less adipogenic, but induces glucose intolerance in rodents. (Chao et al., 2007 British Journal of Nutrition)

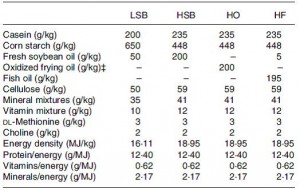
Basically, these researchers wanted to test the effects on body weight and glucose tolerance of soybean oil that was used for deep frying, like for French fries.  WRT diet and food intake, the study was well designed.  There were four diets:

Divide and conquer

The “L” stands for “low,” as in Low SoyBean oil diet; this was the low fat control group.  The “H” stands for “high,” as in High SoyBean oil, High Oxidised oil, and High Fish oil.  Apparently, High Oxidised oil is not as delicious in rat chow as it is in French fries, so the rats fed HO ate considerably less.  But if the rats on HO ate less food, they would gain less weight and might exhibit improved glucose sensitivity compared to the other groups simply because of calorie restriction.  This would be a problematic confounding factor

Enter: pair-feeding.   In pair-feeding, the amount of HO ingested is regularly measured and an equivalent amount of calories are disbursed to the other groups, so that all groups are eating the same amount of calories.  Essentially, this controls for food intake so the effects of the diet can be tested directly, e.g., without being confounded by food intake.

As seen below, the pair-feeding regimen was successful:

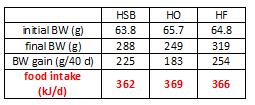
The row outlined in red shows food intake.  Note: it is very similar in all four groups; this was due to pair-feeding.


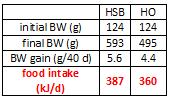
For the purpose of clarity, and since I’m not concerned with what was actually being tested, here is a simplified table.


In red, the HO group ingested 369 kJ/d, so the HSB and HF groups were fed approximately 369 kJ/d.  However, look at the markedly different amounts of weight gained.  HO gained significantly less weight than HSB and HF despite eating the same amount.  Similarly, HSB gained less weight than HF despite similar food intake.  don’t jump down my throat just yet, there was no attempt to quantify energy expenditure in any group, but that doesn’t take away from my point.  Taken at face value, these data suggest a diet high in oxidized soybean oil hinders fat gain (regardless of the mechanism).

The researchers figured that if all the groups were fed ad libitum (could eat as much as they pleased), HO would gain less fat because they ate less (as opposed to a specific effect of the dietary fat composition, which was the question they wanted to address).  This was their justification for pair-feeding.

Since HO gained less fat despite pair-feeding, their first point was proven.  Therefore, the researchers discarded the difficult and labor-intensive pair-feeding for experiment #2.  As seen below, rats fed HO ad lib do indeed ingest less than HSB.  AND they gain less weight.


So my question is: did pair-fed HSB rats gain more fat than HO because of an anti-fattening effect of HO, or because of the stress imposed by being pair-fed???  Normally, ad libitum feeding occurs all throughout the night (lots of small meals).  When an animal is pair-fed, they are given the food all at once and they gorge because: 1) they are being under-fed (given less than for what they are hungry); and 2) they don’t know when will be their next meal.

So back to my question: for what exactly does pair-feeding control?  in the first experiment, calories were the same, but HO were ingesting oxidized oils while HSB had a stressful feeding regimen… there are two variables.  The results from experiment #2 show nothing but what we’d expect, i.e., eat less = gain less fat.  My point is simple: pair-feeding might control for one problem but it introduces another.  If there are any nutrition researchers reading, please consider this.

Their experiments therefore specifically do NOT address the question they asked.  Maybe it was good enough for the British Journal of Nutrition, but it tells us nothing definitive about “the adipogenic effect of high oxidized frying oil.”

For ways around this, and to learn how to design a much better experiment, I am happy to consult for a small fee 🙂     for some more free background information, read on:

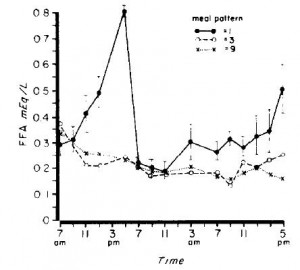
The effect of feeding frequency on diurnal plasma free fatty acids and glucose levels. (Bortz et al., 1969 Metabolism)

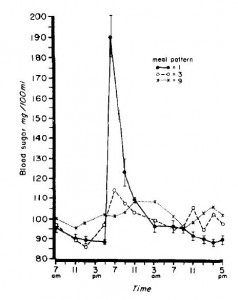
In this experiment, they fed young healthy men the following diet divided into one meal per day, 3 meals per day, or 9 meals per day.  Rodents feed all night long, so they would be most similar to the men being fed 9 times per day.  A pair-fed rodent, on the other hand, is fed only once and they eat everything in one sitting, just like the men in this study who were given all their calories at once.

The differences in blood glucose and free fatty acid responses to the meal were robust:


Hyoooge differences in serum glucose and free fatty acids.

So in addition to the stress-inducing nature of being pair-fed, there are also profound physiological differences in nutrient handling which most likely contribute to differential fuel partitioning.

For more examples of how a restricted feeding regimen can go terribly wrong, see here and here.

When you consider the possibility that the act of pair-feeding can have distinct metabolic effects, independent from whatever intervention is being administered, the results become increasingly difficult to decipher.

Effects of pair-feeding and growth hormone treatment on obese transgenic rats (Furuhata et al., 2002 European Journal of Endocrinology)

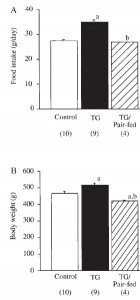
In brief, there were 3 groups: control, transgenic growth hormone-expressing mice (who eat considerably more than control mice, abbreviated “TG”), and transgenic growth hormone-expressing mice pair-fed with control.  As seen below, the pair-fed group ate (by design) and weighed just as much as control:


But when looking at the metabolic profiles of these mice, things get somewhat complicated:


Lets start out with the second row, FFA. OK, so TG mice eat more, weigh more, and have higher FFA than control (1.34 vs. 0.88 mM).  The elevated FFA could be caused by: 1) increased food intake; 2) increased body weight; or 3) the transgene.  To determine if it was caused by option #3, we look to the TG/pair-fed group.  If FFA are similar to TG, then it was caused by the transgene (option #3).  If FFA are similar to control then it was caused by options #1 or #2.  Alas, FFA in the TG/pair-fed group are similar to TG suggesting it is a specific of the transgene, independent of food intake body weight.

However, if we take a look at the first row, triglycerides, it is not so clear.  Again, we know that TG mice eat more, weigh more, and have higher triglycerides than control.  The elevated triglycerides could be caused by: 1) increased food intake; 2) increased body weight; or 3) the transgene.  To determine if it was caused by option #3, again we look to the TG/pair-fed group.  If triglycerides are similar to TG then it was caused by the transgene (option #3).  If triglycerides are similar to control, then it was caused by options #1 or #2.  But oh no!  Triglycerides in the TG/pair-fed group are significantly lower than TG and control!  This means we have to consider the fourth option: it was caused by pair-feeding.

The other two rows are easier to interpret, as insulin and leptin in the TG/pair-fed group exhibited an intermediate phenotype between control and TG, suggesting they were partially mediated by downstream effects of the transgene (i.e., increased food intake or body weight).  In the conclusion of the paper, the authors aptly explain the changes in insulin and leptin but cleverly avoid the triglycerides.  In their favor, the depressed triglycerides could have been an artefact, but the possibility that they were a product of the pair-feeding per se cannot be ruled out.  So depending on the question being addressed, pair-feeding has the potential to royally screw things up.


Calories proper


The Candy War

We interrupt your regularly scheduled program for this urgent message:  the National Health and Nutrition Examination Survey (NHANES) has issued a declaration of war.

Candy consumption was not associated with body weight measures, risk factors for cardiovascular disease, or metabolic syndrome in US adults: NHANES 1999-2004. (O’Neil et al., 2011 Nutrition Research)

en guard

OK, jk, the title of this manuscript is certainly eye-catching, but after a few days of brooding, plotting, and scheming, and some sleepless nights, I’ve come to the conclusion that while it may be “eye-catching,” it’s really not saying very much.

NHANES is a government run program that has been going on forever and is basically an enormous database of diet, health, disease, etc., risk factors, and is used to make nutrition or health recommendations.  There have probably been a million publications using data from NHANES.

This study included roughly 15,000 people over 18 years of age and had a follow-up period of 5 years.  They divided participants into 6 groups: people who ate candy and chocolate, those who ate only candy, those who ate only chocolate, and the people who did the opposite (e.g., those who didn’t eat only candy).

Sugar candy was defined as flavored/colored, crystalline/semisolid, sugar (e.g., peppermint, lollipops, licorice, gum drops, etc.).  Chocolate candy was defined as a mixture of cacao, cocoa butter, sugar and some extra’s (nuts, milk, fruit, caramel, etc.).

Reason #1 why this study isn’t saying very much:  we are not talking about a Halloween pillow case or Easter basket full of candy.  Not even close.  More like 4 Hershey Kisses, or 1 Reese’s Peanut Butter Cup (not even the whole package).  On average, everyone in the total population eats less than one serving per day which means that on most days no candy or chocolate is eaten at all.  This seems like a very low threshold for deeming someone to be a candy consumer, but it still includes about 10 – 20 % of their population.  Think of 10 people you know personally (friends, family, co-workers), how many of them have eaten candy in the past 48 hours?  If your answer includes more than 1 person, then these data don’t apply because the study population is not representative of the population from whence you hail.  phew!  Without going any further, I think this one point disqualifies the applicability of these results for about 95% of internet-accessing people.

If it looks like a duck, quacks like a duck, and you’re still not sure, send me the link.

Other anomalies in their data:

(divide and conquer)

Of course it’s perfectly plausible for one subgroup of people to eat significantly more yet weigh less than another subgroup selected from the same population, but how likely is that to occur in all 6 subgroups above?

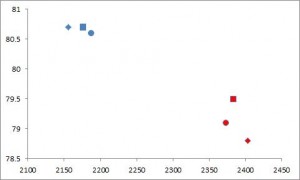
More simply, here is a graph of calorie intake vs. body weight:

Blue, nonconsumersRed, consumers; Diamond, total candy; Square, chocolate only; Circle, sugar only.

In each case, the blue symbols (nonconsumers) eat less but weigh more than the red symbols (consumers).    The only “normal” outcome, i.e., where those who eat more also weigh more, is comparing the red circle (people who eat both candy and chocolate) to the red square (people who eat chocolate but not candy).  I’m not saying these data are incorrect or were falsified, I’m just saying they are unique.  And when graphed this way, it is easy to see that consumers are eating over 150 more kilocalories per day than nonconsumers despite weighing ~2 pounds less.

Given the old (outdated) relationship between the amount of additional kilocalories required to gain one pound of fat mass, a difference of 150 kilocalories per should result in an additional pound of fat gained every 24 days… (which could theoretically be prevented by running an additional 1.5 miles every day) … yet those people are 2 pounds lighter

Furthermore, the candy consumers weigh significantly less and are more active, so their risk for a variety of metabolic disorders should be reduced, right?  Nope:

Candy: 0

Nutrition: 1

Will eating a piece of candy every day make you fat?  No.  Will stressing out about food or abandoning indulgences improve your health or quality of life?  Certainly not.  Do I feel all preachy now?  yes, a little.


Calories proper


fat blog, take I

Trans fats are everywhere.  Go to your cupboards, grab any packaged food products like crackers or cereal and you will probably find the words “partially hydrogenated” in the ingredients list.  So, what are trans fats? and how bad are they?

There are two types of fatty acids: saturated (no double bonds) and unsaturated (1 or more double bonds).  Fatty acids can be relatively straight molecules, except double bonds in the “cis” configuration put a “kink” in them.  “Cis” is the opposite of “trans;” saturated fats are neither cis nor trans because they don’t have any double bonds.  See below.

Trans fats are exactly like unsaturated fats except the kink is straightened out a bit, so now they have 1 or more double bond, like unsaturated fats, but are relatively straight, like saturated fats:

It’s kind of amazing that these molecules are so similar, yet you can eat 150 grams of saturated + cis-unsaturated fat every day and live a long healthy life, or eat 5 grams of trans fats, become obese and die prematurely.

Trans fats start out as liquid cis-unsaturated fats in vegetable oils (e.g., soybean oil, canola oil, etc.).  From a manufacturing standpoint, cis-unsaturated fats are too soft and unstable.  So to put them into foods would result in a messy product that melted at room temperature and then goes rancid.  That is not exactly what you think of when you picture a delicious warm muffin, or some crispy crackers, or an oreo cookie.  Converting cis-unsaturated fats into trans-unsaturated fats is what makes the difference.  Now your favorite processed food products have the perfect consistency, taste delicious, and don’t go stale.  From the perspective of the food company, people will buy more because it tastes better, and they don’t have to worry about it going bad if there is a slump in sales.  Win-win.

The melting point of the 18-carbon saturated fatty acid “stearic acid” is ~70F (mostly solid at room temperature; e.g., steak fat).   The melting point of the 18-carbon monounsaturated fatty acid “oleic acid” is ~56 F (mostly liquid at room temperature; e.g., olive oil).  The melting point of the 18-carbon monounsaturated trans-fatty acid “elaidic acid” is 113 F (almost always solid; e.g., Crisco is still solid after sitting out in the Southern California sun all day).   FTR, room temperature is 68 – 84F

Stearic acid is pretty much always solid.  It is found in steak.  Picture the white marbling in a thick cut of beef; it is solid.  Unlike oleic acid, which is found in olive oil.  Olive oil is usually a liquid, but will solidify if you put it in the fridge for a few hours.  Oils high in elaidic acid are almost as solid as stearic acid; elaidic and stearic acids can be solid at body temperature; this is highly favorable for food companies.  That is a key temperature that is important for the deliciousness of processed foods; they melt in your mouth not in your hands

Moving on to the data:  The first paper is another seminal manuscript from the infamous Nurses’ Health Study.  In brief, the Nurses’ Health Study began in the mid-70’s and has been steadily collecting data on over 100,000 women.  This particular analysis includes a sample size of ~80,000 (for the record, that is an enormous amount of people to study).

Dietary fat intake and the risk of coronary heart disease in women. (Hu et al., 1997 NEJM)

Nurses’ Health Study

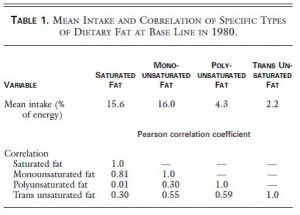
Table 1.  top half of the figure, “Mean intake.”   On average, in this population of ~80,000 women in the United States, 2.2% of total calories came from trans fat.  That’s about 5 grams on a 2,000 kcal diet.  Their average total fat intake was 37.1% , or 82 grams per day. Thus, trans fats comprise about 6 % of the total fat ingested.

bottom half of the figure “Correlation.”   Trans fat intake correlates better with PUFA & MUFA (0.55 & 0.59) than with SFA (0.30).  This is half expected and half surprising.  It’s half expected because, as stated above, trans fats are unsaturated fats, so by definition if you’re eating more trans fat then you’re eating more unsaturated fats.  It’s half surprising because you might think unhealthy people eat a lot of saturated fat and trans fat, so those two things should correlate well.  But they don’t.  It appears as though there are some people who eat vegetable oils and trans fats while others who eat saturated fats.  There is of course much overlap, but thats the gist of Table 1.

Table 2.  What are people eating?

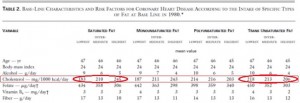
Table 2.  I love these kinds of tables; they look busy but really aren’t.  There are 4 super-columns: Saturated fat, monounsaturated fat, polyunsaturated fat, and trans unsaturated fat.  Each super-column is divided into three sub-columns: low, intermediate, and high intake levels.  For example, check out the 1st three columns in the 3rd row:  people with low saturated fat intake drink 9 grams of alcohol per day (~1 drink), people with high saturated fat intake drink less (5 grams or about a half a drink).

Now for the fun part:  cholesterol (in the red box).  Cholesterol and saturated fats are virtually always found in the same foods, so you can see that the people who ate the least saturated fat also ate the least cholesterol (red circle, 183 mg/1000kcal), and people who ate the most saturated fat also ate the most cholesterol (245 mg). Trans fats are primarily made out of vegetable oils, and there is no cholesterol in vegetable oils. People who ate the least trans fats also ate the most cholesterol (218 mg), and people who ate the most trans fat also ate the least cholesterol (206 mg).  These tables have the kind of stuff that becomes common sense but only after you think about it for a while.

Back to the half surprising point from above; maybe it should have been only 25% surprising. Healthy people try to avoid both saturated and trans fats, and healthy people who eat the least SFA or trans fat also eat the most fiber (last row in Table 2).  So all those things group together and can be seen in the table.  The advantage of this kind of table is that it independently breaks down each nutrient.  The disadvantage is that sometimes the common sense stuff doesn’t become common sense until you’ve thought about it for a long time, but I guess that’s true with a lot of things.

Moving on, to the bottom half of table 2:

similar trends…  People who eat the least saturated or trans fats also exercise the most, smoke the least, etc.  Where do you fit in?

Below is Table 3 in its entirety, but don’t worry we will not be considering very much of it.

Divide and conquer.

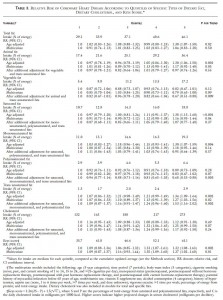
Of all the variables on that table, Trans fats carry the highest relative risk for CHD:  

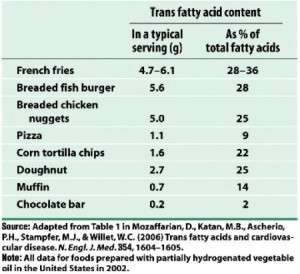
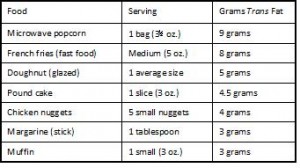
For the highest quintile of trans fat intake compared to the lowest, relative risk is 1.53, or people who consume 2.9% of total calories as trans fats (~8 grams) have a 53% greater chance of developing coronary heart disease than people who consume 1.3% of total calories as trans fats (~2.9 grams).  A difference of only 5 grams per day can increase your risk by half!  Where can you find 5 grams of trans fat ?  I thought you’d never ask:

Holy sh!t 9 grams of trans fat in a bag of microwave popcorn?!?  So microwave popcorn causes irreversible lung damage and heart disease too?

(Note the absence of real food on those two charts)

Back to the data:  Furthermore, the Nurses’ Health Study seems to exonerate saturated fats a little.  The age-adjusted risk for the highest saturated fat intake (18.8% of total calories or 41 grams) compared to the lowest (10.7% or 24 grams per day) is pretty high: 1.38 or 38% greater risk of CHD.  Well, back to that ‘common sense’ theme, unhealthy people eat a lot of saturated fat and trans fats.  Trans fat is the real bad guy, so when the data are controlled for trans fats, the risk of eating a lot of saturated fat completely went away (see red circle).

The relative risk is “1.07,” which would mean a 7% increased risk for CHD.  BUT:  The numbers in paranthesis after the relative risk are the confidence interval.  In brief, when the confidence interval includes “1.0” as it does here (1.0 is between 0.77 and 1.48), there is no longer a statistically significant association.

And the same thing happened to animal fat:

The adjusted risk for eating 36.4% (81 grams) compared to 17.4% (39 grams) of total calories from animal fat is “0.97” which would mean there is a 3% reduced risk for CHD if you ate more animal fats.  BUT the confidence interval includes “1” so there is no statistically significant association.

In the Nurses’ Health Study of ~80,000 women in the United States, CHD risk was not associated with intake of saturated fat, animal fat (or cholesterol), and was significantly associated with trans fat.  My take?  If you are at risk for CHD, avoid trans fats like the plague.  And microwave popcorn.

calories proper
the mortality blog

Influence of individual and combined health behaviors on total and cause-specific mortality in men and women: the United Kingdom health and lifestyle survey. (Kvaavik et al., 2010 Archives of Internal Medicine)

The United Kingdom Health and Lifestyle Survey looked at the relationship between mortality and the following four variables:

Smoking (never, former, current);

fruits and vegetables (> or < 3x per day);

physical activity (> or < 2 hours per week); and

alcohol consumption (> or <  2/d for women or 3/d for men)

Importantly, the analysis was designed to specifically address poor behaviors; it wasn’t how many vegetables you ate; it’s whether you eat more or less than 3 servings per day.  This simplifies things statistically, but it kind of excludes healthy people.  In other words, this study cannot tell you if 8 servings of veggies per day are better than 5 (a question that would be relevant to healthy people), it can only tell you if it’s bad to have less than 3 (a question that’s really only relevant to unhealthy people).  And this study says nothing about ‘what’s the worst thing for you;’ keep in mind that it only says how bad for you are those 4 pre-specified variables.

Data were collected in 1984 on ~5,000 people in the UK who were born before 1966 (they were at least 18 years old), and follow-up lasted until 2005.

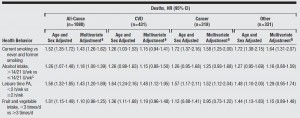
Pretty much, the whole story is summarized in Table 1.

??

Lies, damned lies, and statistics.

Divide and conquer.

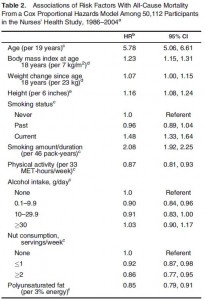
The hazard ratio is calculated as follows: take the first group, smoking, “never smokers.” Of the 1,591 people who never smoked, 214 died during the study.  The rate of death among never smokers is therefore: 214 / 1591 = 0.13.  Of the 2,124 people who were current smokers when the study began, 497 died.  The death rate for smokers is 497 / 2124 = 0.23.  The hazard ratio for smoking is 0.13 / 0.23 = 1.74; current smokers had 74% increased risk of dying compared to never smokers.  For former smokers, the risk was actually much worse; they had a 134% increased risk of dying.  NOTE: that is not because quitting smoking is bad for you.  Former smokers have already done a lot of damage to their health by smoking, and smokers who are very sick are very likely quit smoking but are also still very likely to die.  These are correlations not causations.   In any case, the reason why my numbers don’t match the table is because their data are “statistically adjusted.”

Going by their hazard ratios, of the 4 poor habits in question, being a current smoker is the worst (83% increased risk of dying compared to never smokers).  In terms of mortality risk, smoking is worse than regularly drinking in excess, getting less than 15 minutes of physical activity per week, and eating zero fruits or vegetables.  Nutrition is important, but not as important as not smoking.

The next worst factor was getting less than 15 minutes of physical activity per week. OK, so nutrition is important, just not as important as exercise and not smoking.  Actually, their nutrition variable had pretty much no significant correlation with all-cause mortality.

Moving on, Table 2. All cause and cause specific mortality

Again, the worst risk factor is current smoker, which was strongly associated with cancer mortality; getting < 2 hours of physical activity per week was strongly associated with CVD and all-cause mortality.

So if someone has all 4 poor behaviors, they should 1) stop smoking, 2) exercise just a little bit, 3) drink less alcohol, and 4) eat more fruits and vegetables.  If they only have 1 poor behavior it doesn’t really matter that much.

IMHO if someone asked what I considered a poor nutrition behavior, it wouldn’t be “too few fruits and vegetables.” People don’t get sick because of eating too few of anything, they get sick from eating too much.  I would have said a poor nutrition behavior is something like “> 3 servings of processed foods per day” or “too much damn sugar” because obesity and obesity-related disorders are the number one causes of death and those two behaviors do far more harm than fruit does good.  (too much processed foods and sugars can cause obesity; too little fruit cannot)

jump back over the pond to:  Risk Factors for Mortality in the Nurses’ Health Study: A Competing Risks Analysis (Baer et al., 2010 American Journal of Epidemiology)

The Nurses’ Health Study is one of the biggest epidemiological investigations of all time.  This study included young and middle aged nurses who completed multiple questionnaires about diet and lifestyle in 1980, 1984, and 1986.

The basic outline is similar to the UK study, and according to the table above, smoking triumphed again as the worst.  But wait, table 2 continued:

A Ha! diabetes is worse than smoking.

So perhaps eating more than 3 servings of vegetables per day isn’t as good as never smoking, but being diabetes-free is the best.  However, there is one important caveat.  This view of the data doesn’t exclude a relatively extreme interpretation.  I.e., eat as much junk food as you’d like and as long as you don’t develop diabetes, your lifespan won’t be affected.  A better interpretation needs to exclude that possibility because, unfortunately, people cannot eat as much junk food as they’d like and not get diabetes.

However, this study wasn’t about what led to the leading causes of death, it was about the leading causes of death.  It’s a bit cryptic, but I think it means 1) don’t smoke and 2) don’t do anything that causes diabetes…

glycemic load”  shows a pretty good correlation with all-cause mortality.  Glycemic load is basically how much your diet increases your blood sugar.

Glycemic load is increased by:

1)       eating a greater quantity carbohydrates; or

2)       eating higher glycemic index carbohydrates

We know a high glycemic load contributes to diabetes from an earlier publication on the Nurses’ Health Study

the 800 pound gorilla, no pun intended..  is it too much of a stretch to say your best chance of dying is:

“glycemic load –> diabetes –> mortality”

?

more thoughts about the data: Having a drink a day (~10% reduced risk vs. teatotallers) or getting a little bit of exercise (13% reduced risk) were good for you, but not good enough to compensate for smoking (>100% increased risk) or a carbohydrate-rich diet (22% increased risk due to glycemic load; >100% increased risk for diabetes).  I’m usually very nutritionally biased; for example, the cause of everything can be traced to nutrition.  In the UK study they didn’t ask about glycemic load or diabetes, but they said smoking carried the greatest risk for all-cause mortality.  In the Nurses’ Health Study, smoking was bad but diabetes was worse.  I imagine the findings about diabetes would have been similar in the UK study had they asked.  So my conclusion from these studies is that the universal order of things (or just how the majority of us will go) is most likely: “glycemic load –> diabetes –> mortality”

One more study, from the National Center for Health Statistics

The preventable causes of death in the United States: comparative risk assessment of dietary, lifestyle, and metabolic risk factors (Danaei et al., 2009 PLOS Medicine)

Briefly, these authors made a death-rank chart to display the 12 quantitatively biggest contributors to mortality in the United States.  Nutrition isn’t number one, but it did capture ~10 of the top 12.

calories proper
the poor, underestimated glucagon

it appears that the time for the indirect pathway for glycogen synthesis may finally be here.  Or perhaps it is insulin’s peripheral anti-gluconeogenic actions.

this topic deserves at least 1 lecture in a graduate level nutrition course: Glucagon receptor KO prevents type I diabetes in mice

Background information
When blood glucose is high after a meal, it is cleared by three tissues.
1)      Liver
2)      Muscle (insulin-dependent)
3)      Adipose (insulin-dependent)

Insulin stimulates glucose clearance but also suppresses glucagon.   b-cells surround the capillaries within pancreatic islets; blood flows through the b-cells first than through the a-cells.  So if glucose is high, it triggers insulin release from the b-cells, which then bathes the a-cells and inhibits glucagon.

Glucagon is a counter-regulatory hormone, i.e., it acts to increase blood glucose.  If you asked me before reading this paper, I would have said glucagon is important in fasting; necessary to maintain blood glucose at a level compatible with brain glucose uptake.  How?  By stimulating hepatic glucose production (glycogenolysis and gluconeogenesis).  That’s all.  After a carbohydrate containing meal, there’s less need for hepatic glucose production (HGP), so insulin inhibits glucagon.  After a high protein meal, maybe you still get a little bit of glucagon to help with excess amino acids.  End of story.

Divide and conquer.

There were four important groups of mice:

1)      Wild-type (normal, “WT”)
2)      Type I diabetic (no insulin, “STZ”)
3)      Glucagon receptor KO (no glucagon activity, “Gcgr-/-”)
4)      STZ Gcgr-/- (no insulin or glucagon activity)

STZ (streptozotocin):        b-cell toxin, mimics type I diabetes (no insulin), Ketoacidosis, weight loss despite hyperphagia (2-fold increase in food intake!), Decreased fat mass (due to lack of insulin)

Gcgr-/-:  Decreased blood glucose levels as expected, Improved glucose tolerance (somewhat expected), Ultra-high glucagon levels but confirmed no glucagon activity

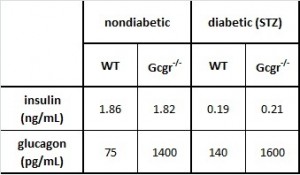
Table 1.  The basics.

  • Insulin levels are practically nil in all STZ-treated mice
  • As expected, glucagon is increased in STZ-treated mice, because insulin usually suppresses glucagon
  • Glucagon levels are astronomical in Gcgr-/-

we know from previous studies that Gcgr-/- have lower fasting glucose & better glucose tolerance (Gelling et al., 2003 PNAS)

Back to the data.  Rodent adipose tissue physiology 101:

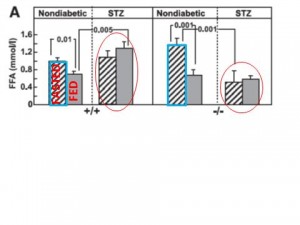
Fasting & Fed Free Fatty Acids

1st panel: normal WT mice.  Feeding increases insulin which suppresses lipolysis, thus FFA levels go down.

2nd panel: STZ (type I diabetic).  No insulin, so no change in FFA levels after feeding.

3rd panel: Gcgr-/-.
1) Higher fasting FFA compared to WT mice? (compare the two blue outlined boxes);  2)  Feeding increases insulin which suppresses lipolysis, thus FFAs drop; 3) Greater relative suppression of FFA (due to higher basal FFA) suggesting increased adipose tissue insulin sensitivity?

4th panel: STZ Gcgr-/-
1) Reduced fasting FFA compared to WT STZ, suggests a lipolytic role for glucagon, but why is this restricted to STZ mice?  2) No effect of feeding on FFAs because no insulin (just like in WT mice)

A lipolytic role for glucagon is confirmed by comparing the bars circled in red.

Compare the fasted to fed columns in each panel: all four panels are in accord with what we know about the anti-lipolytic effects of insulin.

Not sure why fasting FFAs are lower in STZ Gcgr-/- compared to nondiabetic Gcgr-/-.  Any ideas?

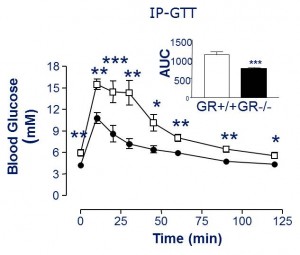
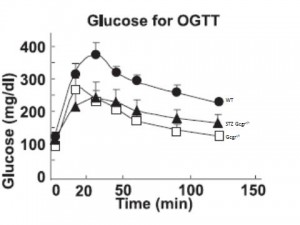
Oral glucose tolerance is improved in Gcgr-/- (compare WT [closed circles] to Gcgr-/- [open squares]), and insulin response is identical (not shown).

Glucose tolerance is improved in STZ Gcgr-/- mice.  (compare STZ Gcgr-/- [closed triangles] to Gcgr-/-[open squares]).  But STZ mice have no insulin!

This suggests that glucagon causes postprandial hyperglycemia and the primary role for insulin is to suppress glucagon (as opposed to facilitate glucose uptake in muscle, for example).  In other words, without glucagon driving up hepatic glucose production (HGP), there won’t be high postprandial glucose, and therefore it doesn’t matter if insulin is present.

Where does the dietary glucose go?  Probably not so much into muscle because there’s no insulin (there is still controversy, but there is evidence that insulin signaling in muscle is important for glucose tolerance; see MIRKO mice , although this isn’t entirely clear).

Liver glycogen?    glucagon actively inhibits hepatic glucose uptake and stimulates HGP (?)

So, to recap:  1) In the absence of glucagon, oral glucose tolerance is normal because there is no great stimulus for HGP; insulin is dispensable.     2) Point #1 is supported because without insulin, oral glucose tolerance is normal as long as there is no great push on HGP (i.e., STZ Gcgr-/-).     3) If glucagon is present, then insulin decreases glycemia by inhibiting glucagon which reduces HGP.  If glucagon is absent, then insulin is not necessary because the liver takes up more of the dietary glucose.  Clear as an unmuddied lake.

STZ Gcgr-/- Probably lower gluconeogenesis compared to STZ wild-type because: lower ketones compared to STZ wild-type, and lower fasting glucose compared to STZ wild-type.  Lower fasting FFAs compared to STZ wild-type, confirming lipolytic effect of glucagon.

Gcgr-/- Elevated fasting FFAs compared to WT, suggesting lipolytic effect of glucagon is restricted to STZ-treated mice.  Reason unknown, any ideas?

OK, like John Dewey now, in the normal situation: dietary glucose is absorbed but glucagon inhibits it from entering the liver at first, so the dietary glucose adds to the glucose produced via gluconeogenesis/ glycogenolysis causing a high peak in blood glucose.  Insulin inhibits glucagon lowering HGP and blood glucose comes down  (role for insulin signaling in muscle?).    Without glucagon: dietary glucose absorbed and is mainly incorporated into liver glycogen; some gets by but HGP is lower, so the total glucose peak is blunted.  Insulin is unimportant in this model, which is why glucose tolerance is the same in Gcgr-/- and STZ Gcgr-/- mice.

So insulin makes you fat and glucagon makes you hyperglycemic (blind, renal failure, neuropathy).   ‘damned endocrine pancreas.

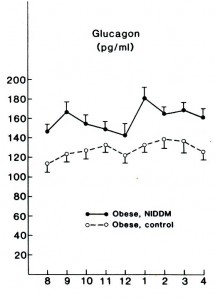
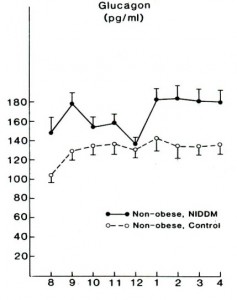
Flashback 1987 – Glucagon levels elevated in lean and obese type II diabetics; maybe this is why they are hyperglycemic?  Less to do with skeletal muscle insulin resistance, more to do with glucagon & HGP?     Reaven et al., 1987 Journal of Clinical Endocrinology and Metabolism

Flashforward 1999 – The almost exact same study was done 10 years ago in humans  (Shah et al., 1999 AJP)  “Impact of lack of suppression of glucagon on glucose tolerance in humans.”  The authors insisted on using the double negative, which is annoying, so instead of saying “lack of suppression of glucagon,” I refer to this condition as “high glucagon.”

Divide and conquer.

No time for background:  10 healthy patients.  Endogenous insulin and glucagon were inhibited by infusion of somatostatin.  At time zero, glucose infusion begins at a rate designed to mimic a 50 gram oral bolus.  Then they infused either a high dose of insulin to mimic the “nondiabetic” response, or a low dose of insulin to mimic the “diabetic” response.  In each of these conditions, glucagon was either co-infused the entire time (“high glucagon”) or delayed for 2 hours (“suppressed glucagon”).

So the 4 groups were: High insulin & low glucagon, High insulin & high glucagon, Low insulin & low glucagon, and Low insulin & high glucagon (diabetic).

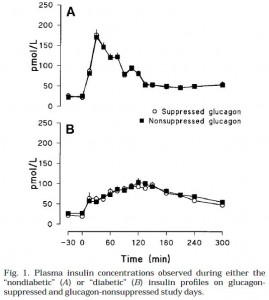
Insulin infusions looked like this (Fig 1):

Top graph is nondiabetic, note the high insulin peak.  Bottom graph is diabetic.

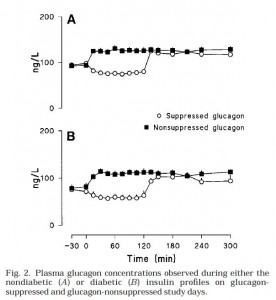
Glucagon infusions were pretty much identical for nondiabetic & diabetic conditions (Fig 2):

Top graph is nondiabetic, bottom graph is diabetic.  NOTE: Figures 1 and 2 simply reflect the experimentally produced conditions (that is, the infusions), they are not a physiological effect.  Secretion of endogenous insulin and glucagon was inhibited by somatostatin so the only insulin and glucagon in the blood is what the researchers put there.

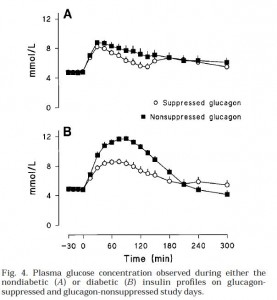
Then they gave ‘em glucose (Fig 4).  Please just focus on the top graph first.  Here’s what the glucose levels looked like in nondiabetic conditions.  In other words, high insulin [similar to nondiabetic WT (open circles) & Gcgr-/- (closed squares) above]:

Both Gcgr-/- mice and humans with suppressed glucagon have normal or improved glucose tolerance when insulin is present in nondiabetic doses (top graph).  Now look at the bottom graph; it is what happens in diabetic conditions (just like STZ-treated Gcgr-/- [open circles]; STZ-treated WT mice [closed squares])

We don’t have the data for STZ-treated WT mice, but most assuredly there is higher glucose levels, similar to what is seen in Fig 4B (low insulin, high glucagon [closed squares]).  So glucagon is not bad if insulin is there to defend you (Fig 4A).  Without adequate insulin (Fig 4B), high glucagon causes hyperglycemia.

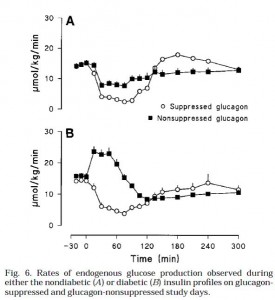
This was shown to be primarily due to differences hepatic glucose production (Fig 6):

This is an important graph.   Top graph (Fig 6A): (nondiabetic) high insulin suppresses HGP.

Bottom graph (Fib 6B): (diabetic) insulin is not necessary to repress HGP when glucagon is low (open circles).  But if glucagon levels are high and there is low insulin, HGP is high, causing the hyperglycemia seen in Fig 4B.  Interestingly, with low glucagon (open circles), HGP is suppressed to a similar level by high (top graph) or low (bottom graph) insulin (~5umol/kg/min).  High glucagon is sufficient to cause hyperglycemia.  Is it essential?  So high glucagon is why type II diabetics have postprandial hyperglycemia?  (this seems to downplay the role of skeletal muscle insulin resistance [?])

Furthermore, high glucagon (closed squares) impaired insulin’s ability to suppress HGP (compare, in both the top and bottom graphs; HGP is higher with the closed squares (high glucagon) than with the open circles (low glucagon).  This means that insulin inhibits HGP by inhibiting glucagon; it takes really high insulin to counter the effects of high glucagon (with high glucagon [closed squares] HGP could only be suppressed by high insulin [Fig 6A closed squares are suppressed; Fig 6B closed squares are not suppressed) …. Suppressing glucagon in the diabetic insulin milieu (open circles, bottom graph) was sufficient to restore glycemia down to the same levels as nondiabetics (Figure 4 [open circles], glucose peaks at 8mM in both conditions)… so is that why insulin inhibits glucagon?  Or is it how insulin suppresses HGP?  Does it matter?

I think it might, there may be fundamentally important difference.   If it’s how insulin inhibits HGP, then that excludes the possibility that insulin reduces HGP by decreasing amino acid and glycerol release from muscle and adipose, respectively.  It means that insulin acts on the liver, not peripheral tissues, to repress HGP (assuming that in humans, the liver is the major physiological target of glucagon).

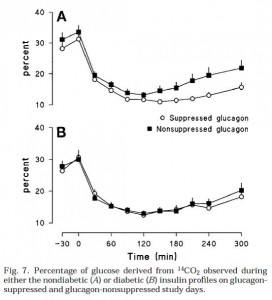
But alas! It looks like we won’t be needing to grapple with such questions today.  The researchers found that gluconeogenesis was nearly equally suppressed in all conditions suggesting that the major contributor to glucagon-induced glycemia was glycogenolysis (in this model).

The poor, underestimated glucagon

Calories, proper

the mice got fatter without a positive energy balance

the mice got fatter without a positive energy balance.

There was  a lot of good feedback from the post about 5% calorie restriction, but it has left people wondering,  how could this happen?

Truthfully, I have no clue. But since First Amendment Rights apply in the blogosphere, I am free to speculate.  However, for anyone with proper training in nutrition and or energy balance, this may seem like shouting fire in a crowded auditorium, so please forgo this post.

Divide and conquer.

Energy balance MUST AND WILL BE MAINTAINED.

For starters, lean mass (muscle) was lost, which might be indirectly caused by the reduction in food intake.  Muscle is the major contributor to energy expenditure.  If food intake declines, and muscle is lost in order to reduce energy expenditure, energy balance could be in fact maintained.  The only strange part of that conclusion is that it states that muscle was lost in order to reduce energy expenditure.  Why would muscle do this?  Perhaps it is due to a novel variation of the “use it or lose it” principle.  “Use it or lose it” refers to the decline in skeletal muscle that occurs during extended periods of disuse (think of someone’s arm after it spent 2 months in a cast).

When calorie intake is reduced, leptin levels decline rapidly signaling “starvation” mode to the brain.  This causes a large reduction in energy expenditure in order to preserve energy stores.  Previously, the decline in energy expenditure would have been predicted to occur by decreased physical activity.  And reduced physical activity could cause muscle loss due to the “use it or lose it” principle.  BUT physical activity was unchanged.  Therefore, it is possible that the decline in metabolic rate was manifested by processes other than physical activity in muscle tissue.  This means that “use it or lose it” could apply to functions (“using it”) that occur while we are resting.  Clearly, this is a marked deviation from the energy balance dogma.  And it has kept me up at nights.

What processes could these be?  None were measured or even suggested by the authors of the study, but I suppose some possibilities could be reduced activity of sodium potassium ion channels or possibly reduced futile cycling.  This is interesting, indeed.  More research is severely warranted.

So muscle was lost in order to balance the reduced food intake.  OK, so where did the energy come from to build fat mass?  This may have already been explained… if metabolic rate was reduced down to match food intake, energy balance would be maintained.  If metabolic rate was reduced even further, it would produce a relative energy surplus.  Perhaps this is precisely what occurred.  Thus, muscle was lost in order to balance the reduced food intake, and metabolic rate declined in order to create a relative positive energy balance selectively to the fat tissue.  Why would something like this occur?  It is very strange, to be sure, but may have had something to do with the stress of the feeding regimen. The body thinks it is starving, so preserving fat mass becomes a priority.  Maybe the systems that work to preserve fat mass during starvation are the same as those that build fat mass during energy surplus.

For now, trying to explain these findings without defying the laws of energy balance caused gray hairs to appear in my beard.   I’ll try to figure out the why later.

The mice got fatter without a positive energy balance.  Can this happen to us?  Does it matter?  These results suggest that fat tissue has a propensity to grow regardless of energy balance.  In the abovementioned study, the trigger may have been the hormonal response to a stressful feeding regimen.  Type I diabetics are usually very thin but develop fat deposits in their insulin injection sites; thus, in type I diabetics, the trigger is insulin.  In both situations, fat mass grew because of the hormonal milieu, not an energy surplus.

calories, proper

USDA Guidelines

Extra, extra, read all about it

USDA press release – “New dietary guidelines to help Americans make healthier food choices and confront obesity epidemic”

the new message? “eat less and move more.”  Sound familiar?

But is this really the best message?  I mean, they didn’t have to do any research or studies or anything, because, well, it’s obvious.

This paper is a nice example of how it might not be so obvious.
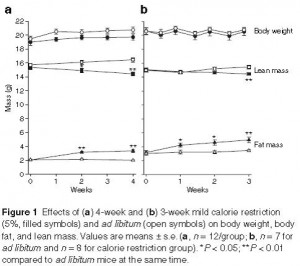
These researchers took two groups of mice, fed one group “ad libitum” (AL), meaning, the mice ate as much as they wanted, and fed the other group 5% less (calorie-restricted, CR).  For the record, 5% is not very much; it’s about 100 fewer calories for you or me.  And apparently, it’s not enough to cause weight loss:
the experiment was performed twice, and the results are in panels a & b above.  The top lines represent body weight and you can see that there is virtually no difference between the groups.  Look a little further down, however, and you will see that the calorie-restricted group actually lost lean mass (skeletal muscle).  Aargh.  If that isn’t bad enough, mathematically it doesn’t exactly work out unless the mass of something else increased to balance it.  Look further down on the figure, their fat mass actually increased.  Sounds like the worst diet ever.  They didn’t get fatter, they got fattier.

1. Why did they lose muscle?

2. How did they gain fat while being underfed?

What is going here ?

To a large degree, muscle mass determines energy expenditure, which in turn is roughly equivalent to your food intake.  So there is a good relationship between the amount of muscle you have and the amount of food you eat.  As seen above, the opposite appears true also.  By reducing food intake, muscle mass declined, apparently to match the new (lower) food intake level.   So, for now, we can blame the muscle loss on the calorie deficit.

What about the fat gain?  Fat gain is very unlikely if you are in a hypocaloric state… so maybe the mice weren’t technically hypocaloric.  They researchers measured resting energy expenditure (REE) and found that their metabolism was significantly lower.

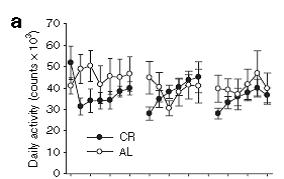
In other words, the 5% calorie restriction would have been hypocaloric for “ad libitum” fed mice, but once on the diet, their metabolic rate slowed down so much that 5% fewer calories was no longer hypocaloric.  What caused this reduction in metabolic rate?  The researchers then measured physical activity and found the mice certainly weren’t less active, and were actually more active at some time points.

Since they weren’t less active, the reduced energy expenditure must have been in the form of a lower metabolic rate.  In other words, they didn’t get tired or lazy, their body’s intrinsic metabolic rate simply declined.  This was likely related to the loss of muscle mass, but admittedly, these data are a bit cryptic.

To summarize: 5% calorie restriction -> muscle loss -> lower energy expenditure -> reduced metabolic rate -> increased fat mass ?     Well yes, all of those things occurred, but whether or not they necessarily occurred in that sequence is less clear.

Major fundamental finding: the mice ate less, moved more, and got fattier.

Eating less and moving more is not the answer.

calories, proper