Category Archives: Leptin

Obesity is not permanent

Take a group of obese people (> 250 lbs) and put them on a massive calorie restricted diet.  They lose weight and metabolic rate plummets.  Weight loss fail?  In most cases, yes.  But a recent study showed that the decrepit post-weight loss metabolic rate gradually improves in parallel with an increase in dietary fat ingestion to such a degree that even after two long years: totally food intake was almost back to normal, energy expenditure improved, and all this happened despite continual weight loss.  In other words, obesity is not permanent. 

creme brulee

Decreased energy density and changes in food selection following Roux-en-Y gastric bypass (Laurenius et al., 2013)

Statistically speaking, no diet on Earth comes close to RYGB in terms of weight loss success.  Long term.  Seemingly permanent.  It’s the closest thing to a cure we’ve got.

Laurenius

Body weight is down by 30%, and energy expenditure is rising faster than a speeding bullet.  because food intake is increasing while body weight is dropping – they’re probably more active too ** weight loss than more exercise –

But there’s a more mystical aspect to RYGB that warrants attention.  (it could be the increasing fat intake, but for now let’s just say it’s RYGB per se).  According to this pearl, weight loss of only 10% via diet alone causes energy expenditure crash by 394-500 kcal/d, and physiological replacement of leptin via subcutaneous injection can increase this by 234-454 kcal/d (Rosenbaum, Murphy, Heymsfield, Matthews, and Leibel, 2002).

Continue reading

Don’t eat doughnuts for breakfast, Op. 85

or
Weight-loss maintenance, part 1

“Weight-loss maintenance” is a critical part in the battle against obesity because losing weight is much easier and significantly more successful than keeping it off.  The difference lies predominantly in duration: a few months of dieting to lose weight vs. keeping it off for the rest of your life.  Two diet studies on the topic were recently published, and while neither study really addressed the issue proper, some interesting points can be gleaned from both.

Study #1

Meal timing and composition influence ghrelin levels, appetite scores and weight loss maintenance in overweight and obese adults (Jakubowicz et al., 2012)

16 weeks of weight loss followed by 16 weeks of “weight-loss maintenance.”

In brief, the weight loss was accomplished by one of two hypocaloric (1400 kcal/d) isocaloric pseudo-Dukan Diets (higher protein & lower fat than Atkins)

The catch:  Breakfast for the people in HCPb (High Carbohydrate and Protein breakfast)  had twice the calories, 6x the carbs, and half more protein than LCb (Low Carb breakfast).  This was compensated, calorically, by a much smaller dinner.  In other words, they ate like a King for breakfast, a Prince for lunch, and a Pauper for dinner… with the added bonus of a “sweet food… chocolate, cookies, cake, ice cream, chocolate mousse or donuts.”  For breakfast.

People in both groups lost roughly similar amounts of weight in the weight loss phase:

During the first 16 weeks (weight loss phase), a strict 1400 kcal diet was implemented.  During the second 16 weeks (“weight-loss maintenance” phase), macronutrient composition was supposed to be kept similar, but subjects were “free to eat as motivated by hunger or cravings.”  Critique #1a: this study would’ve greatly benefitted by food intake questionnaires to know more accurately what these people were eating; the importance of this becomes more apparent soon.

At three times throughout the study (baseline, week 16, and week 32), a “Breakfast meal challenge” was administered to assess Hunger, Hatiety, and Food Cravings.  Unfortunately, however, the “Breakfast meal challenge” was administered… after… breakfast.  HCPb binged on a high calorie 3-course meal which included dessert while LCb nibbled on a lite breakfast… And the researchers needed a 100-millimeter Visual Analog Scale and 28-item Food Craving Inventory Questionnaire to figure out who would be hungrier afterwords?  Really?

Divide and conquer

Table 2.  There were no major differences between the groups, and between those who completed or didn’t complete the study except for weight loss in those who withdrew.  Apparently, people who didn’t lose any weight on the hypocaloric weight loss diet decided to quit (was it the diet or the dieter that didn’t work? [sorry, no offense]).  In any case, this would’ve introduced a systematic bias except the non-weight-losers were similar in both diet groups.  But Hunger & Satiety was also similar between completers and dropouts… I wonder why…  i.e., the diet was working for those who were losing weight, because Hunger was low and Satiety high; in the dropouts who didn’t lose weight, Hunger was low and Satiety high because they were eating more (which is why they didn’t lose weight).  IOW: “not hungry -> eat less -> lose weight -> complete the study” vs. “eat more -> not hungry -> don’t lose weight -> dropout of the study.”  People are “not hungry” in both groups, but for different reasons.

Critique 1b: this is another place where a food intake questionnaires would come in handy.

During the weight loss phase, LCb lost a little bit more weight and became a little bit more insulin sensitive than HCPb, which is interesting only because the macronutrients were so similar.  Thus, it may have been an effect of “meal-size-timing.”  In other words, don’t eat like a King for breakfast, a Prince for lunch, and a Pauper for dinner.

Ghrelin, a hunger hormone, was significantly higher in LCb and this actually correlated very well with measured Hunger levels (unlike leptin, the far more popular anti-hunger hormone, discussed in depth HERE).  And insulin, a theorized yet controversial hunger hormone, did not: insulin was lower at week 16 while Hunger was 2x higher; and insulin was 2x higher at week 32 compared to week 16 while Hunger was the same at those time points (Table 3).  Thus, for those interested (which is admittedly probably only me), neither leptin nor insulin correlate with Hunger levels; but this study showed that ghrelin does.  Furthermore, similar to those leptin data mentioned above, Hunger was not correlated with weight loss (which is kind-of-fascinating).

The second half of the study (“weight-loss maintenance”) was complete bollocks and made no sense whatsoever (you’ll see it on the evening news).  What you can conclude from this study, however: people following the moderately higher protein and lower carb pseudo-Dukan Diet (LCb) lost modestly more weight during the first 16 weeks than those following the more traditional higher carb version (HCPb).  BOTH diets were “high protein” and “low carb,” and people in BOTH groups lost a lot of weight (~30 pounds in 4 months).  The media hasn’t had their way this study [yet], but when they do, I’m sure the they’ll disagree.

Don’t eat doughnuts for breakfast, you heard it here first.


calories proper

The curious perils of crappy sleep

Don’t try this at home

Adverse metabolic consequences in humans of prolonged sleep restriction combined with circadian disruption (Buxton et al., 2012)

The most utterly abnormal sleep structure was studied- for 3 weeks, the subjects were subjected to: 1) a 28-hour day; 2) 6.5 hours of sleep per night (equivalent to 5.6 hours in a normal 24-hour day); and 3) dim lighting during the days.  This was done to completely destroy circadian rhythms, and accordingly, metabolic calamity ensued: insulin response went down and hyperglycemia went up (compare black to red bars). 

B, baseline; SRCD, sleep-restricted circadian-disrupted; R, recovery period

Other notable findings:

1) sleep-restricted subjects ate 6% more

2) their metabolic rate declined 8%

3) body temperature went down 0.09 degrees

All of these things point to one common endpoint: weight gain.  Indeed, the authors even concluded that sleep restriction and disrupted circadian rhythms should increase the risk of obesity… except for one thing: everyone in the study lost weight (1.7% of initial body weight).


…suspense…


How, you ask?  during the increased waking hours, physical activity actually went up (a LOT).  This may have been because the researchers didn’t recruit an average lot, or group of subjects who were generally representative of the population at large.  No, this was a highly selective group of “healthy people.”  And what do healthy people do when their awake?  It’s probably what they don’t do that matters.  Healthy people spend less time sitting around (in general).  Had the researchers recruited a group of overweight subjects with their X-Boxes, I imagine the increased food intake would not have been adequately balanced by increased physical activity and they would’ve gained weight.

like this guy

I do NOT recommend sleep restriction for weight loss.  Even though glucose metabolism was completely restored after 10 days of recovery (gray bars in the figure above), lingering signs of metabolic dysregulation were still apparent (scary).

RMR and leptin

Perhaps not necessarily video game junkies, but those who are otherwise at increased risk of developing obesity do tend to move around less during the day if they sleep less at night (in contrast to the very healthy people mentioned above).

Reduced physical activity in adults at risk for type 2 diabetes who curtail their sleep (Booth et al., 2012)

This is not a “very healthy” group of subjects; accordingly, those who slept <6 a night were 27% less physically active and spent over an hour more per day sitting around.  In this study, short sleepers weren’t obese [yet]; but they were predisposed to weight gain.  (even the media seems to agree with this one).

If you DID want to try sleep restriction for weight loss, and even vowed to decrease food intake (in contrast to the highly active subjects in Buxton’s study), the results still might not turn out so good…

Effects of sleep restriction on glucose control and insulin secretion during diet-induced weight loss (Nedeltcheva et al., 2012)

In this study, food intake was intentionally reduced to a similar extent (-10%) in sleep restrictors and non-restrictors, and in agreement with Buxton, metabolic rate declined in sleep restrictors.  And although it was only measured at baseline, physical activity during sleep restriction must have increased because weight loss was similar in both groups.  But here’s the catch:  compared with those who slept 8.5 hours per night, the weight lost by those who slept 5.5 hours per night was primarily fat free mass (which is probably what caused their metabolic rate to go down), whereas it was primarily fat mass in those who got adequate sleep.  This finding alone is reason enough to get a good night’s sleep.

In sum:

Exhibit A, Buxton study: sleep-restricted HEALTHY people ate more but moved around WAY more during sleep restriction = weight loss.

Exhibit B, Booth study: those pre-disposed to obesity moved around LESS during sleep restriction = imminent weight gain.

Exhibit C, Nedeltcheva study: the weight lost by sleep restricted overweight dieters was comprised of muscle mass = not good.

In other words, if you think you’re a healthy person who wouldn’t sit around playing video games in your extra waking hours, or even if you promised not to eat more, the effects of sleep restriction on body composition wouldn’t be pretty (no pun intended).  Maybe you wouldn’t get fatter, but you’d probably get fattier.


calories proper


Paleo schmaleo, Op. 69

Brief refresher:

Paleo: lean meat, fish, fruits, vegetables, potatoes, eggs, and nuts; NO grains or dairy

Paleo carbs: fruits, veggies, nuts, and beans… NO starches, cereals, whole grains, added sugars, etc.

Paleo is GFCF-friendly

Atkins is similar to Paleo but allows fewer carbs

Mediterranean diet (from last week): whole grains, low-fat dairy, vegetables, fruits, fish, oils, and margarines (the Paleo diet improved insulin sensitivity WAY more than the Mediterranean diet in patients with CHD).

Diabetic diet (this week; see below): vegetables, root vegetables, dietary fibre, whole-grain bread and other whole-grain cereal products, fruits and berries, and decreased intake of total fat with more unsaturated fat.

Paleo vs. the “diabetic diet” in type II diabetics (Jonsson et al., 2009 Cardiovascular Diabetology).  Lindeberg designed this particular Paleo diet with a much lower carb content (32% vs. 40%) than in the previous study with CHD patients.  A cynic, who might think that some of Paleo’s benefits are due to its low carb content, might think that since traditional Paleo and the comparison “diabetic diet” have a similar carb content (42% and 40%, respectively), Lindeberg intentionally modified Paleo for this study to make sure carbs were significantly lower than in the “diabetic diet” (stacking the deck in Paleo’s favor, according to the cynic).  I can’t find any reason to disagree with the cynic, but it didn’t work out so well for Lindeberg et al.

As detailed in a series of posts about crossover studies (part I and part II), this one was botched due to: 1) what appears to be improper randomization (baseline glucose values were 7.1 and 8.6 mM); and 2) a washout period that was too short to allow one of the primary endpoint variables (HbA1C) to return to baseline.  As such, data presentation was convoluted, which said cynic might think was intentional.  But if we take it at face value, Paleo still fails.  For example, according to this figure (which is NOT crossover data), although Paleo has a lower final HbA1C, the HbA1C reduction is much greater on the diabetic diet.Paleo: 0

Diabetic diet: 1

AND weight loss was similar despite Paleo dieters consuming significantly less food (1581 vs. 1878 kcal/d):So yes, in accord with the Jonsson study (above), Paleo may have been more satiating (i.e., spontaneously lower food intake), but no, this didn’t translate to greater weight loss.  Someone needs to measure energy expenditure in Paleo dieters because it looks like this pattern of food intake either lowers basal metabolic rate or simply makes people tired (though this conclusion would be vehemently denied by Paleo loyalists).  The reduced leptin levels (Jonsson study) may have caused lower energy expenditure, but this would not entirely align with my lower-leptin-equals-higher-leptin-sensitivity hypothesis and thus cannot POSSIBLY be true :/   Alternatively, perhaps the Paleo diet really does lower energy expenditure; this would’ve been irrelevant and possibly even beneficial in Paleolithic times because: 1) they would’ve conserved more energy for “hunting” (hunter-gathers) or fleeing; and 2) weight loss was much less a concern compared to starving or being predated.

The Paleo diet is interesting in that it eludes low-carb status by selectively excluding grains, and I’m pleased that high quality studies (randomized crossover) are at least being attempted, but data thus far suggest we haven’t found anything magical about Paleo (yet)… just need better studies, especially those controlling for total carb content.

Paleo:

+1 for excluding grains, but not much else


calories proper

Paleo vs. carbs (per se), Op. 68

The Paleo diet:

A)     the next big thing

B)      Atkins-lite

C)      Fail

D)     None of the above

While proponents of the Paleo diet take a page out of nutritionism‘s book and argue it’s about food choices, not macronutrients, my reductionism mandates inclusion of a comparative breakdown by protein, fat, and carbs.  In a recent publication, Lindeberg (a Paleo pioneer) compared Paleo to the Mediterranean diet in a cohort of CHD patients (Lindeberg et al., 2007 Diabetologia).  To make a long story short, Paleo came out on top in a variety of endpoint measures after 12 weeks.

Divide and conquer

The Paleo diet consisted of lean meat, fish, fruits, vegetables, potatoes, eggs, and nuts; grains and dairy were off-limits (Paleo is GFCF-friendly).  Paleo carbs include fruits, veggies, nuts, and beans… no starches, cereals, whole grains, added sugars, etc… FYI Atkins is very similar to Paleo but includes a lower absolute amount of Paleo carbs.  The Mediterranean dieters ate whole grains, low-fat dairy, vegetables, fruits, fish, oils, and margarines.  Both diets exclude processed junk food and both are relatively healthy diets.  

As such, both groups lost weight; slightly more on Paleo but this was probably due to reduced caloric intake (not uncommon for Paleo dieters; see below and also Osterdahl et al., 2008 EJCN):But the benefits of Paleo were much more robust WRT insulin sensitivity, which was markedly improved on Paleo but not Mediterranean.

Paleo: 1

Mediterranean: 0

With a 4% weight loss, why didn’t glucose tolerance improve in the Mediterranean dieters?  … weight loss is almost always accompanied by improved glycemic control…   The biggest difference in “foods” consumed by the two groups was cereals: 18 grams per day on Paleo vs. 268 on the Mediterranean diet… over 14 times more!  As I’ve discussed at length with gravitas, a high intake of cereals (aka grains aka fibre [in the figure below]) does not bode well for insulin sensitivity, inflammation, and outright all-cause mortality:

As such, Paleo does well to exclude grains.  Furthermore, Paleo is higher in protein and fat and lower in carbs- all good things.  A more interesting analysis showed that waist circumference (visceral fat) was associated with grain intake even when controlled for carbohydrates.  In other words, the detrimental impact of whole grains goes beyond their intrinsic carbohydrate content. (whole grains … insulin resistance … visceral fat)

Back to those calorie data for a moment, given that they were probably just as important as cereal exclusion in determining the results.  Why did Paleo dieters spontaneously eat so much less?  In a follow-up publication, Jonsson and colleagues assessed leptin and satiety in both groups (2010 Nutrition & Metabolism) and showed that despite eating less and losing more weight (things that should increase hunger and decrease satiety), Paleo actually did the opposite (hint: something to do with whole grains, perhaps?).

While the Paleo meals were smaller (5th and 6th rows) and contained fewer calories (3rd and 4th rows), they were just as satiating as Mediterranean diet meals (7th through 9th rows), leading the authors to conclude Paleo is more satiating calorie-for-calorie and pound-for-pound.  And if that isn’t enough, Paleo dieters also experienced a significantly greater reduction in leptin! (probably caused by their reduced food intake and body weight loss)  While the general consensus is that such a change in leptin should enhance hunger, as discussed previously I think lower leptin in this context reflects enhanced leptin sensitivity, which also helps to explain the improved insulin sensitivity.  Last but not least, WRT the Mediterranean diet I suspect reduced calories explains the weight loss, but the abundance of whole grains explains the blunted glycemic improvements.  (hint: whole grains … leptin resistance … insulin resistance) … (whole grain exclusion … leptin sensitivity … insulin sensitivity)

Paleo, the next big thing?  I’m holding out for a one-on-one with low-carb proper to exclude the role of Paleo’s lower carb content.  The whole grains issue requires no further confirmation IMO (e.g., Burr et al., 1989 LancetJenkins et al., 2008 JAMA, etc.).

The Paleo diet:

A)     the next big thing

B)      Atkins-lite

C)      Fail

D)     None of the above

might be considered “Atkins-lite,” probably not “the next big thing,” definitely not “fail.”

+1 for excluding grains


calories proper

Gluc-a-gone wild, Op. 60

optional pre-reading

Q. What happens to a type I diabetic when you 1) withhold insulin, 2) provide insulin, or 3) withhold insulin and suppress glucagon?  (Charlton and Nair, 1998 Diabetes)…

A. You learn glucagon is the bad guy.

Divide and conquer

Zero insulin makes you hyperglucagonemic, hyperglycemic, and ketoacidotic (see first column).  Insulin cures all of these things (second column), but they aren’t caused by insulin deficiency, per se… they’re caused by high glucagon, which itself is cured by insulin (second column) and SRIH (somatostatin, third column).  Cure the hyperglycemia by inhibiting glucagon and pathological diabetic ketoacidosis suddenly becomes physiological ketosis.

Uncontrolled diabetes also wastes muscle:Zero insulin makes you hypermetabolic and increases amino acid oxidation.  Insulin cures this, but again, it appears to be driven by hyperglucagonemia, not insulin deficiency.

Glucagon directly correlates with energy expenditure, and this isn’t the good metabolic rate boost sought by dieters, it’s the type that indiscriminately burns everything including muscle.  High protein diets also increase energy expenditure, but in pathological hyperglucagonemia, the amino acids come from muscle, not food.

The above mentioned study is most relevant to type I diabetes.  The following study is about glucagon and the far more common type II diabetes (Petersen and Sullivan, 2001 Diabetologia).

The effects of hyperglucagonemia can be blunted by glucagon receptor antagonists (GRAs).  In the figure below, a GRA (Bay-27-9955), was administered immediately prior to a glucagon infusion.  The GRA significantly reduced blood glucose levels, an effect largely attributed to the reduction in endogenous glucose production:One of the ways GRA’s accomplish this is by keeping glucose tied up in hepatic glycogen instead of flooding into the plasma (Qureshi et al., 2004 Diabetes; “CPD” is the GRA used in this study).  The figure on the left is primary human hepatocytes; on the left is in mice.Another way of looking at this is in mice chronically treated with glucagon or glucagon plus a GRA.  Glucose tolerance is obviously deteriorated by glucagon treatment, but is completely restored by a GRA (Li et al., 2008 Clinical Science):

One of the most severe side effects of diabetic hyperglycemia is nephropathy, which is similarly cured by GRA treatment:

The physiological role of glucagon is to prevent hypOglycemia; but hypERglycemia is the problem most of the time.  Don’t get me wrong, hypOglycemia can be deadly, but 1) it’s not nearly as prevalent as hypERglycemia, and 2) inhibiting glucagon doesn’t cause hypoglycemia, there are a battery of counterregulatory hormones that prevent hypoglycemia.

Furthermore, reducing glucagon action isn’t limited to glucagon receptor antagonists (GRAs), leptin and amylin can do it too!

And while gastric bypass surgery is easily more extreme than GRA’s and leptin or amylin therapy, it’s magical effect on diabetes remission might also be partly attributed to glucagon suppression (Umeda et al., 2011 Obesity Surgery):

Convinced yet?


calories proper

Leptin and insulin: resistance is futile, Op. 59

The biochemical similarities between resistance to the metabolic effects of leptin and insulin are ultra-complicated.  The studies discussed below suggest leptin sensitization is a pre-requisite for glycemic improvement and weight loss.  Similarly, low leptin levels (independent of fat mass) appear to be linked with high insulin sensitivity and the ability to lose weight.  “Low leptin” in this context (i.e., independent of fat mass) does not refer to the starvation-induced rapid decline of leptin or the complete absence of leptin, but rather to a high degree of leptin sensitivity (analogous to insulin sensitivity?).  The level at which this signal is mediated, however, remains to be determined (adipocyte? sympathetic nervous system? brain? in the Electric Kool-Aid?).

Is the resistance to high levels of endogenous leptin in established obesity similar to the effects (or lack thereof) of exogenously administered metreleptin?

Divide and conquer

My current hypothesis: 1) leptin sensitivity needs to be high and 2) leptin levels need to be adequate (too low and leptin sensitivity is meaningless; too high and you become leptin resistant).  This is summarized nicely in this clever little experiment (Knight et al., 2010 PLoS ONE).  Ob/ob mice genetically lack leptin.  Zero leptin, and monstrously obese (the mouse on the right).  If you add back the amount of leptin found in a lean insulin sensitive mouse (~5 ng/mL), they gain just as much weight on any diet as normal mice (and much less than untreated ob/ob mice [the mouse on the right]).  But here’s the catch: on a high fat diet, treated ob/ob mice gain as much weight (top row, left figure) despite much lower leptin levels (top row, right figure).

Ob-norm mice are phenomenally leptin sensitive (bottom right), but do not have enough leptin to support insulin sensitivity (bottom left) or physical activity (bottom middle figure).  If leptin levels are too high (wild-type mice on high-fat diet), on comes leptin resistance (bottom right) and glucose intolerance (bottom left).  This picture is incomplete but good enough to support the claim that leptin sensitivity needs to be high and leptin levels need to be adequate.

Insulin-resistant patients with type 2 diabetes mellitus have higher serum leptin levels independently of body fat mass (Fischer et al., 2002 Acta Diabetologia)

Higher insulin sensitivity in those with the lowest leptin levels (this group is probably the most leptin sensitive):The most insulin sensitive group (Tertile 3) has the lowest leptin levels but also the lowest body fat (i.e., it could be confounded by fat mass)

But the middle group is more insulin sensitive than the lowest group (by definition), and has lower leptin levels despite being fatter.  So it’s definitely not confounded by fat mass, and I think this is because they are more leptin sensitive.

Differential effects of gastric bypass and banding on circulating gut hormones and leptin levels (Korner et al., 2006 Obesity)  

Still not confounded by weight loss because the banded group weighed more but had lower leptin and higher insulin sensitivity than the overweight group.  In support of enhanced leptin sensitivity in the gastric bypass group, they experienced a significantly greater increase in post-meal satiety than the other groups.  Similarly, the overweight group (who have much higher leptin levels) actually experienced a decline in satiety after eating!

Now we’re getting somewhere!

Amylin improves the effect of leptin on insulin sensitivity in leptin-resistant diet-induced obese mice (Kusakabe et al., 2012 AJP)

Injection with leptin (squares) or amylin (triangles) alone does not reduce food intake or body weight in leptin-resistant diet-induced obese mice (open circles), but a combination of leptin and amylin does both (closed circles).Importantly, as seen in the figure below, neither leptin nor amylin alone improves glycemia.  Theoretically, this is because leptin sensitization is required to improve insulin sensitivity.  And amylin improves leptin but not insulin sensitivity.  The far right column in the right graph shows that the leptin-amylin co-treated group were more insulin sensitive.

Leptin sensitization is required to improve insulin sensitivity.  So why didn’t amylin alone improve the sensitivity to endogenous leptin? … perhaps because leptin sensitivity was high but leptin levels were inadequate.  Amylin-alone also lowered endogenous leptin levels, which may have counterbalanced the improved leptin sensitivity (top row, compare the first and third columns):In other words, the leptin-resistant mice could be artificially made more sensitive to their own endogenous 28.5 ng/mL of leptin with 100 ug/kg/d amylin, but not to their lower 19.7 ng/mL of leptin (in this study).

In rats, however, 100 ug/kg/d amylin is capable of endogenous leptin sensitization despite similar reductions in endogenous leptin (Roth et al., 2008 PNAS):This graph is showing a proxy for leptin sensitivity in rat brain.  The black bars are vehicle-treated, the white bars are leptin-treated.  Amylin-alone increased sensitivity to both endogenous leptin (second to the last bar) and exogenous leptin (last bar).  And indeed, amylin-alone (open triangles in the figure below) reduced body weight; the addition of exogenous leptin further reduced body weight (compare inverted triangles [leptin alone] to squares [leptin plus amylin]).

Similar results are obtained in humans (figure on the right).

The intermediate effects in mice illustrate an important point.  Amylin-induced sensitization to endogenous leptin, as seen in rats and humans but not mice, is required to reap the full benefits of leptin re-sensitivation.  This didn’t occur in mice, but occurred in all species (including mice) when exogenous leptin was administered to restore leptin to an adequate level.

In sum, restoration of leptin sensitivity is required for glycemic improvement and weight loss regardless of whether it is achieved by gastric bypass (Korner study, above), amylin treatment (Kusakabe study in mice; Roth study in rats and humans), a sugar-free diet (Shapiro study, discussed HERE), or a low-carbohydrate diet (Brehm et al., 2003 JCEM – greater weight loss and glycemic improvement despite eating more calories [associated with lower leptin levels]).  Personally, I’d attempt either of the latter prior to gastric bypass or pharmacological therapy with an experimental cocktail of metreleptin and pramlintide.  But that’s just me.

Just like insulin, you gotta get leptin levels down, not up, to see benefits.

calories proper

another side of leptin

Op. 56

Leptin is probably just as important as insulin WRT obesity, and this is as just as good a place as any to learn about this increasingly interesting hormone.

ABCs of Leptin in a nutshell:

A. Fed state: leptin is secreted from adipose and tells the brain to maintain food intake and energy expenditure at a body weight set point, which is likely established by diet.

B. Fasted state: leptin secretion declines, causing hunger to go up and energy expenditure to go down.

In the past, the cause and consequence of leptin resistance received a lot of my attention due to their importance in obesity.  Leptin resistance is, in brief, obesity.  Or the mouse on the right:

C. Obesity: eating a poor diet causes leptin resistance, which allows the body weight set point to rise until your fat cells stop responding to insulin (it’s kind of complicated)

But there’s another side of leptin that is mostly unknown, frequently overlooked, and poorly understood.  And I say this “is as just as good a place as any” to learn about it because while this side of leptin isn’t as popular as the energy expenditure, appetite, etc., stuff, it could very well be just as important, IMHO.

Leptin vs. the pathological hyperglycemia in diabetic state(s) (note the plural form of “state[s]”).

Leptin deficiency causes insulin resistance induced by uncontrolled diabetes (German, Morton, et al., 2011 Diabetes)

Divide and conquer

STZ is a beta-cell toxin used to induce diabetes.  STZ-treated mice have low insulin, low leptin, and lose weight despite a voracious appetite (just like type 1 diabetic humans).  Their insulin resistance is fully corrected while their marked hyperglycemia is attenuated by leptin injections.  Leptin reduces food intake but this doesn’t reduce body weight because energy expenditure paradoxically declines (discussed below).  Furthermore, diabetic mice restricted to eat only as much as leptin-treated diabetic mice (STZ-veh-PF)  lose significantly more weight because they lack the leptin-induced suppression in energy expenditure.

Summary of energy balance:

Control mice (veh-veh) eat the least but have much lower energy expenditure, causing them to weigh the most.  Energy expenditure is the more important variable driving high body weight in these animals (it goes down significantly more than food intake).  Diabetic mice (STZ-veh) eat the most food which is balanced by high energy expenditure (explained below), causing an intermediate body weight.  When the voracious appetite of diabetic mice is restrained (STZ-veh-PF), they weigh the least (they are starving).  Food intake is the more important variable driving low body weight in diabetic mice (energy expenditure is the same in diabetic and diabetic-PF mice).  STZ-leptin mice have intermediate food intake, energy expenditure, and body weight.  All is well, leptin cures the deranged energy balance of type I diabetes.

As mentioned above, diabetic mice eat more but weigh less because of drastically increased energy expenditure.  Energy expenditure is increased, in part, due to out-of-control gluconeogenesis (from hyperglucagonemia).  The paradoxical effects of leptin on energy expenditure (increases it in post-obese subjects but decreases it in diabetic mice) may be explained by leptin-induced reduction of this out-of-control gluconeogenesis, mediated via normalization of glucagon.

The authors further demonstrated that leptin restores liver, but not muscle or adipose insulin sensitivity in diabetic mice, independent of food intake.

Thus, insulin-deficiency -> dec. leptin -> inc. glucagon -> inc. hepatic glucose output -> hyperglycemia

Insulin’s primarily role might be to suppress glucagon.  STZ-induced “relative” state of starvation causes leptin to plummet; in the basal state, leptin may not have anything to do with glucagon because insulin keeps it under control.  But in diabetes, there’s no insulin to suppress glucagon; this is where exogenous leptin struts its stuff.

Collectively, these data further support the conclusion that insulin’s major function is to suppress glucagon, as opposed to other effects in skeletal muscle or adipose.  It’s been almost a year since Unger’s notorious publication which showed that glucagon receptor knockout mice were immune to type 1 diabetes (discussed here).  Diabetic hyperglycemia is partially mediated by insulin resistance, and largely mediated by hyperglucagonemia.  But why wasn’t hyperglycemia completely normalized by leptin replacement therapy?   These researchers sought simply to normalize leptin levels, but what would’ve happened if they provided a supraphysiological dose of leptin?  During physiological leptin replacement therapy, glucagon levels were normalized, but a hint of hyperglycemia remained.  Some other [leptin resistant?] member(s) of glucagon’s nefarious cohort must be responsible for the residual diabetic hyperglycemia…

Fortunately for us, the effects of supraphysiological leptin were tested in an identical experimental paradigm:

Leptin therapy reverses hyperglycemia in mice with streptozotocin-induced diabetes, independent of hepatic leptin signaling (Denroche, Kieffer, et al., 2011 Diabetes)

Indeed, supraphysiological leptin therapy overcame whatever diabetic “leptin resistance” remained and totally cured hyperglycemia.

This study repeated much of what was done in the first study, but whereas the first study added that leptin’s effect on food intake was not involved, this study showed that hepatic leptin signaling was not responsible either:

In both cases, hyperglucagonemia appears to be a major cause of diabetic hyperglycemia, and this is cured by leptin.  Insulin sensitivity was only partially restored by physiological leptin replacement; this seems to be due to some sort of apparent “leptin resistance,” which is overcome by supraphysiological leptin.  Diabetic insulin resistance is most likely caused by hyperglucagonemia-induced increased hepatic glucose output, and this is cured by leptin’s [non-hepatic] effects on reducing glucagon levels.  Diabetic insulin resistance may be partially caused by a brain mechanism, but at least one brain mechanism (food intake) was ruled out by the German study.

And oh so interestingly, all of these effects were mimicked by leptin administration directly into the brain, at a dose which caused no change in peripheral leptin levels (German, Morton, et al., 2011 Endocrinology).  The “STZ-lep” in the figure below refers to diabetic mice with leptin administered directly into the brain.

Back to the plural form of diabetic “state[s]” mentioned in the intro.  All of the above studies were in insulin-deficient SKINNY type 1 diabetic mice.  The next study is in OBESE type 2 diabetic rats.

Subcutaneous administration of leptin normalizes fasting plasma glucose in obese type 2 diabetic UCD-T2DM rats (Cummings, Havel, et al., 2011 PNAS)  

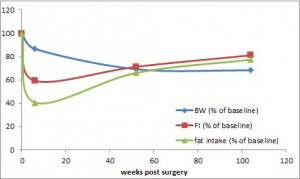
N.B. the control rats in this study were pair-fed to the leptin treated animals to control for the leptin-induced satiation.  Leptin-treated mice lost less weight most likely because energy expenditure declined (just like in the first study mentioned above).

In agreement with the glucose normalization seen by leptin treatment in skinny type 1 diabetic animals, leptin reduced glucose levels in obese type 2 diabetic rats, and this too was associated with reduced glucagon levels:

In type 1 diabetic animals, there are very low insulin levels regardless of food intake, leptin treatment, and hepatic leptin signaling.  Thus, insulin has nothing to do with the effects of leptin in type 1 diabetes.  This study showed that insulin levels also have nothing to do with the effects of leptin in obese type 2 diabetes:

So while the efficacy of exogenous leptin administration in established obesity is questionable, it is capable of combating the pathological glucagon-induced hyperglycemia which is responsible for much of the damage incurred by the diabetic state[s].

Leptin, glucagon, and diabetes.


calories proper

Episode 1 of the ketosis series

Episode 1 of the ketosis series

Ketosis vs. leptin

My current running hypothesis, based on a few rodent-diet studies, is that leptin resistance is mediated entirely by sugar and is not influenced by dietary fat.  The relationship between leptin resistance and obesity is somewhat less clear (does leptin resistance cause hyperphagia and obesity?  does hyperphagia and obesity cause leptin resistance?  The latter example seems odd, but it would imply that leptin resistance develops after the onset of obesity… which would be supported by the observation of leptin sensitive obesity (e.g., here)

The study discussed below is another example of obesity sans leptin resistance.  To review, leptin resistance can occur without obesity on a high fructose diet, but it does not occur on a sugar free high fat diet.

Sensitivity to the anorectic effects of leptin is retained in rats maintained on a ketogenic diet despite increased adiposity (Kinzig et al., 2010 Neuroendocrinology)

Unfortunately, this was a pretty bad “diet” study from a nutrition perspective because there are way too many variables.  Are the results due to increased dietary fat?  lower protein?  lower carbs?  Aargh.  We will never know because they were all manipulated and uncontrolled.  (psychologists and neuroscientists should NOT be allowed to design nutrition experiments).  Even the types of protein and fat were different between the groups.

This study in a nutshell: leptin sensitivity and various other metabolic parameters were measured in rats fed chow or a ketogenic diet.

Divide and conquer.

What is a ketogenic diet?

exhibit A:

A ketogenic diet is insulinopenic = low carb, high fat.  The biochemical signature is elevated serum ketone bodies.  ?-hydroxybutyrate (red box in the table above) is the most abundant, and its elevation in the ketogenic diet-fed rats (KD) confirms that indeed, this was a ketogenic diet (note, b-Hb @ 0.33 mM is a very mild ketosis).

Unfortunately, these authors quantified fat mass by tissue excision and weighing, which is an inferior and inaccurate technique.  However, since the fat mass and leptin data* concur, we can infer KD rats were probably a little fatter by the end of the study.

*Leptin increases when fat mass increases.

Leptin sensitivity was measured by injecting leptin i.p. and measuring food intake for the next 24 hours.  Higher leptin sensitivity results in a greater reduction in food intake.  As seen in the figures below, chow-fed rats (figure a, on the right) were more leptin resistant than KD rats (figure b, on the right). 

In fact, KD rats responded to 100 ug of leptin whereas it took almost 6 times more (2 mg/kg = ~600ug) to achieve a similar reduction in chow-fed rats.

One minor critique: the authors believed that a key novel finding of their study was that KD rats were more leptin sensitive despite being fatter… Given that adiposity was such a critical factor in their conclusion, they should have used something better than the worst way to measure fat mass.  Thus, a weak point of this study is that the validity of the conclusion (which is also in the title of the paper) is based on a notoriously inaccurate technique.

Interestingly, despite exhibiting resistance to peripherally administered leptin (above), chow-fed (below, figure a) rats were equally sensitive to KD rats (figure b) when leptin was centrally administered (i.c.v.):

The authors proceeded to speculate that leptin is less able to cross the blood-brain barrier in chow fed rats compared to KD.  It’s possible.  One theory on the mechanism of leptin resistance states that elevated triacylglycerols impair leptin’s ability to cross the BBB.  This is probably not true, as KD rats were more leptin sensitive despite having higher triacylglycerols.  $

One more minor critique, which I only mention because this issue arises frequently and is often ignored.  although I still don’t know what it means:

1)      If KD rats were significantly more sensitive to leptin, why was their 24h food consumption similar to chow-fed rats? (see saline injections in any of the figures above and here)

2)     Leptin levels in KD rats were significantly higher than those in chow-fed rats (8.65 vs. 2.99 ng/mL).  If they were indeed more leptin sensitive, then shouldn’t their food intake been lower than chow-fed rats?

3)      KD rats had significantly higher leptin levels (8.65 vs. 2.99 ng/mL).  So injecting KD rats with 100ug leptin increased their leptin from 8.65 ng/mL to 8.65 + X.  Whereas injecting chow rats with 100ug leptin increased their leptin from 2.99 to 2.99 + X.  Since “8.65 + X” will always be mathematically greater than “2.99 + X,” circulating leptin in the KD rats injected with 100ug of leptin should have been significantly greater than circulating leptin in chow-fed rats injected with 100ug leptin, so KD rats would have ingested less than chow-fed rats even if they were equally leptin sensitive. As such, I don’t think it’s proper to conclude, from those experiments alone, that KD rats were more leptin sensitive.  $$

3.5)  Is there a difference between endogenous and exogenous leptin?  I.e., is exogenous leptin stronger than endogenous leptin?  If so, this is very important.  Food for thought.


calories proper