Category Archives: Ketosis

40 years ago a group of researchers turned ketosis into poetry.

But first, a brief primer.  In red.

“The glucose muscle-sparing effect of fat-derived fuels” 

or, the Randle Cycle 2.0.  it’s like a course in life enhancement.

Part I.  Intermediary metabolism

The glucose-fatty acid cycle
The Randle Cycle, as originally proposed, states that fatty acid oxidation inhibits glucose oxidation.  This is good because during starvation, every tissue than can survive on fatty acids instead of glucose should do so, sparing as much precious glucose as possible for the brain.

The glucose-sparing effect of fat-derived fuels
A critical vital horcrux to this is in the oh-so-humbly-disguised phrase “fat-derived fuels.”  The fat-derived fuels are ketones, and they are rescuing the brain from starvation (ie, neuroglycopenia); they do so by supplementing glucose as a fuel source.  Ketones are good at this; many tissues are happy to oxidize ketones when they are available.

The glucose muscle-sparing effect of fat-derived fuels
Ketones are derived from fat.  During prolonged starvation, glucose comes from skeletal muscle amino acids (eg, alanine).  Ketones spare glucose.  Thus, ketones spare muscle.  QED.

Continue reading

[ketogenic] elite artistic gymnasts

Before you say anything, “elite artistic gymnasts” could probably beat you in a race running backwards.  (with you running forwards.)  They are elite athletes.  And given a sufficient keto-adaptation period, they perform better sans carbs.

Ketogenic diet does not affect strength performance in elite artistic gymnasts  (Paoli et al., 2012)

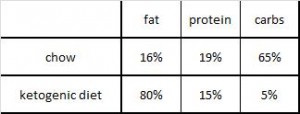
This study looked at body composition and various performance measures before and after 30 days of a very low carbohydrate ketogenic diet (“VLCKD,” < 25 grams of carbohydrate per day) or a normal diet (“WD,” > 250 grams of carbs per day).  25 grams of carbs is very very low, less than Atkins and Kwasniewski.  On the other hand, 41% protein is pretty high.

Continue reading

These nutters ate only meat for a year. Place your bets!

Who defines “moderation,” anyway?  An homage to pioneering nutrition research III, Op. 100.  Keep an open mind!  (and remember these words: “no clinical evidence of vitamin deficiency was noted.”)

MY LIFE WITH THE ESKIMO (Stefansson, 1913)

The effects on human beings of a twelve months’ exclusive meat diet (Lieb, 1929)

Prolonged meat diets with a study of kidney function and ketosis (McClellan and Du Bois, 1930)

Vilhjalmur Stefansson traveled with Eskimos in the Arctic for 9 years and lived almost exclusively on meat.  Then he and a fellow expeditioner (Andersen) decided to recapitulate this in a well-controlled, albeit warmer (New York), laboratory setting so they could document the metabolic insanity that ensued. At the time, the Eskimo diet was moderate protein, very high fat, yet they had no heart or kidney problems, were glucose tolerant, and exhibited no signs of ketoacidosis.  So the scientists said: “why not?”  (they were really hoping this apparent healthiness wasn’t due to the frigid Arctic temperatures.)

The studies describe the Central Plains’ Indians who subsisted almost entirely of buffalo meat, which they called the “staff of life,” and South American tribes which eat solely beef and water, then go on to say [sic]: “All of these races are noted for their endurance of exertion and hardships.”  They cite two tribes of Eskimos:  Greenlanders, who ate the typical diet (described above) and showed no signs of rickets or scurvey; and the Labradors, who had both diseases but ate more potatoes, flour, and cereals.  While traversing the Arctic, Andersen developed scurvy at a time when he was eating canned foods and very little meat; this was immediately cured by with raw meat :/

Food for thought: this diet is seriously deficient in vitamin C by today’s standards, but they exhibited NO symptoms.  Perhaps vitamin requirements vary based on the background diet?  Maybe our vitamin C requirement is increased by a Western diet (>50% carbs and lots of vegetable oils).  just sayin’

Continue reading

adipose, horcrux of metabolism

You wanna burn fat?  ATGL (Adipocyte Triacylglycerol Lipase) is your man.  ATGL is responsible for breaking down fat, a necessary precondition for fat burning.  Mice lacking ATGL accumulate tons of fat: 20x more in the heart, 10x more in testis, 3x more in skeletal muscles, 2x more in the GI tract, etc., etc.  Not surprisingly, they’re overweight.

Part 1.  The importance of the ability to un-store fat: appetite, body composition, and insulin.

Continue reading

what is our proper “natural” diet?

Figuring out how best to eat, physiological insulin resistance, and an homage to pioneering nutrition research.

Insulin resistance, as we know it today, is associated with poor nutrition, obesity, and the metabolic syndrome.  But it’s FAR more interesting than that.  Indeed, it could even save your life.  At the time when the pioneering studies discussed below were occurring, the researchers had no idea insulin resistance was going to become one of the most important health maladies over the course of the following century.  Furthermore, these somewhat-primitive studies also shed some light, possibly, on how we should be eating.  hint: it might all come down to physiological insulin resistance.

The reduced sensitivity to insulin of rats and mice fed on a carbohydrate-free, excess fat diet (Bainbridge 1925, Journal of Physiology)

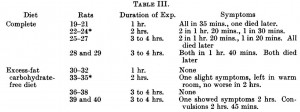
Rats were fed either a normal starch-based diet (low fat), or a high butter diet (low carb) for one month, then fasted overnight and injected with a whopping dose of insulin (4 U/kg).  First, take a guess, what do you think happened and why.  Then, click on the table below.

To make a long story short, all the starch-fed rats died while all the butter-fed rats lived.

On a high-fat zero-carb diet, plasma insulin levels are low.  Insulin is low because there no carbs (i.e., it’s supposed to be low).  Under conditions of low insulin, unrestrained adipose tissue lipolysis leads to a mass exodus of fatty acids from adipose tissue.  These fatty acids accumulate in skeletal muscle and liver rendering these tissues insulin resistant.  But this doesn’t matter, because insulin sensitivity is unnecessary when there aren’t any carbs around.  So if that rogue research scientist who’s always trying to jab you with a syringe filled with insulin actually succeeds, you won’t die.  The high-fat diet prevents insulin-induced hypoglycemic death.  This is physiological and absolutely critical insulin resistance.

To determine if this was specific to dairy (butter) or a general effect of a high fat zero carb diet, Bainbridge repeated the experiments with lard.  Lo-and-behold, lard-fed rats were just as fine as those dining on butter.  

To be sure, these studies exhibited a high degree of animal cruelty… but their simplicity is laudable.  And Bainbridge’s findings are not an isolated case.

Studies on the metabolism of animals on a carbohydrate-free diet.  Variations in the sensitivity towards insulin of different species of animals on carbohydrate-free diets (Hynd and Rotter, 1931)

Instead of starch, lard, and butter, Hynd and Rotter used milk and bread, cheese, and casein.  And their findings were essentially identical to Bainbridge’s: mice, rats, or rabbits fed carbohydrate-free diets were insulin resistant and protected against insulin-induced tragedies.

The interesting finding was in kittens, who sadly maintained insulin sensitivity when fed fish (high protein) or cream (high fat).

You’re probably thinking: why would I say any state of heightened insulin sensitivity is “sad?”  WELL, I say “sad” because we’re talking about physiological insulin resistance; a condition when resistance to the hypoglycemic effect of insulin is essential, and lack thereof is incompatible with survival.  To be clear: 1) kittens remain insulin sensitive on high fat and protein diets; and 2) this is OK because there aren’t any rogue research scientists running around trying to jab them with insulin.  While I can’t say for sure, this might have something to do with what kittens are supposed to eat, i.e., their natural diet.  High protein and fat diets won’t make them insulin resistant because unlike rodents, that is their normal diet.  (real mice eat fruits and seeds; laboratory mice eat pelleted rodent chow; cartoon mice eat cheese.)   Lard causes ectopic lipid deposition in insulin sensitive tissues in rodents because they aren’t accustomed to it.  Mice are optimized to eat a high carb diet.  Kittens eat protein and fat, usually in the form of mice.  But when given bread, kittens develop insulin resistance.  There is no bread in mice.

While we shouldn’t base our diet around the possibility of turning a corner and being jabbed with a syringe filled with insulin, perhaps we are simply more similar to kittens.  Hypercaloric diets loaded with sugar, excess carbohydrates, and empty calories cause [pathological] insulin resistance (which could theoretically save your life if a rogue research scientist jabbed you with insulin), whereas the opposite is true for diets high in fat and protein.  This is repeatedly demonstrated in diet intervention studies, most recently in the notorious Ebbeling study (Missing: 300 kilocalories).  When people were assigned to the very low carbohydrate diet, insulin sensitivity was significantly higher than when they were on low fat diets:Soapbox rant: I’m not saying low carb is what we are supposed to eat.  Nor am I saying it is the optimal diet.  IMHO any diet which excludes processed junk food and empty calories is “healthy.”  The Paleo diet isn’t healthy because some nutritionista says it’s what we are supposed to eat; Paleo is healthy for the same reason as Atkins, Zone, South Beach, and a million others: no junk food.

Maybe the diet we’re supposed to eat has nothing to do with the healthiest diet.  Maybe not.  But it probably isn’t bad for you.  just sayin’

calories proper

Diet, diabetes, and death (oh my)

Fatty acid face off: saturation vs. chain length
or
an homage to pioneers of nutrition research

While both fats contain a lot of 8-12 carbon fatty acids (C8-C12), coconut oil contains more of the 12-carbon fatty acid “lauric acid” whereas medium-chain triacylglycerols (MCT) have more of the 10-carbon fatty acid “capric acid.”  Both exhibit remarkably protective effects against diabetes and this has been known for quite a while.  Coconut and MCT oils are also phenomenally ketogenic, which contributes to their healthful effects (although this eluded early researchers).

Experimental diabetes and diet (Houssay and Martinez 1947 Science)

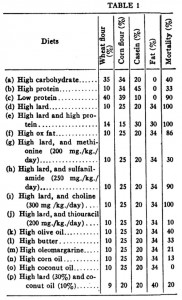
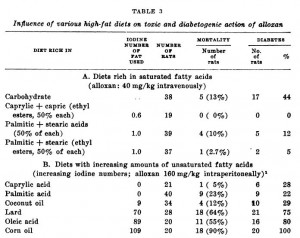
This study used alloxan to deplete insulin-producing beta-cells rendering these rats essentially type I diabetic.  In the first experiment, they injected alloxan and counted how many rats were still alive after one week.  This study is cruel by today’s standards, but things were different in 1947.  It does, however, provide valuable information as the rats were also being fed one of 16 (16!) different diets.  The major finding was that all the rats fed lard died (d, e, and i in the table below), while all those fed coconut oil survived (o in the table).  And additional coconut oil, methionine, or thiouracil, but not protein, sulfanilamide, or choline reduced the deadliness of lard.  Both lard and coconut oil contain saturated fat, but lard has longer chain fatty acids and more unsaturated fat than coconut oil suggesting fatty acid chain length and/or degree of unsaturation may be important.

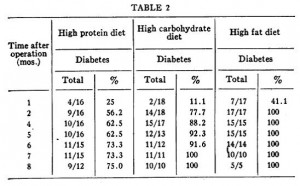
In the follow-up experiment, rats were rendered diabetic by surgical removal of 95% of their pancreas and fed high carb, high protein, or high lard diets (a, b, and d from the table above).  In agreement with the first experiment, lard is bad news.  On the other hand, whereas a high protein diet wasn’t helpful for alloxan diabetes, it was remarkably protective in pancreatic diabetes. 

Influence of diet on incidence of alloxan diabetes (Rodriguez and Krehl 1952)

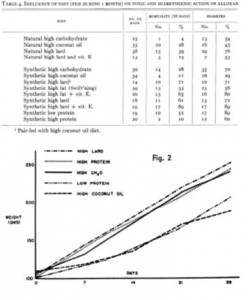
These researchers measured mortality and diabetes incidence in alloxan-treated rats and found that: 1) coconut oil is protective against mortality and diabetes; 2) lard is not; and 3) high protein is modestly protective.  IOW, these data confirm Houssay’s from 5 years earlier.These authors added some information to the picture by measuring body weight and showing that the protective effect of coconut oil is not due to reduced body weight, because these coconut oil-fed rats weighed as much as those fed a low protein diet, and low protein diet-fed rats fared rather poorly.

To add yet more information to the picture (kudos!), they fed rats diets containing the most abundant fatty acids found in coconut oil (caprylic acid) or lard (palmitic acid) and showed that coconut oil’s benefits may be due to caprylic acid because this fatty acid alone was similarly protective against mortality and diabetes.  They also showed lard’s malevolence is not due to palmitic acid because these rats were almost just as protected as those fed caprylic acid.  This somewhat excludes a role of fatty acid length as caprylic acid has 8 carbons while palmitic acid has 16, but both are fully saturated (suggesting a possible detrimental role for unsaturated fatty acids [?]).

So why is coconut oil so good?

One possible reason:  saturated fatty acids are protective, which is supported by the beneficial effect of coconut oil, caprylic acid, and palmitic acid.  Similarly, lard and Swift’ning have a lot of unsaturated fats and both were detrimental.

Unsaturated fatty acids and alloxan diabetes (Rodriguez et al., 1953 Journal of Nutrition)

Rats fed saturated fats of varying chain length were remarkably more protected than those fed unsaturated fats.  Lard has a lot of oleic acid, and rats fed oleic acid didn’t do so well; corn oil is predominantly unsaturated fat and rats fed corn oil were phenomenally unhealthy.  They also showed that rats fed stearic acid (18-carbons, fully saturated) were much healthier than those fed oleic acid (18-carbons, monounsaturated). While none of these studies explored the ketogenic effects of C8-12 fatty acids, they clearly demonstrated that saturated fatty acids of any chain length are good for diabetics, while unsaturated fatty acids are bad.  Good sources for C8-10 fatty acids are MCT oil and goat’s milk, and a good source for C12 fatty acids is coconut oil.

As to the role of ketones, which I think is quite important… to be continued

calories proper


Ketosis, III

Ketosis series, take III

Hepatic steatosis, inflammation, and ER stress in mice maintained long-term on a very low-carbohydrate ketogenic diet (Garbow et al., 2011 AJP)

This study is similar to the one discussed in Ketosis series # 2, (A high-fat, ketogenic diet induces a unique metabolic state in mice [Kennedy et al., 2007 AJP]), both were 12 weeks long and used identical ketogenic diet.  However, the high fat/Western diets and body composition of mice on the ketogenic diet are different.

Nitpicking 101:  I don’t understand why researchers can’t select proper diets for these so-called “diet studies.”

KD, ketogenic diet; WD, Western diet

The macronutrient ratios are all over the place, but the worst part is that there is no attempt to control for the types of fat, protein, and carbs.  For example, the fats in the ketogenic diet are primarily lard and butter, while those in the Western diet are tallow and shortening… so basically the ketogenic diet is MUFA and PUFA while the Western diet is SFA and trans fat!  What exactly are we trying to compare, the effects of different dietary fats?  sacrebleu!

Divide and conquer

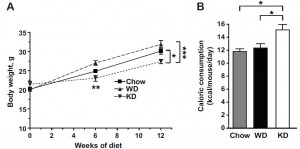
In accord with previous studies, mice on a ketogenic diet weigh less and eat more than those on chow or high fat diets.  Yada yada yada, just show this figure to the next person who promotes “eat less and move more” for weight loss.  (activity wasn’t measured in this study, but was here, which showed no change or even slightly reduced activity in mice on a ketogenic diet)


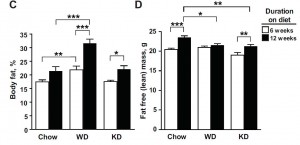
Divergences from Kennedy 2007: #1) body composition of KD mice in this study is identical chow;  lean mass in WD is less than chow and similar to KD.


WRT body fat, KD = chow < WD (HFD).  WRT lean mass, chow > WD = KD.

To refresh your memory, here are the data from Kennedy 2007:


The high fat diets are different, so a direct comparison is not possible.   But there is definitely a difference in how KD mice fared relative to chow, and the ketogenic diets were identical so a direct comparison is OK  (there were some other minor differences, like the age when the mice were started on the diet [6 wks vs. 8 wks]).  In Kennedy 2007, chow mice had the lowest body fat percentage, while in Garbow 2011 chow and KD are equivalent.  The differences are small, so it can slide (for now).  But FTR, since the ketogenic diets are identical, it would’ve been nice for Garbow to address some of these discrepancies in their discussion.

crackin’

From the body fat data above and food intake data below (which I extrapolated from diet composition and caloric intakes), it is clear that eating a lot of dietary fat won’t make you fat, even if it’s lard and butter.  KD mice ate 3x more fat than WD and almost 10x more than chow, but it didn’t cause them to get fat.  It’s only when sugar is added into the mix, as in the Western diet (40% carbs from sucrose & starch), when fat mass begins to accumulate.


Again, it’s surprising that KD mice ingested so much less protein yet maintained all of their muscle mass.  However the textbooks do say, explicitly, that nitrogen balance can be maintained when dietary protein is reduced if total caloric intake increases.  And that’s what happened (caloric intake increased), and maybe that explains the lean mass.  But it seems to me as if the increase in calorie intake (+20%?) was too much less than the reduction in protein intake (-75%) to completely account for the lean mass.  IOW, these data confirm that ketogenic diets are at least 50% magic.  I say that because the relationship between lean mass, protein, and calories is firmly adhered to by the other groups in this study.  I.e., chow mice ingested more protein than WD but the same amount of calories, and accordingly they had more muscle mass.

Moving on,

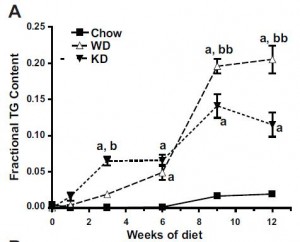
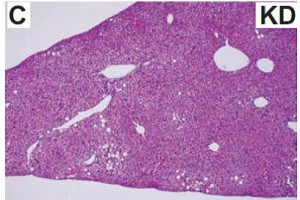
As expected, the ketogenic diet caused an increase in liver fat.  Not to worry, this is simply a product of the diet … KD = very low carbohydrate intake, so hepatic glycogen stores will be reduced; but the liver still needs energy and fat is in high abundance, so the liver accumulates fat instead.  It’s more physiological than pathological.


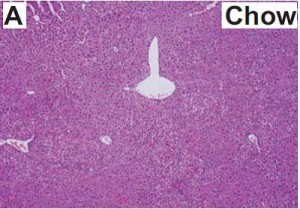
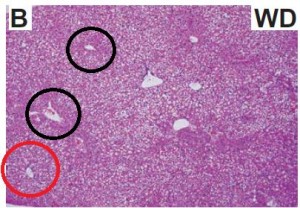
Normal liver:

Pathological fatty liver:

lots of fat around the portal vein (red circle), less fat around the central vein (black circles).

Physiological fat stores: sparse lipid droplets

From Kennedy 2007:


KD mice in both studies, and also in Jornayvaz et al. (2010 AJP), accumulated more fat in their livers than chow-fed mice, but the livers in Kennedy’s WD mice accumulated more fat than KD while the livers in Garbow’s HF mice accumulated less fat than KD …  and the high-fat diets were apparently similar in both groups:

Kennedy’s High fat diet (D12451)

Garbow’s Western diet (TD.96132)

Both diets were casein-based high fat diets, with carbs coming from sucrose and starch.  However, the fat source in D12451 is lard/soybean oil (7:1) while that in TD.96132 shortening/tallow (1:1).  Therefore, despite being fed a similar amount of fat, the WD mice in Garbow’s study were fed trans fat, which is surely worse for the liver than the lard that was fed to the HFD mice in Kennedy’s study.  This likely explains why the livers of Kennedy’s HFD mice were ~1.3x fattier than control while the livers of Garbow’s WD fed mice were ~10.3x fattier than control.

So, going back to the eternal complaint against most diet researchers: get a clue about what you’re feeding your mice or consult a nutritionist before wasting taxpayer’s money on bunk diet studies.

Alternatively, perhaps Kennedy was out to vilify the ketogenic diet.  If that were the case, then he would cunningly select a high-fat diet that produced a liver that was less fatty compared to the ketogenic diet.  This would certainly make the ketogenic diet appear worse than the horrid high-fat diet, which everyone already knows is bad :/

but that sounds like slander


calories proper


Episode 2 of the ketosis series

Time for the second edition of our ketosis series. Some background:  physiological ketosis occurs when the body is burning fat very rapidly, like after an overnight fast or during low carb high fat dieting (e.g., Atkins induction phase).  NB this is not the same as pathological diabetic ketoacidosis or alcoholic ketoacidosis.  In humans, ketotic diets work like a drug for fat loss.  In rodents, there are a variety of responses which although they vary widely between studies, they all provide insight into this “unique” state.

Without further ado, today’s post: A high-fat, ketogenic diet induces a unique metabolic state in mice (Kennedy et al., 2007 AJP)

This study included four! diet groups.  Although the dietary interventions were poorly designed from a nutrition perspective, the fact that there were four of them means that we should be able to learn something from this paper.

The fourth group is 66% calorie restricted (CR) chow.


As a brief aside, although the diets could have been designed better, at least their KD was a bona fide ketogenic diet (in contrast to the first paper in the ketosis series, where the ketogenic diet group was only mildly ketotic [bHB was only 50% greater in KD relative to control).   As seen in the table above, b-hydroxybutyrate, the major circulating ketone body, was markedly elevated in KD compared to the other groups.

Caloric intake was similar among the groups (except CR [open circles], who ingested 33% fewer calories [by design])
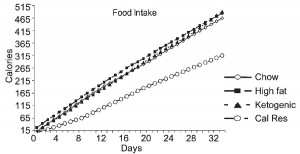
One minor point: the HF diet is high in fat and sugar; KD is only high in fat, chow is low in fat, and neither KD nor chow have any sugar.  Does palatability affect food intake in mice?  If so, we might expect mice to eat more HF than KD (HF = cake icing; KD = Crisco).  And by “more,” do we mean “more calories” or “more food?”  Palatability probably doesn’t affect food intake [in the mice in this study] because although HF mice were eating just as many calories as KD and chow, they were eating much less food (higher calorie density etc.).

Interestingly, however, body weight differed markedly between the groups … [i sense a diatribe on the laws of energy balance… ]
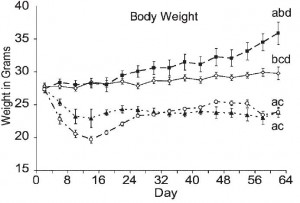
HF (closed squares, top line) gained the most weight, followed by chow (open diamonds), then CR (open circles) and KD (closed triangles).  That last part is pretty amazing; mice on the ketogenic diet (KD, closed triangles) were eating half more calories than CR but they weighed just as much.  Alternatively, CR mice were eating 33% fewer calories than KD but they weighed just as much!  Either KD increases energy expenditure, or CR reduces it.
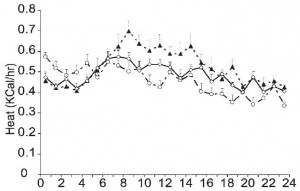
…err… or both.  Looks like KD (closed triangles) was always a little higher while CR (open circles) was always a little lower.  The figure above is showing total metabolic rate.  FTR, the units are kcal/hr which in this instance is the appropriate metric.  It is not uncommon for researchers to present these data as kcal/kg*hr, which corrects for differences in body weight.  Even though there were differences in body weight, “kcal/hr” is still the proper way to present these data because absolute, not relative, differences in metabolic rate produce changes in body weight that can be compared across groups.  Relative differences in metabolic rate, such as those that are normalized for body mass (kcal/kg*hr), are interesting and informative, but they don’t describe a variable that directly impacts body weight and can be compared across groups, which is what we are looking for in this case.

One more point needs to emphasized at this … point.

Mice fed chow, HF, and KD all ingested the same kcal/d (~15, as per figure 1.)  Since we know the composition of the diets, the amount consumed of each macronutrient can be calculated:
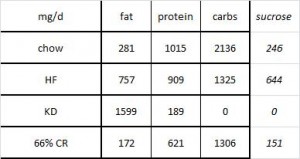


KD mice ate >2x more fat than HF (1599 mg vs. 757 mg).  HF mice ate the most sugar, while KD ate the least sugar.  Thus, HF mice (who were also eating a high sugar diet) diet weighed 50% more than those on the ketogenic diet, despite eating only half as much fat (and equal calories)!  Why?  *

CR mice lost weight, but their metabolic rate declined significantly (think: sluggishness, fatigue, etc.).  KD mice ate 50% more calories than CR mice but weighed exactly the same and had a higher metabolic rate (think: lots of energy, high activity level, etc.).  *

Well, actually, in terms of body composition, chow guys did the best:
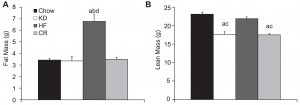
HF mice accumulated the most fat mass (the product of a carb-rich high fat diet).  They also had as much lean mass as the chow group.  If we were to transcribe these data to percent body fat, chow would have the lowest (they weigh more than KD & CR, but have the same amount of fat mass; the numerator [fat mass] is the same but the denominator [body weight] is higher in the chow group).

Chow-fed mice ate the most protein and had the highest lean mass.  Coincidence?  By this you might argue that KD ate the least protein therefore they should have less lean mass than CR.  *You’re forgetting that the ketogenic diet is 0% carbs and 50% magic.

KD & CR had the lowest lean mass.  A few points about this:  for starters,  the ultra-low protein intake caused this in KD mice (muscle wasting), while in CR mice it was more likely due to a combination of deficient calories and suboptimal protein intake.  When calorie intake goes down, the amount of protein required to maintain nitrogen balance increases.  So if you reduce calories, lean mass will decline unless protein intake is increased.  In CR, calories and protein intake declined.

WRT the KD mice, they exhibited reduced lean mass but their relative metabolic rate was the highest out of all 4 groups.  Usually a loss of lean mass is accompanied by (or causes) a reduced metabolic rate, but the opposite happened.  I find this interesting.  Very interesting.

The researchers did a few more experiments*, and further confirmed that the ketogenic diet increases the absolute energy expenditure and markedly increases relative energy expenditure which allows the animals to eat just as much food while losing weight.

*actually, they did a ton more experiments, this paper was a bear.  Kudos.

They also tested “overall well-being” by measuring how much the mice explored a novel environment.  They found no difference between KD & chow, but HF mice exhibited “reduced exploratory activity.”  Translation: a high fat (ketogenic) diet is good (e.g., KD), but a high fat high carb diet is bad (e.g., HF).

For the inquiring minds, the mechanism of KD’s anti-obesity effects were most likely due to elevated heat dissipation via brown adipose tissue .  This is in contrast to which what was alluded above; although “exploratory behavior” was similar in KD mice, physical activity was not measured directly so it can’t be concluded that KD mice ran around and played more than the other mice.  Given the brown fat data, it is possible that basal metabolic rate (total heat production) was increased due to the ketogenic diet.  This could be good news for some; on a ketogenic diet, weight loss is not dependent on increased physical activity, the fat mass would simply (almost literally) melt away, no need to exercise.

This study is another example of how “eat less and move more” is wrong.  KD mice didn’t “eat less,” they ate differently; and the composition of the diet alone accomplished the “move more” part without requiring any type of exercise by increasing basal metabolic rate.  The diet did all the hard work for them.  And these mice were eating ad libitum, which means they were never hungry in contrast to the CR mice that were eating 33% fewer calories.   Calorie restricted diets are optimal for neither fat loss nor well-being.


calories proper


Episode 1 of the ketosis series

Episode 1 of the ketosis series

Ketosis vs. leptin

My current running hypothesis, based on a few rodent-diet studies, is that leptin resistance is mediated entirely by sugar and is not influenced by dietary fat.  The relationship between leptin resistance and obesity is somewhat less clear (does leptin resistance cause hyperphagia and obesity?  does hyperphagia and obesity cause leptin resistance?  The latter example seems odd, but it would imply that leptin resistance develops after the onset of obesity… which would be supported by the observation of leptin sensitive obesity (e.g., here)

The study discussed below is another example of obesity sans leptin resistance.  To review, leptin resistance can occur without obesity on a high fructose diet, but it does not occur on a sugar free high fat diet.

Sensitivity to the anorectic effects of leptin is retained in rats maintained on a ketogenic diet despite increased adiposity (Kinzig et al., 2010 Neuroendocrinology)

Unfortunately, this was a pretty bad “diet” study from a nutrition perspective because there are way too many variables.  Are the results due to increased dietary fat?  lower protein?  lower carbs?  Aargh.  We will never know because they were all manipulated and uncontrolled.  (psychologists and neuroscientists should NOT be allowed to design nutrition experiments).  Even the types of protein and fat were different between the groups.

This study in a nutshell: leptin sensitivity and various other metabolic parameters were measured in rats fed chow or a ketogenic diet.

Divide and conquer.

What is a ketogenic diet?

exhibit A:

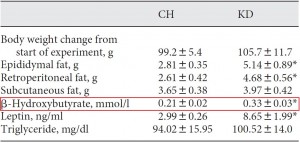
A ketogenic diet is insulinopenic = low carb, high fat.  The biochemical signature is elevated serum ketone bodies.  ?-hydroxybutyrate (red box in the table above) is the most abundant, and its elevation in the ketogenic diet-fed rats (KD) confirms that indeed, this was a ketogenic diet (note, b-Hb @ 0.33 mM is a very mild ketosis).

Unfortunately, these authors quantified fat mass by tissue excision and weighing, which is an inferior and inaccurate technique.  However, since the fat mass and leptin data* concur, we can infer KD rats were probably a little fatter by the end of the study.

*Leptin increases when fat mass increases.

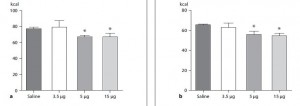
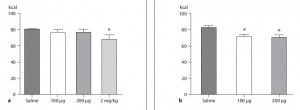
Leptin sensitivity was measured by injecting leptin i.p. and measuring food intake for the next 24 hours.  Higher leptin sensitivity results in a greater reduction in food intake.  As seen in the figures below, chow-fed rats (figure a, on the right) were more leptin resistant than KD rats (figure b, on the right). 

In fact, KD rats responded to 100 ug of leptin whereas it took almost 6 times more (2 mg/kg = ~600ug) to achieve a similar reduction in chow-fed rats.

One minor critique: the authors believed that a key novel finding of their study was that KD rats were more leptin sensitive despite being fatter… Given that adiposity was such a critical factor in their conclusion, they should have used something better than the worst way to measure fat mass.  Thus, a weak point of this study is that the validity of the conclusion (which is also in the title of the paper) is based on a notoriously inaccurate technique.

Interestingly, despite exhibiting resistance to peripherally administered leptin (above), chow-fed (below, figure a) rats were equally sensitive to KD rats (figure b) when leptin was centrally administered (i.c.v.):

The authors proceeded to speculate that leptin is less able to cross the blood-brain barrier in chow fed rats compared to KD.  It’s possible.  One theory on the mechanism of leptin resistance states that elevated triacylglycerols impair leptin’s ability to cross the BBB.  This is probably not true, as KD rats were more leptin sensitive despite having higher triacylglycerols.  $

One more minor critique, which I only mention because this issue arises frequently and is often ignored.  although I still don’t know what it means:

1)      If KD rats were significantly more sensitive to leptin, why was their 24h food consumption similar to chow-fed rats? (see saline injections in any of the figures above and here)

2)     Leptin levels in KD rats were significantly higher than those in chow-fed rats (8.65 vs. 2.99 ng/mL).  If they were indeed more leptin sensitive, then shouldn’t their food intake been lower than chow-fed rats?

3)      KD rats had significantly higher leptin levels (8.65 vs. 2.99 ng/mL).  So injecting KD rats with 100ug leptin increased their leptin from 8.65 ng/mL to 8.65 + X.  Whereas injecting chow rats with 100ug leptin increased their leptin from 2.99 to 2.99 + X.  Since “8.65 + X” will always be mathematically greater than “2.99 + X,” circulating leptin in the KD rats injected with 100ug of leptin should have been significantly greater than circulating leptin in chow-fed rats injected with 100ug leptin, so KD rats would have ingested less than chow-fed rats even if they were equally leptin sensitive. As such, I don’t think it’s proper to conclude, from those experiments alone, that KD rats were more leptin sensitive.  $$
3.5)  Is there a difference between endogenous and exogenous leptin?  I.e., is exogenous leptin stronger than endogenous leptin?  If so, this is very important.  Food for thought.


calories proper