Author Archives: Bill

LPL, insulin, and diet, Op. 62

There are many ways to address the etiology of obesity and insulin resistance (or insulin resistance and obesity).  For example, you can follow a group of healthy people for a long time and compare those who become insulin resistant with those who don’t; alternatively, you can study a population who is predisposed to insulin resistance (e.g., offspring of type II diabetics)… regarding the latter, although it’s kind of grim, apparently healthy children of obese or diabetic parents are often in an intermediate state of insulin resistance.  It’s impossible to exclude a genetic component, but I believe environmental influences are dominant: the poor diet and lifestyle of obese parents is just as likely as obesogenic DNA to be passed on to their children.

The main reason to be concerned with these questions is that there is considerable disagreement about the specific cause of obesity and insulin resistance; i.e., which came first and does one cause the other?  Or do they simply share a common cause (e.g., hyperinsulinemia)?   I currently lean toward the “common cause” hypothesis.  Alternatively, I’d say “it’s complicated”  … insulin resistance is not one isolated phenomenon, but the end result of many interconnected biological processes.  This has important implications for treatment and prevention- if, for example, hyperinsulinemia causes obesity and/or insulin resistance, then reducing insulin levels or preventing insulin spikes should be prioritized.  And mitochondria also seem to be important.

Regulation of mitochondrial biogenesis by lipoprotein lipase in muscle of insulin-resistant offspring of parents with type 2 diabetes (Morino et al., 2012 Diabetes)

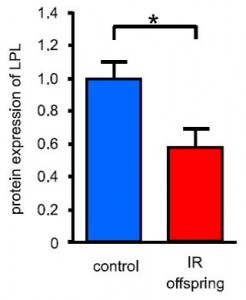
The subjects in this study were body weight and age-matched; the only major difference was impaired glucose tolerance and the presence of at least one diabetic parent in the “insulin-resistant offspring” group.  They took muscle biopsies and found, somewhat surprisingly, one of the biggest differences was the content of lipoprotein lipase (LPL).LPL is responsible for hydrolyzing circulating triacylglycerols (from chylomicrons and VLDL) to free fatty acids for tissue uptake.  Thus, this finding suggests muscle from insulin-resistant offspring is not as good at sequestering fatty acids (despite these subjects oftentimes having paradoxically higher intramuscular fat levels).  This corresponded with lower PPAR activity, mitochondria volume, and fatty acid oxidation.  And interestingly, in a set of follow-up cell culture experiments, they found that the fish oil fatty acid EPA (but not DHA) could correct this deficiency.
Ideally, we would like LPL activated in muscle (to take up and oxidize fatty acids) and inhibited in adipose (to prevent fat cells from getting fatter).  Fortunately, there are some relatively easy ways this can be accomplished… exercise selectively activates LPL in muscle and inhibits it in adipose, while insulin does the exact opposite.  So eat salmon, exercise, and avoid insulinogenic sugars and carb-rich foods!

Tissue-specific responses of lipoprotein lipase to dietary macronutrient composition as a predictor of weight gain over 4 years (Ferland et al., 2012 Obesity)

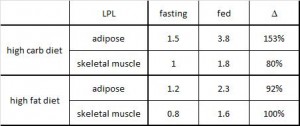
This study was a little more complicated than inferred by the title.  First, they took healthy adults, measured body composition and then assessed adipose vs. skeletal muscle LPL activity in the fasted and fed states after 2 weeks of a high fat or high carb diet.  To make a long story short:In lean subjects (table above), a high carb meal (after 2 weeks of high carb dieting) markedly increased adipose LPL by 153% (top row) (this is bad), and modestly increased it in skeletal muscle (80%, second row).  The high fat meal (after 2 weeks of high fat dieting) caused a smaller increase in adipose LPL (92% vs. 153%) and bigger increase in skeletal muscle LPL (80% vs. 100%) (this is good).  Thus, a high carb diet caused the most detrimental changes in adipose LPL while a high fat diet caused the most beneficial changes in skeletal muscle LPL.
Next, they compared these acute effects with changes in body composition over the course of 4 years and found that the biggest predictor of increased fat mass was the response of adipose LPL to a high carb diet.

The Morino study showed that increased skeletal muscle LPL was positively associated with insulin sensitivity, while the Ferland study showed that a high carb diet increased adipose LPL and this was positively associated with fat mass gain over 4 years.  Skeletal muscle LPL is good, adipose LPL is bad (Rx: EPA [salmon], exercise, and keep insulin levels low).

Dare I say “nutrient partitioning?”  this might be one way to reduce body fat without drastically cutting calories.  Adopt an LPL-modulating diet and lifestyle!  The effect on fat mass not huge, about a pound per year, but that adds up to 10 pounds over the course of a decade… obesity doesn’t happen overnight.


calories proper

Insulin per se

This recent manuscript nearly slid beneath the radar… almost stopped reading at the abstract until the word “nifedipine” appeared (among its widely pleiotropic effects, nifedipine also lowers insulin).

The series of experiments described below demonstrate one aspect of the scientific method reasonably well.  None of the individual experiments, when viewed in isolation, really prove the hypothesis.  But the researchers tested it with a variety of widely different methods and all of the results went in the same direction.  The hypothesis in question: insulin causes fat gain, and hyperinsulinemia per se, not macronutrients or calories, is the root cause.

This group has previously shown that sucrose is more detrimental than fish oil is beneficial toward obesity and glycemic control.

High glycemic index carbohydrates abrogate the anti-obesity effect of fish oil in mice (Hao et al., 2012 AJP)

Divide and conquer
Mouse study.  Lots of diets, in brief:
Pair fed: high fish oil (180 g/kg) plus 13%, 23%, 33%, and 43% sucrose (by weight, switched out for casein [a poor choice IMO])
High fish oil (180 g/kg) plus sucrose, fructose, glucose, low GI carbs, and high GI carbs.
That’s a lot of diets.  Kudos.

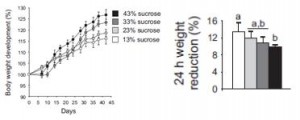
As expected, higher sugar and lower protein intakes enhance weight gain (yes, even when pair-fed similar calories [i.e., a calorie is not a calorie]) and this is at least partly due to reduced metabolic rate (as per the poor man’s energy expenditure test- measuring body weight before and after 24 hours starvation [higher weight loss = higher metabolic rate]):High sucrose-fed mice also had more inflamed adipose tissue and less thermogenic brown fat, which likely contributed to their glycemic dysregulation and elevated adiposity.

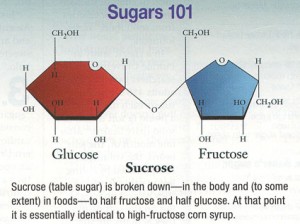
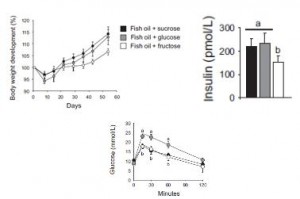
Sucrose is comprised of glucose and fructose, so to determine which component was causing obesity, they fed mice high fish oil diets plus either sucrose, glucose, or fructose.  Interestingly, the glucose group gained as much weight as the sucrose group.  Since the fructose group gained the least amount of weight, the researchers attributed the sucrose-induced obesity to insulin! (fructose doesn’t elicit an insulin response; and insulin levels were lowest in the fructose group).

Body weight, plasma insulin, and glucose tolerance:

I. Thus far: glucose and sucrose cause obesity by stimulating insulin secretion.  Glycemic deterioration is worst in the glucose-fed group because they were consuming most of the most insulinogenic sugar: glucose.  It was lower in the sucrose and fructose groups because sucrose contains only half as much glucose as pure glucose, and fructose contains no glucose.  IOW, these data suggest hyperinsulinemia per se causes obesity and insulin resistance.  Gravitas.

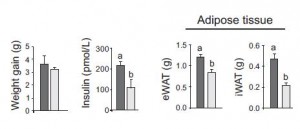
They further tested this by comparing high and low GI diets which cause higher and lower insulin levels, respectively.  As expected, the low GI diet led to less weight gain, and significantly lower insulin levels and adipose tissue accumulation compared to the high GI diet:

II. Thus far: high insulin levels, whether induced by glucose, sucrose, or high GI starch, lead to obesity.

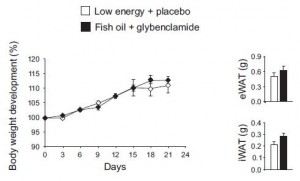
They next took a non-dietary approach by artificially increasing insulin levels with glybenclamide in fish oil-fed mice to see if hyperinsulinemia could still cause obesity.  The results weren’t robust, but the higher insulin levels tended to increase adiposity even in mice fed the anti-obesogenic fish oil diet. 

In the experiment, the opposite approach was taken: nifedipine was used to lower insulin.  The use of octreotide and diazoxide has been used in a similar context with similar results in humans, discussed HERE and HERE.Again, the results were not robust, but when viewed collectively a picture begins to emerge: raising insulin levels, whether it is with a high glucose or sucrose diet, a high GI diet, or glybenclamide increases adipose tissue growth; and conversely, lowering insulin levels, whether it is with a less insulinogenic sugar diet (fructose), a low GI diet, or nifedipine decreases adipose tissue growth.  Oh yeah, and low carb works too.


calories proper


Gluc-a-gone wild, Op. 60

optional pre-reading

Q. What happens to a type I diabetic when you 1) withhold insulin, 2) provide insulin, or 3) withhold insulin and suppress glucagon?  (Charlton and Nair, 1998 Diabetes)…

A. You learn glucagon is the bad guy.

Divide and conquer

Zero insulin makes you hyperglucagonemic, hyperglycemic, and ketoacidotic (see first column).  Insulin cures all of these things (second column), but they aren’t caused by insulin deficiency, per se… they’re caused by high glucagon, which itself is cured by insulin (second column) and SRIH (somatostatin, third column).  Cure the hyperglycemia by inhibiting glucagon and pathological diabetic ketoacidosis suddenly becomes physiological ketosis.

Uncontrolled diabetes also wastes muscle:Zero insulin makes you hypermetabolic and increases amino acid oxidation.  Insulin cures this, but again, it appears to be driven by hyperglucagonemia, not insulin deficiency.

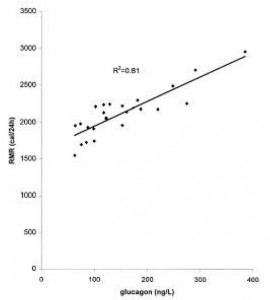
Glucagon directly correlates with energy expenditure, and this isn’t the good metabolic rate boost sought by dieters, it’s the type that indiscriminately burns everything including muscle.  High protein diets also increase energy expenditure, but in pathological hyperglucagonemia, the amino acids come from muscle, not food.

The above mentioned study is most relevant to type I diabetes.  The following study is about glucagon and the far more common type II diabetes (Petersen and Sullivan, 2001 Diabetologia).

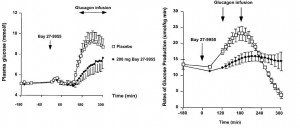
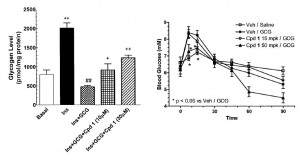
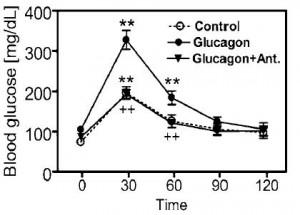
The effects of hyperglucagonemia can be blunted by glucagon receptor antagonists (GRAs).  In the figure below, a GRA (Bay-27-9955), was administered immediately prior to a glucagon infusion.  The GRA significantly reduced blood glucose levels, an effect largely attributed to the reduction in endogenous glucose production:One of the ways GRA’s accomplish this is by keeping glucose tied up in hepatic glycogen instead of flooding into the plasma (Qureshi et al., 2004 Diabetes; “CPD” is the GRA used in this study).  The figure on the left is primary human hepatocytes; on the left is in mice.Another way of looking at this is in mice chronically treated with glucagon or glucagon plus a GRA.  Glucose tolerance is obviously deteriorated by glucagon treatment, but is completely restored by a GRA (Li et al., 2008 Clinical Science):

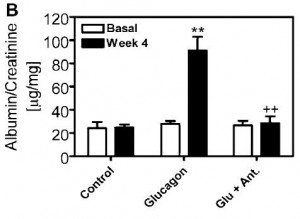
One of the most severe side effects of diabetic hyperglycemia is nephropathy, which is similarly cured by GRA treatment:

The physiological role of glucagon is to prevent hypOglycemia; but hypERglycemia is the problem most of the time.  Don’t get me wrong, hypOglycemia can be deadly, but 1) it’s not nearly as prevalent as hypERglycemia, and 2) inhibiting glucagon doesn’t cause hypoglycemia, there are a battery of counterregulatory hormones that prevent hypoglycemia.

Furthermore, reducing glucagon action isn’t limited to glucagon receptor antagonists (GRAs), leptin and amylin can do it too!

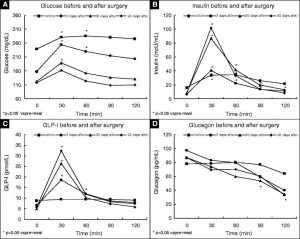
And while gastric bypass surgery is easily more extreme than GRA’s and leptin or amylin therapy, it’s magical effect on diabetes remission might also be partly attributed to glucagon suppression (Umeda et al., 2011 Obesity Surgery):

Convinced yet?


calories proper

Leptin and insulin: resistance is futile, Op. 59

The biochemical similarities between resistance to the metabolic effects of leptin and insulin are ultra-complicated.  The studies discussed below suggest leptin sensitization is a pre-requisite for glycemic improvement and weight loss.  Similarly, low leptin levels (independent of fat mass) appear to be linked with high insulin sensitivity and the ability to lose weight.  “Low leptin” in this context (i.e., independent of fat mass) does not refer to the starvation-induced rapid decline of leptin or the complete absence of leptin, but rather to a high degree of leptin sensitivity (analogous to insulin sensitivity?).  The level at which this signal is mediated, however, remains to be determined (adipocyte? sympathetic nervous system? brain? in the Electric Kool-Aid?).

Is the resistance to high levels of endogenous leptin in established obesity similar to the effects (or lack thereof) of exogenously administered metreleptin?

Divide and conquer

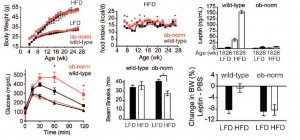
My current hypothesis: 1) leptin sensitivity needs to be high and 2) leptin levels need to be adequate (too low and leptin sensitivity is meaningless; too high and you become leptin resistant).  This is summarized nicely in this clever little experiment (Knight et al., 2010 PLoS ONE).  Ob/ob mice genetically lack leptin.  Zero leptin, and monstrously obese (the mouse on the right).  If you add back the amount of leptin found in a lean insulin sensitive mouse (~5 ng/mL), they gain just as much weight on any diet as normal mice (and much less than untreated ob/ob mice [the mouse on the right]).  But here’s the catch: on a high fat diet, treated ob/ob mice gain as much weight (top row, left figure) despite much lower leptin levels (top row, right figure).

Ob-norm mice are phenomenally leptin sensitive (bottom right), but do not have enough leptin to support insulin sensitivity (bottom left) or physical activity (bottom middle figure).  If leptin levels are too high (wild-type mice on high-fat diet), on comes leptin resistance (bottom right) and glucose intolerance (bottom left).  This picture is incomplete but good enough to support the claim that leptin sensitivity needs to be high and leptin levels need to be adequate.

Insulin-resistant patients with type 2 diabetes mellitus have higher serum leptin levels independently of body fat mass (Fischer et al., 2002 Acta Diabetologia)

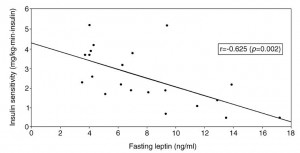
Higher insulin sensitivity in those with the lowest leptin levels (this group is probably the most leptin sensitive):The most insulin sensitive group (Tertile 3) has the lowest leptin levels but also the lowest body fat (i.e., it could be confounded by fat mass)

But the middle group is more insulin sensitive than the lowest group (by definition), and has lower leptin levels despite being fatter.  So it’s definitely not confounded by fat mass, and I think this is because they are more leptin sensitive.

Differential effects of gastric bypass and banding on circulating gut hormones and leptin levels (Korner et al., 2006 Obesity)  

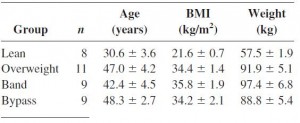
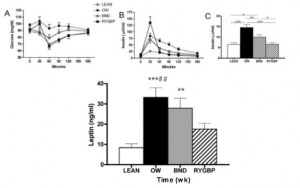
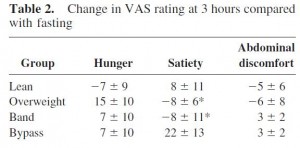
Still not confounded by weight loss because the banded group weighed more but had lower leptin and higher insulin sensitivity than the overweight group.  In support of enhanced leptin sensitivity in the gastric bypass group, they experienced a significantly greater increase in post-meal satiety than the other groups.  Similarly, the overweight group (who have much higher leptin levels) actually experienced a decline in satiety after eating!

Now we’re getting somewhere!

Amylin improves the effect of leptin on insulin sensitivity in leptin-resistant diet-induced obese mice (Kusakabe et al., 2012 AJP)

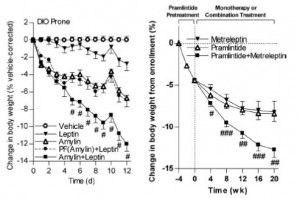
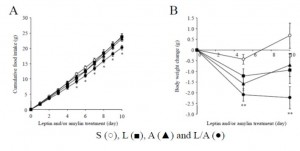
Injection with leptin (squares) or amylin (triangles) alone does not reduce food intake or body weight in leptin-resistant diet-induced obese mice (open circles), but a combination of leptin and amylin does both (closed circles).Importantly, as seen in the figure below, neither leptin nor amylin alone improves glycemia.  Theoretically, this is because leptin sensitization is required to improve insulin sensitivity.  And amylin improves leptin but not insulin sensitivity.  The far right column in the right graph shows that the leptin-amylin co-treated group were more insulin sensitive.

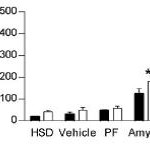
Leptin sensitization is required to improve insulin sensitivity.  So why didn’t amylin alone improve the sensitivity to endogenous leptin? … perhaps because leptin sensitivity was high but leptin levels were inadequate.  Amylin-alone also lowered endogenous leptin levels, which may have counterbalanced the improved leptin sensitivity (top row, compare the first and third columns):In other words, the leptin-resistant mice could be artificially made more sensitive to their own endogenous 28.5 ng/mL of leptin with 100 ug/kg/d amylin, but not to their lower 19.7 ng/mL of leptin (in this study).

In rats, however, 100 ug/kg/d amylin is capable of endogenous leptin sensitization despite similar reductions in endogenous leptin (Roth et al., 2008 PNAS):This graph is showing a proxy for leptin sensitivity in rat brain.  The black bars are vehicle-treated, the white bars are leptin-treated.  Amylin-alone increased sensitivity to both endogenous leptin (second to the last bar) and exogenous leptin (last bar).  And indeed, amylin-alone (open triangles in the figure below) reduced body weight; the addition of exogenous leptin further reduced body weight (compare inverted triangles [leptin alone] to squares [leptin plus amylin]).

Similar results are obtained in humans (figure on the right).

The intermediate effects in mice illustrate an important point.  Amylin-induced sensitization to endogenous leptin, as seen in rats and humans but not mice, is required to reap the full benefits of leptin re-sensitivation.  This didn’t occur in mice, but occurred in all species (including mice) when exogenous leptin was administered to restore leptin to an adequate level.

In sum, restoration of leptin sensitivity is required for glycemic improvement and weight loss regardless of whether it is achieved by gastric bypass (Korner study, above), amylin treatment (Kusakabe study in mice; Roth study in rats and humans), a sugar-free diet (Shapiro study, discussed HERE), or a low-carbohydrate diet (Brehm et al., 2003 JCEM – greater weight loss and glycemic improvement despite eating more calories [associated with lower leptin levels]).  Personally, I’d attempt either of the latter prior to gastric bypass or pharmacological therapy with an experimental cocktail of metreleptin and pramlintide.  But that’s just me.

Just like insulin, you gotta get leptin levels down, not up, to see benefits.

calories proper

the metabolic orchestra

What’s on YOUR plate?

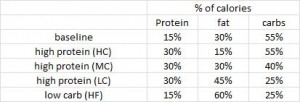
whenever something goes up, something else goes down.  e.g., compare the fat and carbs in the three 30% protein diets:

It is virtually impossible to study macronutrients in isolation, but by looking collectively at a wide range of diet intervention trials, we can get some insight into the metabolic program orchestrated by fat, protein, and carbohydrates.

the “bar:” if we are to conclude that increasing nutrient “A” causes effect #1, then it must be true if the calories are compensated by 1) lowering nutrient “B” while leaving nutrient “C” unchanged, and 2) lowering “C” while keeping “B” unchanged.  And it doesn’t count if this is accomplished indirectly by abstract statistics.

Divide and conquer

Comparison of high-fat and high-protein diets with a high-carbohydrate diet in insulin-resistant obese women (McAuley et al., 2005 Diabetologia)  

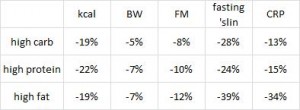
To make a very long story very short, here’s what happened after 24 weeks:

Abbreviations I: kcal, food intake in calories; BW, body weight; FFM, fat-free mass (muscle); FM, fat mass; ‘slin, insulin; CRP, C-reactive protein

Abbreviations II: HC, high carb; HP, high protein; HF, high fat

Abbreviations III: LC, low carb; LP, low protein; LF, low fat

Despite similar calorie reductions, HF lost more BW and FM than HC (HP was intermediate).  Fasting insulin was reduced most in HF and this group lost the most fat.  Anyone as surprised as me about the dramatic reduction in CRP in the HF group?  (+2 for HF)  Fasting insulin was reduced the least by HP but HP lost more fat than the HC.  You might think this undermines the insulin-fat theory, but alas, draw your attention to the kcal’s.  Perhaps the bigger reduction in calories in HP helped them shed a little more fat than HC despite a lower reduction in insulin. Furthermore, HF lowered insulin more and they lost more fat but had the same caloric deficit as HC.

But does it meet the “bar?” IOW, are these results due to the abundance of dietary fat or the lack of carbs?

Alternatively, is HC inferior because of the low fat content or the high carb content?  To address this, we need to compare two diets with similar fat but different carbs.

Effect of an energy-restricted, high-protein, low-fat diet relative to a conventional high-carbohydrate, low-fat diet on weight loss, body composition, nutritional status, and markers of cardiovascular health in obese women (Noakes et al., 2005 AJCN)

This study was half as long (12 weeks vs. 24 weeks), but compensated by a more robust calorie deficit 

Both groups were supposed to undergo an identical degree of calorie restriction, but HP lost slightly more weight despite eating slightly more food than HC.  HP also lost more fat and their insulin was more suppressed.  And importantly, HP lost less muscle than HC.  (and wow, check out those CRP data [+2 for HP]).  This was all confirmed in a much larger year-long study comparing two 30% fat diets, HP vs. HC, with nearly identical results (Due et al., 2004 International Journal of Obesity)

Summary thus far:

McAuley (first study; three moderate protein diets: fat vs. carb)
high fat is superior to high carb     or     low carb is superior to low fat

Noakes (second study; two low fat diets: protein vs. carb)
high protein is superior to high carb     or     low carb is superior to low protein

To bring this around full circle: both HF and HP independently beat HC, so what do you think would happen in a face-off between HF and HP?

Carbohydrate-restricted diets high in either monounsaturated fat or protein are equally effective at promoting fat loss and improving blood lipids (Luscombe-Marsh et al., 2005 AJCN)  

This study was of intermediate duration (16 weeks) but had the greatest weight loss:

HF vs. HP?  It’s a tie!!  Insulin was reduced more by HP and fat mass declined ever so slightly more in this group, but the difference was very small.  When the data were broken down by genders, women did retain more muscle on HP but again, the difference was small.

Luscombe-Marsh (third study; two low carb diets: protein vs. fat)
high protein is equal to high fat     or     low protein is probably just as bad as low fat

So if anyone tries to quiz you about diets and weight loss, like the way my colleagues relentlessly do to me whenever a new diet study is published, armed with this knowledge you should be able to guess the outcome (probably)…

I know what you’re thinking… what if they try to trick me, like comparing the effects of HP to high fiber??  Fiber is supposed to be good for you, green leafy vegetables and all, right?

Just stick to the data outlined above.

Comparison of high protein and high fiber weight-loss diets in women with risk factors for the metabolic syndrome: a randomized trial (Morenga et al., 2011 Nutrition Journal)  

With the exception that the high fiber group was getting 39 grams of fiber per day while HP was only getting 24 grams.

This was the shortest study (8 weeks) and accordingly weight loss was the least.

Victory!  despite a significantly lower reduction in calorie intake, HP lost more weight than high fiber.  HP also lost less muscle, more fat, and insulin declined to a greater degree.

Morenga (fourth study, two mixed diets: protein vs. fiber)
higher protein, higher fat, and lower carbs are superior to high fiber

just don’t gamble with this information


calories proper

USDA vs. nutrition, round II

The school lunch program is screwed.

First the USDA modifies the definition of a vegetable to include pizza.  Now they significantly altered their standards for school lunches to include fewer healthy foods and more USDA-approved ones (see report at the USDA’s website).  In brief, this move further reduces the nutrition of school lunches and will likely do more harm than good.  Here’s why:

In this cross-sectional Swedish study, parents recorded 7-day food diaries for their 4-year old children who then went in for a regular checkup.

Metabolic markers in relation to nutrition and growth in healthy 4-y-old children in Sweden (Garemo et al., 2006 AJCN)

On a 1,400 kcalorie diet, these children were consuming roughly 15% protein, 33% fat, and 52% carbs (about 20% of which came from sucrose).  That seems like a lot of calories, but besides playing all day, 4 year old children are also growing at an incredible rate.

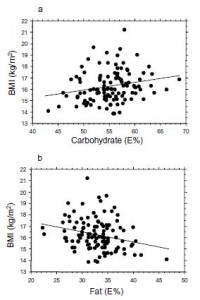
Interesting finding numbers 1 & 2:  Children who got most of their calories from fat had the lowest BMI (i.e., they were the leanest), and the opposite was observed for carbs.

When divided into groups of normal weight vs. overweight and obese, some interesting and non-intuitive patterns emerged.  For example, lean kids don’t eat less food; but they do eat fewer carbs and less sucrose (and make up the difference by eating more fat and saturated fat).

Some of the weaker correlations showed:
-total calorie intake was associated with growth (logical)
-total carbohydrate intake was associated with increased fat mass (unfortunate yet also logical)
-total fat intake was associated with decreased fat mass (interesting)

And those who ate the most saturated fat had the least amount of excess body fat. (more on this below)

Fortunately, in a young child, a poor diet hasn’t had enough time to significantly impact their metabolic health; as such no macronutrient was associated, either positively or negatively, with insulin resistance [yet].

In a more appropriately titled follow-up, Swedish pre-school children eat too much junk food and sucrose (Garemo et al., 2007 Acta Paediatrica), Garemo reported that most of their carbs came from bread, cakes, and cookies, while most of the sucrose came from fruit, juices, jam, soft drinks, and sweets.  And WOW, go figure- most of the fat came from meat, chicken, sausage, liver, eggs, and dairy; NOT vegetable oils.

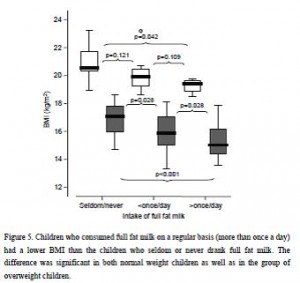
And in a mammoth dissertation, Eriksson (2009) confirmed many of these findings in a larger cohort of 8-year old Swedish children and had this to say about dairy fat:

The open boxes represent overweight kids, the closed boxes are lean kids.  Going from left to right, in either the open or closed boxes, BMI declines with increasing intake of full fat milk (perhaps parents should reconsider skim milk?).  Eriksson also confirmed that saturated fat intake was strongly associated with reduced body weight.  Interestingly, she mentioned that food intake patterns are established early in life, so it might be prudent to remove sugars and other nutrient poor carb-rich foods, and introduce nutritious whole foods as early as possible.  I’m not exactly sure how she assessed patterns of food intake establishment, but it seems logical.  Especially in light of the following study… we’ve seen 4 year olds, 8 year olds, and now we have 12-19 year olds.  The relationship between diet and health is consistent across all age groups.

Virtually all of the above data in Swedish children seem to suggest dietary saturated fat, whether it’s from beef, sausage, eggs, whole fat dairy, or liver (i.e., WHOLE food sources; NOT hydrogenated vegetable oils), is associated with reduced fat mass.  Metabolic abnormalities were not present, probably because the children were simply too young (although body weight seems to respond relatively quickly, other downstream effects of poor nutrition take years to accumulate before symptoms develop).

An American study about nutrient density and metabolic syndrome was recently published.  These kids were exposed to poor nutrition for just long enough to experience some of those malevolent effects.

Dietary fiber and nutrient density are inversely associated with the metabolic syndrome in US adolescents (Carlson et al., 2011 Journal of the American Dietetic Association)

The figure below divides fiber (a proxy for good nutrition; i.e., leafy vegetables, beans, etc.) and saturated fat into groups of least and most amounts comsumed. The lowest fiber intake was 2.9 grams for every 1,000 kcal, and 9.3% of these kids already had metabolic syndrome; the highest fiber intake was 10.7 grams / 1,000 kcal and 3.2% had metabolic syndrome.  Thus, consuming a fiber-rich [nutrient dense] diet is associated with a significantly reduced risk of metabolic syndrome.

The next rows are saturated fat.  The lowest saturated fat intake was 6.9 grams / 1,000 kcal and 7.2% had metabolic syndrome; the highest saturated fat intake was 18 grams / 1,000 kcal and 6.7% had metabolic syndrome…. huh?  While it didn’t reach statistical significance, the trend for saturated fat paralleled that of a “nutrient dense” diet.  Is it possible that saturated fat might be part of a nutrient dense diet?   if saturated fat comes in the form of red meat, liver, eggs, etc., then yes, it is part of a nutrient dense diet.  This conclusion evaded both the study authors and the media.

In 4 and 8 year old Swedish children, those who ate the most saturated fat had the least excess fat mass.  In 12 – 19 year old American adolescents, those who ate the most saturated fat had the lowest risk for metabolic syndrome.

Is it too much of a stretch to connect these ideas by saying that in the short run, a low saturated fat (nutrient poor, carb-rich) diet predisposes to obesity; and in the long run it predisposes to metabolic syndrome  ???

Collectively, these data suggest a diet based on whole foods like meat and eggs, including animal fats, with nutrient dense sources of fiber (e.g., leafy vegetables) but without a lot of nutrient poor carb-rich or high sugar foods, may be the healthiest diet for children.  

Flashback: recap of “USDA vs. nutrition, round I”
USDA: 1
Nutrition: 0
They made pizza a vegetable and insiders suspect that next they’ll try to make it a vitamin.

USDA vs. nutrition, round II

USDA: replacing normal milk with low fat milk
nutrition: full-fat milk was associated with lower BMI in both lean and obese children (see the Eriksson figure above)

USDA: increasing nutrient poor carb-rich options
nutrition: this was associated with increased fat mass in children (Garumen et al., see figures above)

USDA: reducing saturated fat as much as possible
nutrition: reduced saturated fat was associated with excess fat mass in children and metabolic syndrome in adolescents.

Such changes will have an immeasurable long-term impact if children grow up thinking these are healthy options.  Finally, this blog post does not contain a comprehensive analysis of saturated fat intake and health outcomes in children, but the USDA’s new regulations should have been accompanied by one.  In other words, these regulations should not have been based on the studies discussed above, but the studies discussed above should have been considered when the USDA was crafting their recommendations.  Obviously, they weren’t.

calories proper
another side of leptin

Op. 56

Leptin is probably just as important as insulin WRT obesity, and this is as just as good a place as any to learn about this increasingly interesting hormone.

ABCs of Leptin in a nutshell:

A. Fed state: leptin is secreted from adipose and tells the brain to maintain food intake and energy expenditure at a body weight set point, which is likely established by diet.

B. Fasted state: leptin secretion declines, causing hunger to go up and energy expenditure to go down.

In the past, the cause and consequence of leptin resistance received a lot of my attention due to their importance in obesity.  Leptin resistance is, in brief, obesity.  Or the mouse on the right:

C. Obesity: eating a poor diet causes leptin resistance, which allows the body weight set point to rise until your fat cells stop responding to insulin (it’s kind of complicated)

But there’s another side of leptin that is mostly unknown, frequently overlooked, and poorly understood.  And I say this “is as just as good a place as any” to learn about it because while this side of leptin isn’t as popular as the energy expenditure, appetite, etc., stuff, it could very well be just as important, IMHO.

Leptin vs. the pathological hyperglycemia in diabetic state(s) (note the plural form of “state[s]”).

Leptin deficiency causes insulin resistance induced by uncontrolled diabetes (German, Morton, et al., 2011 Diabetes)

Divide and conquer

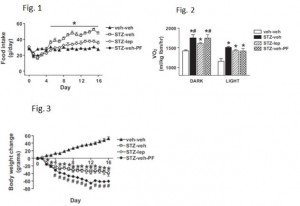
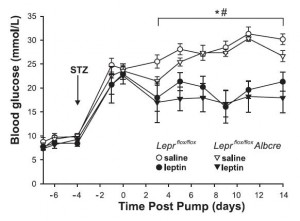
STZ is a beta-cell toxin used to induce diabetes.  STZ-treated mice have low insulin, low leptin, and lose weight despite a voracious appetite (just like type 1 diabetic humans).  Their insulin resistance is fully corrected while their marked hyperglycemia is attenuated by leptin injections.  Leptin reduces food intake but this doesn’t reduce body weight because energy expenditure paradoxically declines (discussed below).  Furthermore, diabetic mice restricted to eat only as much as leptin-treated diabetic mice (STZ-veh-PF)  lose significantly more weight because they lack the leptin-induced suppression in energy expenditure.

Summary of energy balance:

Control mice (veh-veh) eat the least but have much lower energy expenditure, causing them to weigh the most.  Energy expenditure is the more important variable driving high body weight in these animals (it goes down significantly more than food intake).  Diabetic mice (STZ-veh) eat the most food which is balanced by high energy expenditure (explained below), causing an intermediate body weight.  When the voracious appetite of diabetic mice is restrained (STZ-veh-PF), they weigh the least (they are starving).  Food intake is the more important variable driving low body weight in diabetic mice (energy expenditure is the same in diabetic and diabetic-PF mice).  STZ-leptin mice have intermediate food intake, energy expenditure, and body weight.  All is well, leptin cures the deranged energy balance of type I diabetes.

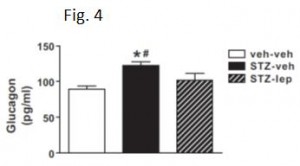
As mentioned above, diabetic mice eat more but weigh less because of drastically increased energy expenditure.  Energy expenditure is increased, in part, due to out-of-control gluconeogenesis (from hyperglucagonemia).  The paradoxical effects of leptin on energy expenditure (increases it in post-obese subjects but decreases it in diabetic mice) may be explained by leptin-induced reduction of this out-of-control gluconeogenesis, mediated via normalization of glucagon.

The authors further demonstrated that leptin restores liver, but not muscle or adipose insulin sensitivity in diabetic mice, independent of food intake.

Thus, insulin-deficiency -> dec. leptin -> inc. glucagon -> inc. hepatic glucose output -> hyperglycemia

Insulin’s primarily role might be to suppress glucagon.  STZ-induced “relative” state of starvation causes leptin to plummet; in the basal state, leptin may not have anything to do with glucagon because insulin keeps it under control.  But in diabetes, there’s no insulin to suppress glucagon; this is where exogenous leptin struts its stuff.

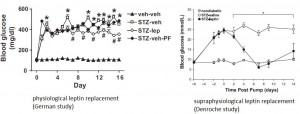
Collectively, these data further support the conclusion that insulin’s major function is to suppress glucagon, as opposed to other effects in skeletal muscle or adipose.  It’s been almost a year since Unger’s notorious publication which showed that glucagon receptor knockout mice were immune to type 1 diabetes (discussed here).  Diabetic hyperglycemia is partially mediated by insulin resistance, and largely mediated by hyperglucagonemia.  But why wasn’t hyperglycemia completely normalized by leptin replacement therapy?   These researchers sought simply to normalize leptin levels, but what would’ve happened if they provided a supraphysiological dose of leptin?  During physiological leptin replacement therapy, glucagon levels were normalized, but a hint of hyperglycemia remained.  Some other [leptin resistant?] member(s) of glucagon’s nefarious cohort must be responsible for the residual diabetic hyperglycemia…

Fortunately for us, the effects of supraphysiological leptin were tested in an identical experimental paradigm:

Leptin therapy reverses hyperglycemia in mice with streptozotocin-induced diabetes, independent of hepatic leptin signaling (Denroche, Kieffer, et al., 2011 Diabetes)

Indeed, supraphysiological leptin therapy overcame whatever diabetic “leptin resistance” remained and totally cured hyperglycemia.

This study repeated much of what was done in the first study, but whereas the first study added that leptin’s effect on food intake was not involved, this study showed that hepatic leptin signaling was not responsible either:

In both cases, hyperglucagonemia appears to be a major cause of diabetic hyperglycemia, and this is cured by leptin.  Insulin sensitivity was only partially restored by physiological leptin replacement; this seems to be due to some sort of apparent “leptin resistance,” which is overcome by supraphysiological leptin.  Diabetic insulin resistance is most likely caused by hyperglucagonemia-induced increased hepatic glucose output, and this is cured by leptin’s [non-hepatic] effects on reducing glucagon levels.  Diabetic insulin resistance may be partially caused by a brain mechanism, but at least one brain mechanism (food intake) was ruled out by the German study.

And oh so interestingly, all of these effects were mimicked by leptin administration directly into the brain, at a dose which caused no change in peripheral leptin levels (German, Morton, et al., 2011 Endocrinology).  The “STZ-lep” in the figure below refers to diabetic mice with leptin administered directly into the brain.

Back to the plural form of diabetic “state[s]” mentioned in the intro.  All of the above studies were in insulin-deficient SKINNY type 1 diabetic mice.  The next study is in OBESE type 2 diabetic rats.

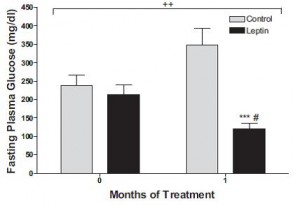
Subcutaneous administration of leptin normalizes fasting plasma glucose in obese type 2 diabetic UCD-T2DM rats (Cummings, Havel, et al., 2011 PNAS)  

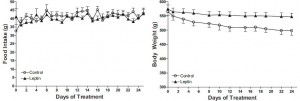
N.B. the control rats in this study were pair-fed to the leptin treated animals to control for the leptin-induced satiation.  Leptin-treated mice lost less weight most likely because energy expenditure declined (just like in the first study mentioned above).

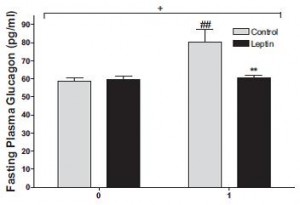
In agreement with the glucose normalization seen by leptin treatment in skinny type 1 diabetic animals, leptin reduced glucose levels in obese type 2 diabetic rats, and this too was associated with reduced glucagon levels:

In type 1 diabetic animals, there are very low insulin levels regardless of food intake, leptin treatment, and hepatic leptin signaling.  Thus, insulin has nothing to do with the effects of leptin in type 1 diabetes.  This study showed that insulin levels also have nothing to do with the effects of leptin in obese type 2 diabetes:

So while the efficacy of exogenous leptin administration in established obesity is questionable, it is capable of combating the pathological glucagon-induced hyperglycemia which is responsible for much of the damage incurred by the diabetic state[s].

Leptin, glucagon, and diabetes.


calories proper
Insulin, the nutrient anti-partitioner.

Insulin is a double-edged sword with a pointy tip” discussed the relationship between insulin and visceral fat.  In brief, any dietary intervention which lowered insulin concomitantly reduced visceral fat, and this was accompanied by a variety of health improvements.  Today’s post focuses more on the connection between insulin and body composition.  Current hypothesis: reducing insulin causes weight loss, and this weight is primarily adipose (muscle is spared).  IOW, insulin plays a primary [cause], as opposed to secondary [effect] role in regulating fat mass.  FYI the alternative hypothesis states that reduced insulin levels are simply one of the many beneficial effects of weight loss.

Exhibit A: lower insulin is correlated with more fat loss

1. Diet-induced reduction in insulin

A. Glycemic load 

Long-term effects of 2 energy-restricted diets differing in glycemic load on dietary adherence, body composition, and metabolism in CALERIE: a 1-y randomized controlled trial (Das et al., AJCN 2007)

In this year-long study, the low glycemic load (GL) diet reduced insulin levels to a greater degree than the high GL diet (-21.2% vs. -18%), and this resulted in more total fat loss (-26.1% vs. -23.5%), and a greater proportion of the total amount of weight lost was comprised of fat (92% vs. 81%).  The differences were small, but probably not due to chance given the consistency and specificity of this effect (see below).

B.  Calories vs. carbs

The role of energy expenditure in the differential weight loss in obese women on low-fat and low-carbohydrate diets (Brehm et al., 2005 JCEM)

In this 4 month-long study, the low-carb diet lowered insulin over twice as much as the low-fat diet (-36.8% vs. -13.6%), which resulted in significantly more total fat loss (-6.7% vs. -3.8%), and a greater proportion of the total weight lost was comprised of fat (92% vs. 81%).  The absolute differences between studies (comparing these results directly to the above results) are big, but this is not unexpected because each study has markedly different 1) patient populations, 2) study durations, and 3) interventions.

2. Exercise-induced reduction in insulin

Reduction in obesity and related comorbid conditions after diet-induced weight loss or exercise-induced weight loss in men (Ross et al., 2000 Annals of Internal Medicine)

In this rather complicated 3 month-long study, the exercise group lost weight, and this was compared to a group who lost a similar amount of weight by diet alone.  The diet-alone group functioned as a control for the negative energy balance.  Exercise lowered insulin levels more than diet alone (-41.4% vs. -17.9%), which resulted in more fat loss (-18.4% vs. -16.9%), and a greater proportion of the total weight lost was comprised of fat compared to diet alone (81.3% vs. 64.9%).  If a greater proportion of the total weight lost was comprised of fat, then the intervention selectively spared lean mass resulting in a more favorable body composition; this occurs consistently in every study mentioned in this post.

Exhibit B: pharmacologically lowering insulin causes fat loss

1. Diazoxide

Beneficial effect of diazoxide in obese hyperinsulinemic adults (Alemzadeh et al., 1998 JCEM)

Diazoxide directly targets the pancreatic beta-cells to reduce glucose-stimulated insulin secretion.  In this 2 month-long study, diazoxide combined with a low-calorie diet reduced insulin levels more than diet alone (-35.7% vs. -14.7%), which resulted in more fat loss (-19.8% vs. -6.8%), and a significantly greater amount of the total weight lost was comprised of fat compared to diet alone (95% vs. 72%).

2. Octreotide

Efficacy of octreotide-LAR in dieting women with abdominal obesity and polycystic ovary syndrome (Gambineri et al., 2005 JCEM)

Octreotide is a somatostatin analogue which suppresses, among other things, insulin secretion.  In this 7 month-long study, octreotide combined with a low calorie diet reduced insulin levels more than diet alone, which resulted in more fat loss (-6.4% vs. -2.4%), and a greater proportion of the total weight lost was comprised of fat.

Exhibit C: insulin increases fat mass

The previous data supported the hypothesis that lowering insulin, by multiple completely different mechanisms, results in reduced fat mass.  The next evidence argues against the opposite hypothesis and supports a direct role for insulin in increasing fat mass.

Causes of weight gain during insulin therapy with and without metformin in patients with type II diabetes mellitus (Makimattila et al., 1999 Diabetologia)

In this year-long study, diabetic hyperglycemia was treated with insulin alone or insulin combined with metformin.  All subjects in this study gained weight and fat mass.  The addition of metformin to insulin therapy blunted the increase in insulin levels (30.8% vs. 45.5%), which reduced fat gain (11.6% vs. 22.1%), and only 73.7% of the weight gained was fat compared to 91.8% by insulin alone.

Administration of exogenous insulin increases fat mass.   Reducing insulin, by a variety of means, burns fat and spares lean mass.

calories proper
Affiliate links: It’s 2018, join Binance and get some damn cryptoassets or download Honeyminer and get some Bitcoins for free!

Still looking for a pair of hot blue blockers? Carbonshade and TrueDark are offering 15% off with the coupon code LAGAKOS and Spectra479 is offering 15% off HEREIf you have no idea what I’m talking about, read this then this.

20% off some delish stocks and broths from Kettle and Fire HERE

If you want the benefits of  ‘shrooms but don’t like eating them, Real Mushrooms makes great extracts. 10% off with coupon code LAGAKOS. I recommend Lion’s Mane for the brain and Reishi for everything else

Start your OWN Patreon campaign!

Join Earn.com with this link and get paid to answer questions online.

calories proper
 

Become a Patron!


Holiday feasts, the freshman 15, and damage control

Holiday feasts, the freshman 15, and damage control, Op. 54

overeating ANYthing is a bad idea.  But as demonstrated in this recent study, WHAT you overeat has a big effect on how your body responds.  The overfeeding protocol studied was pretty intense, ~1000 excess kilocalories per day for 8 weeks.

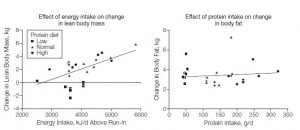
Effect of dietary protein content on weight gain, energy expenditure, and body composition during overeating (Bray et al., 2011 JAMA) Healthy people where fed hypercaloric low, medium, or high protein diets.  It’s impossible to isocalorically change one macronutrient without inadvertently changing the others.  With regard to study design, this is always a tough decision, and in this study they exchanged protein for fat:

Divide and conquer

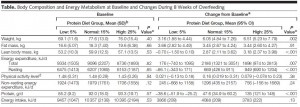
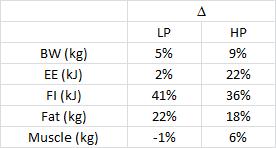
As seen in the monster-table above or simplified table below, the high protein group gained the most weight despite eating no more than the other groups; but this weight was comprised of significantly more lean body mass than in any other group. 

High protein dieters also expended more energy but still gained more weight!  Importantly, however, much of that weight was muscle.  The increase in energy expenditure is likely due to dietary protein-specific effects: 1) high metabolic cost of increased protein turnover, 2) elevated metabolic rate associated with more muscle, and 3) increased diet-induced thermogenesis.  The low protein group, on the other hand, lost muscle and gained more fat than any other group.

an aside: the energy expenditure measurements taken during overfeeding should be taken with a grain of salt, shot of tequila, and suck of a lemon because the accuracy of such measurements usually require weight-stable conditions; overfed subjects were gaining weight and in positive energy balance.  In other words, the assumptions required for doubly-labeled water to assess energy expenditure during weight-stable conditions are likely not met during weight gain (which is further complicated by the fact that the different groups were gaining different types of body weight [fat vs. fat-free mass]).  But the body composition data are probably OK (see below).

Furthermore, while it may seem like the Laws of Energy Balance were violated in this study, I assure you, they were not.  This study was not designed to test them, as evidenced by the author’s failure to conduct a comprehensive assessment of energy balance.

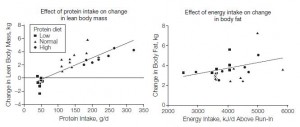
The high monetary cost of high protein foods (e.g., steak) is matched by the high energetic cost of their assimilation.  By increasing protein intake, energy expenditure rises in parallel.  This is most likely due to a combination of factors (mentioned above), and the result, at least in this study, is increased lean body mass.   The low protein diet, on the other hand, didn’t increase energy expenditure and resulted in more fat gain.  N.B. the absolute amount of protein consumed by the low protein group (47 grams) was too low to maintain muscle despite ingesting 40% more total calories.  In other words, the low protein dieters actually lost muscle mass while gaining fat!!

conclusions

1. THE media always screws up things (no thanks to Dr. Bray’s discussion).  The headlines should’ve read: “Dietary protein increases lean body mass more than total calories increase fat mass.”  That headline would’ve taken the focus away from the calorie debate by highlighting an important macronutrient effect.  This is important, IMHO, because body composition is a very important factor determining metabolic outcomes and quality of life, and is often overlooked (e.g., BMI).

2. While excess calories are necessary to increase lean body mass, excess protein has little effect on fat mass.  “Excess protein has little effect on fat mass” would’ve been another great headline.  But it wasn’t.

Most of the excess energy consumed by the low protein dieters was stored as fat, while in the high protein dieters it was invested in muscle and burned off.  Although it’s a little too late to prevent holiday feast-induced weight gain (or the freshman 15 for that matter) these data suggest that whenever possible, filling up on the highest protein foods available will cause the least fat gain.  Increased dietary protein -> increased lean body mass –> increased metabolic rate (you burn more fat in your sleep!)

Dietary protein doesn’t require a prescription and is a potent nutrition partitioning agent.  But as mentioned above, WRT energy balance, this study was not perfect.  So, why do I believe the effects of dietary protein are true despite the methodological flaws in Dr. Bray’s assessment of energy balance?  Because they are consistent in a variety of conditions.  For example, the remarkable effects of a high protein diet on body composition prevail even during underfeeding (aka going on a diet), a completely opposite paradigm.

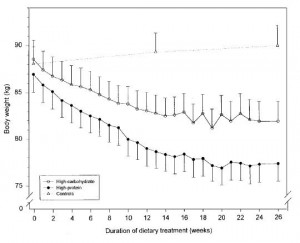
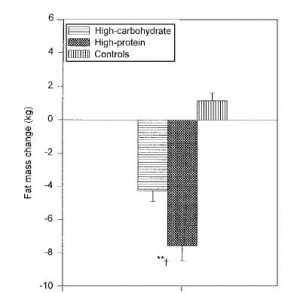
Skov and colleagues tested hypocaloric high vs. low protein diets for 26 weeks and confirmed that even during negative energy balance, dietary protein favors lean body mass at the expense of fat mass (Skov et al., 1999 International Journal of Obesity)

And similar results, albeit less robust due to the shorter duration, were found in a study by Layman and colleagues in as few as 10 weeks (Layman et al., 2003 Journal of Nutrition)

During overfeeding, high protein diets cause greater increases in lean body mass and energy expenditure, and prevent excess fat accumulation relative to low protein diets.  During underfeeding, high protein diets lead to a greater retention of lean body mass and more fat loss.  Nutrient partitioning 101. All calories are not created equal.

or


??


For the rest of this article and I promise it doesn’t suck ???? head over to Patreon! Five bucks a month for full access. It’s ad-free and you can cancel at any time.

If you’re interested in setting up consultations with me, reach out: drlagakos@gmail.com.

Affiliate links: Still looking for a pair of hot blue blockers? TrueDark is offering 10% off HERE and Spectra479 is offering 15% off HERE. If you have no idea what I’m talking about, read this then this.

 Join Binance and get some cryptoassets or download Honeyminer and get some Bitcoins for free

20% off some delish stocks and broths from Kettle and Fire HERE

If you want the benefits of  ‘shrooms but don’t like eating them, Real Mushrooms makes great extracts. 10% off with coupon code LAGAKOS. I recommend Lion’s Mane for the brain and Reishi for everything else

Join Earn.com with this link.

Start your OWN Patreon campaign!

calories proper
sucrose, visceral fat, et al.

Sugar-containing beverages vs. visceral fat

or

The malevolence of regular (non-diet) soda


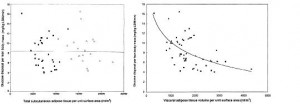
Background: visceral fat is an ectopic lipid storage site which is associated with a host of problems.  The amount of visceral, but not subcutaneous fat correlates very well with insulin sensitivity.  The figure below is from a classic paper which showed just that (Banerji, Lebovitz, et al., 1997 AJP).  On the left is a plot of subcutaneous fat vs. glucose disposal (a measurement of insulin sensitivity), and there is no clear relationship.  On the right, however, shows a strong negative correlation of visceral fat and insulin sensitivity.

Visceral fat is associated with insulin resistance, which is a precursor to type II diabetes.  So, what causes fat storage in visceral adipose tissue (besides hyperinsulinemia)?

Sucrose-sweetened beverages increase fat storage in the liver, muscle and visceral fat depot: a 6-mo randomized intervention study (Maersk, Richelsen, et al., 2011 AJCN)

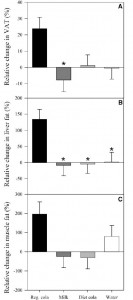
If you just started drinking a few cans of soda per day without intentionally changing anything else, this is what would happen.  The control groups got milk (isocaloric), diet soda, or water.  Food intake and physical activity was similar at baseline and during the intervention.
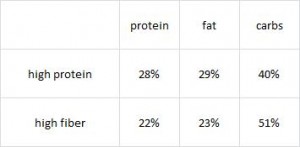
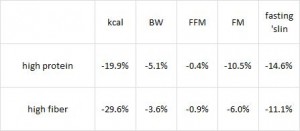
Figure 1 takes the cake:

Visceral fat, the most unhealthy fat depot, increased markedly in the group consuming regular cola, while it decreased in those drinking milk.  Diet soda or water had no effect.  A similar trend occurred with liver fat, probably the second-most unhealthy fat depot.  Same thing for muscle fat.

And from what we can infer, these effects were independent from energy balance (similar food intake and physical activity before and during the intervention).  Food intake data weren’t presented, but we’re told it was similar in all four groups.  Given these food intake-independent changes in body weight, energy expenditure data would have been a great addition to this manuscript.

The exoneration of diet soda?  In this study, the diet soda group seemed to win, with the best overall changes in body composition as per percent body fat.

And while those consuming milk gained the most weight, they gained muscle (possibly due to the higher protein content of milk).  AND the diet soda group gained the second highest amount of muscle (possibly due to the nutrient partitioning effects of caffeine, although that explanation is admittedly a bit of a reach).  The only differences in macronutrient intake were due to the beverages in question.

Food intake data should’ve been presented and measurements of energy expenditure would’ve added a lot.  The composition of the beverages and resulting changes in body weight/composition suggest no major deviations in the Laws of Energy Balance, and the changes in muscle mass make sense with what we know about dietary protein and sugar.  Furthermore, there is good reason to believe the observed malevolent effects of regular non-diet soda are true.

Similar results were seen in a well-controlled study where isocaloric glucose or fructose-containing beverages were given to overweight/obese humans for 10 weeks (Stanhope, Havel, et al., 2009 JCI):

Also similar to 3 weeks of 80 grams sucrose per day given to healthy young men (Aeberli, Berneis, et al., 2011 AJCN):

(waist circumference is a reasonably good marker for visceral fat)

The former studies have been of the [stronger] intervention type, but the same thing is seen in observational studies (Pollock, Dong, et al., 2011 AJCN).  This next study is of particular importance because it is in children.  The major sources of fructose were fruit juice and regular soda.  Elevated visceral fat is observed as early as 14-18 years of age!

What is most relevant about this study is that kids who drank the most fruit juice and soda were beginning to show signs of pre-diabetes and elevated inflammatory markers.  In kids.

there’s nothing redeeming about sucrose or its partner in crime fructose.


calories proper