Category Archives: pair-feeding

Sunlight, Meal Timing, and Circadian Rhythms

Hey fam, remember this? Sunlight and the circadian rhythms in your skin

Tl;dr: During the day, when potential DNA damage from UV light is higher than at night, the circadian rhythms in your skin upregulate expression of enzymes which protect & repair DNA. They also downregulate proliferation because the last thing you want is for a harmful DNA mutation to be rapidly spread. All of this thanks to a robust circadian rhythm.


NEW STUDY


Time-Restricted Feeding Shifts the Skin Circadian Clock and Alters UVB-Induced DNA Damage (Wang et al., 2017)


In general, LIGHT entrains the central circadian clock and FOOD entrains peripheral clocks. That’s why we try to get a big breakfast and go outdoors in the morning (or mimic this as closely as possible).


And from the aforementioned blog post, there is a bona fide circadian rhythm in skin, too. Well it appears this one, similar to other peripheral tissues, is regulated in part by FOOD but is also influenced by LIGHT.


Head over to Patreon, where for three bucks a month you get access to the rest of this article, all previous articles, and much more! Go soon because there’s only a limited number of spots at the $3 level. It’s ad-free and you can cancel at any time.


Part 2 is up now!


calories proper


Become a Patron!


Save

Save

Save

Save

Save

Save

Rodent keto studies

Next time someone says VLC/keto is harmful or at least not helpful for fat loss because of a new rodent study, they’ll probably be wrong.

BOOKMARK THIS ONE GUYS.

Rodent studies on ketogenic diets or exogenous ketones are valuable and interesting in a variety of #contexts, although I’d argue that regulation of fat mass isn’t really one of ’em.

For starters, rodents aren’t particularly ketogenic – it’s rare to see ketones >1 after an overnight fast even in long-term ketoadapted mice.  Also, many rodents gain weight until they die, whereas humans plateau and stay relatively weight-stable for their entire lives (at least historically, and I’m not talking about yo-yo dieting).

Skeletal muscle, on the other hand, seems more similarly regulated: keto isn’t muscle-sparing in either specie… most people, perhaps unwittingly, increase protein intake on keto, and THIS spares muscle (N.B. this is simply to spare muscle, whereas in non-keto dieters, it’s not uncommon to see increased muscle in the #context of high protein).  That’s because carbs are more anabolic than fat.  QED.

There’s just a fundamental difference in the way fat mass and appetite is regulated between the species.  There are many similarities, which is why these studies are still valuable, but fat mass isn’t one of ‘em.

Continue reading

AMYLIN

Brief background reading: amylin (according to Wikipedia)


In a study by Hollander on type II diabetics, the synthetic amylin analog pramlintide was tested (Hollander et al., 2003).  In this year-long RCT, over 600 patients were treated with placebo or up to 120 ug pramlintide BID (twice per day).  On average, these subjects were obese (BMI 34), diabetic for ~12 years, and had an HbA1c of 9.1%.  After one year, HbA1c declined 0.62% and they lost about 1.4 kg… not very impressive.


But it’s not all bad news; after viewing those relatively negative results (3 lb weight loss over the course of 1 year), another group of researchers led by Louis Aronne and Christian Weyer believed amylin had yet to be tested proper.  So they designed a better study; it was shorter, used higher doses of pramlintide, and they enrolled obese yet non-diabetic patients (Aronne et al., 2007).  They opted for higher doses of pramlintide (240 ug TID [three times per day]) because in dose-escalation studies, the incidence and severity of adverse drug reactions was consistently low at all doses tested.


They chose to study obese-er subjects (BMI 38, compared to 34 in the Hollander study) because obese subjects lose fat more readily than lean people, so if the study is designed to measure fat loss, then it is better to select a population of subjects where more fat loss is predicted.  They selected non-diabetic subjects for a similar reason; diabetics must regularly inject insulin which promotes the accumulation of fat mass — this could counteract any fat reducing effects of pramlintide.
In other words, it was a more powerful and better designed study.


After 16 weeks, pramlintide-treated subjects lost an average of 3.6 kg (~8 lbs), or about half a pound per week.  30% of patients lost over 15 pounds (1 lb/wk)!  Importantly, the weight loss didn’t appear to have reached a plateau by week 16, so it would have most likely continued along a similar trajectory had the study been longer.  There were no side effects, and a battery of psychological evaluations showed that the patients receiving pramlintide felt it was easier to control their appetite and BW, they didn’t mind the daily injections, and overall well-being increased.  At the very least, these evaluations meant the subjects weren’t losing weight because of nausea or malaise.  In fact, it was quite the opposite.


Continue reading

A brief explanation of Hall et al., ie, THE LOW CARB WAR

“Examination of acute shifts in energy balance by selectively reducing calorie intake from one macronutrient.”

Intro (1/2): please don’t read this study with the media headlines in your mind.  Don’t even pay any attention to the study’s title, abstract, intro, and discussion.  In no way did this study put low carb proper on the chopping block, regardless of what you’ve seen online or elsewhere.  Mmmkay?


Intro (2/2): if you want a lesson (or refresher) in Advanced Nutrition, check out the Supplemental Information: in formulating his mathematical models, Dr. Hall seemingly reviewed every single biochemical pathway and physiological variable ever invented.  Read it, for science.  Really.


Continue reading

Circadian Disruption Impairs Survival in the Wild

…just read that huge disasters, ranging from Exxon Valdez to Chernobyl, may have been due, in part, to ignorance of basic principles of circadian rhythms.  Gravitas.


circadian rhythms

Continue reading

Liver is evil but need not be punished. SFAs.

What to serve with a liquid lunch, and a recipe for chocolate.

It’s like a feed forward downward spiral.  If you don’t eat saturated fat & MCTs prior to imbibing, then liver intentionally makes more PUFAs for the alcohol-induced burning ROS to molest.  Liver is evil but need not be punished.  SFAs.

Brief background: (Kirpich et al., 2011 & 2013)

Researchers studying alcohol in rodents know where they’re going and like to get there fast.  70 drinks per day fast.  Granted, rats metabolize faster than humans so it’s likely a little less… but a little less than 70 is still a lot of sauce.

Continue reading

The curious effects of calories in mice

What is the biological impact of a history of obesity and weight loss?  The metabolic trajectory of two calorically restricted skinny mice depends entirely upon whether or not they used to be fat.  The end of this story might be: ‘Tis better to have lost and re-gained than never to have lost at all; or it’s just an interesting new take on the body weight set point theory.

Caloric restriction chronically impairs metabolic programming in mice (Kirchner et al., 2012)

divide and conquer

Part 1.
Study 1. Calorie restricted lean mice: the effect of diet composition.

Continue reading

Insulin per se

This recent manuscript nearly slid beneath the radar… almost stopped reading at the abstract until the word “nifedipine” appeared (among its widely pleiotropic effects, nifedipine also lowers insulin).

The series of experiments described below demonstrate one aspect of the scientific method reasonably well.  None of the individual experiments, when viewed in isolation, really prove the hypothesis.  But the researchers tested it with a variety of widely different methods and all of the results went in the same direction.  The hypothesis in question: insulin causes fat gain, and hyperinsulinemia per se, not macronutrients or calories, is the root cause.

This group has previously shown that sucrose is more detrimental than fish oil is beneficial toward obesity and glycemic control.

High glycemic index carbohydrates abrogate the anti-obesity effect of fish oil in mice (Hao et al., 2012 AJP)

Divide and conquer
Mouse study.  Lots of diets, in brief:
Pair fed: high fish oil (180 g/kg) plus 13%, 23%, 33%, and 43% sucrose (by weight, switched out for casein [a poor choice IMO])
High fish oil (180 g/kg) plus sucrose, fructose, glucose, low GI carbs, and high GI carbs.
That’s a lot of diets.  Kudos.

As expected, higher sugar and lower protein intakes enhance weight gain (yes, even when pair-fed similar calories [i.e., a calorie is not a calorie]) and this is at least partly due to reduced metabolic rate (as per the poor man’s energy expenditure test- measuring body weight before and after 24 hours starvation [higher weight loss = higher metabolic rate]):High sucrose-fed mice also had more inflamed adipose tissue and less thermogenic brown fat, which likely contributed to their glycemic dysregulation and elevated adiposity.

Sucrose is comprised of glucose and fructose, so to determine which component was causing obesity, they fed mice high fish oil diets plus either sucrose, glucose, or fructose.  Interestingly, the glucose group gained as much weight as the sucrose group.  Since the fructose group gained the least amount of weight, the researchers attributed the sucrose-induced obesity to insulin! (fructose doesn’t elicit an insulin response; and insulin levels were lowest in the fructose group).

Body weight, plasma insulin, and glucose tolerance:

I. Thus far: glucose and sucrose cause obesity by stimulating insulin secretion.  Glycemic deterioration is worst in the glucose-fed group because they were consuming most of the most insulinogenic sugar: glucose.  It was lower in the sucrose and fructose groups because sucrose contains only half as much glucose as pure glucose, and fructose contains no glucose.  IOW, these data suggest hyperinsulinemia per se causes obesity and insulin resistance.  Gravitas.

They further tested this by comparing high and low GI diets which cause higher and lower insulin levels, respectively.  As expected, the low GI diet led to less weight gain, and significantly lower insulin levels and adipose tissue accumulation compared to the high GI diet:

II. Thus far: high insulin levels, whether induced by glucose, sucrose, or high GI starch, lead to obesity.

They next took a non-dietary approach by artificially increasing insulin levels with glybenclamide in fish oil-fed mice to see if hyperinsulinemia could still cause obesity.  The results weren’t robust, but the higher insulin levels tended to increase adiposity even in mice fed the anti-obesogenic fish oil diet. 

In the experiment, the opposite approach was taken: nifedipine was used to lower insulin.  The use of octreotide and diazoxide has been used in a similar context with similar results in humans, discussed HERE and HERE.Again, the results were not robust, but when viewed collectively a picture begins to emerge: raising insulin levels, whether it is with a high glucose or sucrose diet, a high GI diet, or glybenclamide increases adipose tissue growth; and conversely, lowering insulin levels, whether it is with a less insulinogenic sugar diet (fructose), a low GI diet, or nifedipine decreases adipose tissue growth.  Oh yeah, and low carb works too.


calories proper


another side of leptin

Op. 56

Leptin is probably just as important as insulin WRT obesity, and this is as just as good a place as any to learn about this increasingly interesting hormone.

ABCs of Leptin in a nutshell:

A. Fed state: leptin is secreted from adipose and tells the brain to maintain food intake and energy expenditure at a body weight set point, which is likely established by diet.

B. Fasted state: leptin secretion declines, causing hunger to go up and energy expenditure to go down.

In the past, the cause and consequence of leptin resistance received a lot of my attention due to their importance in obesity.  Leptin resistance is, in brief, obesity.  Or the mouse on the right:

C. Obesity: eating a poor diet causes leptin resistance, which allows the body weight set point to rise until your fat cells stop responding to insulin (it’s kind of complicated)

But there’s another side of leptin that is mostly unknown, frequently overlooked, and poorly understood.  And I say this “is as just as good a place as any” to learn about it because while this side of leptin isn’t as popular as the energy expenditure, appetite, etc., stuff, it could very well be just as important, IMHO.

Leptin vs. the pathological hyperglycemia in diabetic state(s) (note the plural form of “state[s]”).

Leptin deficiency causes insulin resistance induced by uncontrolled diabetes (German, Morton, et al., 2011 Diabetes)

Divide and conquer

STZ is a beta-cell toxin used to induce diabetes.  STZ-treated mice have low insulin, low leptin, and lose weight despite a voracious appetite (just like type 1 diabetic humans).  Their insulin resistance is fully corrected while their marked hyperglycemia is attenuated by leptin injections.  Leptin reduces food intake but this doesn’t reduce body weight because energy expenditure paradoxically declines (discussed below).  Furthermore, diabetic mice restricted to eat only as much as leptin-treated diabetic mice (STZ-veh-PF)  lose significantly more weight because they lack the leptin-induced suppression in energy expenditure.

Summary of energy balance:

Control mice (veh-veh) eat the least but have much lower energy expenditure, causing them to weigh the most.  Energy expenditure is the more important variable driving high body weight in these animals (it goes down significantly more than food intake).  Diabetic mice (STZ-veh) eat the most food which is balanced by high energy expenditure (explained below), causing an intermediate body weight.  When the voracious appetite of diabetic mice is restrained (STZ-veh-PF), they weigh the least (they are starving).  Food intake is the more important variable driving low body weight in diabetic mice (energy expenditure is the same in diabetic and diabetic-PF mice).  STZ-leptin mice have intermediate food intake, energy expenditure, and body weight.  All is well, leptin cures the deranged energy balance of type I diabetes.

As mentioned above, diabetic mice eat more but weigh less because of drastically increased energy expenditure.  Energy expenditure is increased, in part, due to out-of-control gluconeogenesis (from hyperglucagonemia).  The paradoxical effects of leptin on energy expenditure (increases it in post-obese subjects but decreases it in diabetic mice) may be explained by leptin-induced reduction of this out-of-control gluconeogenesis, mediated via normalization of glucagon.

The authors further demonstrated that leptin restores liver, but not muscle or adipose insulin sensitivity in diabetic mice, independent of food intake.

Thus, insulin-deficiency -> dec. leptin -> inc. glucagon -> inc. hepatic glucose output -> hyperglycemia

Insulin’s primarily role might be to suppress glucagon.  STZ-induced “relative” state of starvation causes leptin to plummet; in the basal state, leptin may not have anything to do with glucagon because insulin keeps it under control.  But in diabetes, there’s no insulin to suppress glucagon; this is where exogenous leptin struts its stuff.

Collectively, these data further support the conclusion that insulin’s major function is to suppress glucagon, as opposed to other effects in skeletal muscle or adipose.  It’s been almost a year since Unger’s notorious publication which showed that glucagon receptor knockout mice were immune to type 1 diabetes (discussed here).  Diabetic hyperglycemia is partially mediated by insulin resistance, and largely mediated by hyperglucagonemia.  But why wasn’t hyperglycemia completely normalized by leptin replacement therapy?   These researchers sought simply to normalize leptin levels, but what would’ve happened if they provided a supraphysiological dose of leptin?  During physiological leptin replacement therapy, glucagon levels were normalized, but a hint of hyperglycemia remained.  Some other [leptin resistant?] member(s) of glucagon’s nefarious cohort must be responsible for the residual diabetic hyperglycemia…

Fortunately for us, the effects of supraphysiological leptin were tested in an identical experimental paradigm:

Leptin therapy reverses hyperglycemia in mice with streptozotocin-induced diabetes, independent of hepatic leptin signaling (Denroche, Kieffer, et al., 2011 Diabetes)

Indeed, supraphysiological leptin therapy overcame whatever diabetic “leptin resistance” remained and totally cured hyperglycemia.

This study repeated much of what was done in the first study, but whereas the first study added that leptin’s effect on food intake was not involved, this study showed that hepatic leptin signaling was not responsible either:

In both cases, hyperglucagonemia appears to be a major cause of diabetic hyperglycemia, and this is cured by leptin.  Insulin sensitivity was only partially restored by physiological leptin replacement; this seems to be due to some sort of apparent “leptin resistance,” which is overcome by supraphysiological leptin.  Diabetic insulin resistance is most likely caused by hyperglucagonemia-induced increased hepatic glucose output, and this is cured by leptin’s [non-hepatic] effects on reducing glucagon levels.  Diabetic insulin resistance may be partially caused by a brain mechanism, but at least one brain mechanism (food intake) was ruled out by the German study.

And oh so interestingly, all of these effects were mimicked by leptin administration directly into the brain, at a dose which caused no change in peripheral leptin levels (German, Morton, et al., 2011 Endocrinology).  The “STZ-lep” in the figure below refers to diabetic mice with leptin administered directly into the brain.

Back to the plural form of diabetic “state[s]” mentioned in the intro.  All of the above studies were in insulin-deficient SKINNY type 1 diabetic mice.  The next study is in OBESE type 2 diabetic rats.

Subcutaneous administration of leptin normalizes fasting plasma glucose in obese type 2 diabetic UCD-T2DM rats (Cummings, Havel, et al., 2011 PNAS)  

N.B. the control rats in this study were pair-fed to the leptin treated animals to control for the leptin-induced satiation.  Leptin-treated mice lost less weight most likely because energy expenditure declined (just like in the first study mentioned above).

In agreement with the glucose normalization seen by leptin treatment in skinny type 1 diabetic animals, leptin reduced glucose levels in obese type 2 diabetic rats, and this too was associated with reduced glucagon levels:

In type 1 diabetic animals, there are very low insulin levels regardless of food intake, leptin treatment, and hepatic leptin signaling.  Thus, insulin has nothing to do with the effects of leptin in type 1 diabetes.  This study showed that insulin levels also have nothing to do with the effects of leptin in obese type 2 diabetes:

So while the efficacy of exogenous leptin administration in established obesity is questionable, it is capable of combating the pathological glucagon-induced hyperglycemia which is responsible for much of the damage incurred by the diabetic state[s].

Leptin, glucagon, and diabetes.


calories proper

Trans fats, take III

Man vs. ape     Or
Postmenopausal women vs. Africa green monkeys


Two good and potentially somewhat contradicting studies on our good old friends, trans fats.

Trans fat diet induces abdominal obesity and changes in insulin sensitivity in monkeys. (Kavanagh et al., 2007 Obesity)

In this study, Kavanaugh and colleagues fed either a control diet or one fortified with trans fatty acids to a group of African green monkeys for 6 years.  Two immediate strengths of this study are 1) the use of primates, who respond to dietary intervention much more similarly to humans than rodents, and 2) the duration is long enough to model what would be seen in a human population.  Furthermore, to prevent differences in food intake from affecting the outcome, all of the animals were fed 70 kcal/kg of their initial body weight.  This feeding regimen was chosen specifically to prevent an energy imbalance, i.e., the monkeys were to be “weight stable” for the entire study.  This method is superior to pair feeding, where one group is fed ad libitum and the other group is given the same amount of calories as the first group, but instead of grazing all day (normal behavior) they get it all in one sitting.  Pair feeding is stressful for the animals and causes a whole host of other problems.  Both groups in this study received exactly the same amount of food (70 kcal/kg of initial body weight) every day for 6 years.

At the beginning of the study, the monkeys weighed ~6.5 kg (14.3 pounds); thus, for the rest of the study they were fed 455 kilocalories every day.  The diet consisted of 35% fat, 17% protein, and 48% carbohydrates.

The diet for half of the monkeys was supplemented with 8%, or ~4 grams, of trans fatty acids.  The average intake for humans is 3%, or ~7 grams per day.  An intake level of 8% for humans is around 18 grams, which could be accomplished by eating fast food or microwave popcorn a few times per week.  So besides being informative and shedding a new light on energy balance, this study is also of practical relevance.

Furthermore, the trans fat they chose was similar to the most abundant trans fat found in human diets (processed foods): partially hydrogenated soybean oil.

The diet:


TRANS refers to trans fatty acids, and CIS is the opposite of trans.  Cis fatty acids are the form of most natural fatty acids.  People don’t usually call regular fatty acids “cis” because it is assumed; this is how most unsaturated fatty acids are found in nature.

To the data.


divide and conquer.


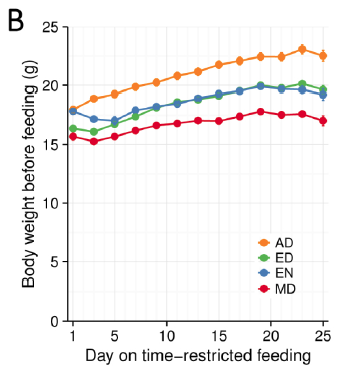
Body weight was roughly similar in CIS (closed circles) and TRANS (open circles) but started to diverge toward the end of the study.

The control group (CIS) weighed 6.41 kg at baseline and 6.55 kg at follow-up, an increase of less than 2%.  This was expected because at baseline, 70 kcal/kg per day was precisely enough food to keep them weight stable, so essentially nothing changed in these monkeys.  More specifically, since food intake and body weight didn’t change, we can say that there were probably no major perturbations in energy balance in this group.


TRANS, on the other hand, gained almost 3 times more weight despite eating exactly the same amount of food as the control group, which was exactly the same amount of food they were eating when they were weight stable at baseline.  Energy balance was clearly perturbed by trans fats.

As seen below, the excess weight in the TRANS group was primarily in the form of increased visceral fat:


An abdominal CT scan.  The lighter areas represent fat tissue.  Both pictures depict roughly similar amounts of fat in the outer region (subcutaneous fat), whereas the TRANS group had significantly more fat tissue within the viscera.

For reference:


In all, TRANS had 27% more fat mass.  Fasting glucose and insulin levels were unchanged but postprandial insulin levels were markedly elevated in TRANS (see below), suggesting that dietary trans fats indeed caused insulin resistance.  I boldly use the term “caused” because this was a fairly well-controlled intervention study; the only thing different between the groups was the diet.


The TRANS group gained a significant amount of fat mass despite an absence of excess calories.  This was most likely caused by the trans fat-induced insulin resistance and subsequent postprandial hyperinsulinemia.

It would appear as though trans fatty acids defied the laws of energy balance.  The TRANS group gained fat mass despite an absence of excess calories.  Even the most practical explanation bodes poorly for trans fatty acids… it would appear as though trans fats were capable of inducing nutrient anti-partitioning independent of food intake.

I can see two ways to interpret these data.

  1. Trans fatty acids have an independent effect on energy balance.  That is, they specifically reduce energy expenditure, which would make the initial 70 kcal/kg*day excessive.  This would account for the excess fat mass, compared to controls, but not necessarily the increased body weight.  455 kilocalories (70kcal/kg*d) should be sufficient to support a specific amount of body weight; it is difficult to imagine a scenario whereby muscle mass declined enough to significantly reduce metabolic rate to the point where 455 kilocalories was so excessive that fat mass increased significantly more than the amount of muscle lost.  IOW, if this possibility were true, I would have expected, at most, a similar body weight but more fat and less muscle, not simply way more fat.

Of course, these processes would occur simultaneously and discreetly in vivo, but for simplicity’s sake I’ve broken it down.

6.6 kg monkey, x 70 kcal/kg*d = 462 kcal/d

Loses 0.022 kilograms of muscle, new body weight = 6.578 kg… since FFM is reduced, BMR should be reduced.  It was a 0.33% loss of body weight which was entirely from muscle (in this theoretical example), so perhaps BMR declines proportionately 460.46 kcal/d (? there are more accurate formulas in the literature, but this approximation is sufficient for our purpose)

all of those excess calories formerly burned in the lost muscle are now available for storage in fat.

462 – 460.46 = 1.54 excess kcal/day.  1.54 excess kcal every day for 6 years = 3,372.6  total excess kcal, which translates to ~0.438 kg fat mass.

0.438 kg new fat mass – 0.022 kg muscle lost = 0.416 kg overall weight gain.

6.6 kg + 0.416 = 7.016 kg.  Actual final body weight was 7 kg.  Pretty darn close.

Wow, can the loss of less than one ounce of muscle really cause such a drastic change in fatness?!? I don’t know for sure, but exchanging the microwave popcorn for a little resistance exercise seems prudent.

(in case you were wondering, no. I didn’t guess 22 grams. I did a ton calculations to quantify the metabolic rate reduction necessary to cause an energy surplus big enough to lay down enough fat mass to compensate for the reduction in muscle [which theoretically declined in proportion to the reduction in metabolic rate] and end up as close to 7 kg as possible… it could be calculated exactly but this has taken up 30 minutes already, and I think the point has been made)

2. Alternatively:  Energy expenditure varies day-to-day, hour-to-hour, second-to-second.  When we eat, we are transiently in positive energy balance, which reverses after a few hours, especially at night when a negative energy balance ensues and the fuel stored during the positive energy balance is utilized.  During those stints of positive energy balance, some of the excess energy is stored as fat tissue, while the rest is used to fuel the body.  Somehow, trans fatty acids shift the balance in favor of fat storage.

2a.  can there exist a positive energy balance selectively in adipose tissue?

2b. more likely, trans fatty acids reduce some component of energy expenditure, possibly basal metabolic rate, or perhaps the thermic effect of feeding.  Neither of these was measured, but I firmly believe energy balance was maintained.  It’s always maintained.

But the frightful conclusion remains the same: the TRANS group got fatter without eating more.  They didn’t eat more than they were supposed to but got fatter anyway.  Sad but true.

What about in humans?

Effect of trans-fatty acid intake on insulin sensitivity and intramuscular lipids-a randomized trial in overweight postmenopausal women. (Bendsen et al., 2011 Metabolism)

This study gave a group of 52 overweight but otherwise healthy postmenopausal women 16 grams of trans fatty acids in pumpkin muffins.  The control group received olive & palm oil-enriched pumpkin muffins.  In terms of the dosing, this study is almost directly comparable to Kavanaugh’s study.  However, this study only lasted 16 weeks (probably due to ethical reasons).  They also included a lean control group (for good measure?), baseline subject characteristics are below:


Nothing out of the ordinary.

And the investigators measured compliance empirically.  You are what you eat.  When a specific type of fat is consumed, its constituent fatty acids accumulate in body tissues like adipose and red blood cells.  So the researchers measured red blood cell trans fatty acid content.  Kudos!  (biomarkers are superior to almost any other measurement of compliance to a dietary intervention in humans)


Indeed, the women ate their muffins.  But no effect on body weight!


Body weight increased by about 2% in both groups.  If you want to get nit-picky, then we can make a few verrry long stretches concerning the body composition data:


The increase in fat mass was 33% greater in TFA compared to controls!  (fat mass increased by 3% in the control group and 4% in TFA).  The increase in percent body fat was twice as big in TFA compared to controls!  (body fat percent increased by 1% in the control group and 2% in TFA).  IOW, the changes in body composition were nil.  This does not necessarily refute Kavanaugh’s African green monkeys because that study lasted 6 years; the insignificant changes in fat mass in Bendsen’s women over the course of 16 weeks could very well add up to significant changes after 6 years.  Actually, if the endpoint was indeed a 6% weight gain after 6 years (like the monkeys) (78.7 * 1.06 = 83.422 -78.7 = 4.722 / 6 years = 2.156 grams per day x 16 weeks = 241 grams) we might have expected these women to gain less than they actually did (~ 241 grams in 16 weeks compared to 1,200 grams).  In truth, however, these numbers are well beneath what can actually be measured accurately even in a laboratory setting.  So it is bona fide nit-picking.

Maybe it’s time to throw in the towel and confess that trans fats are significantly worse for African green monkeys than for overweight but otherwise healthy postmenopausal women.  There was no change in visceral adipose between the groups:


Potential confounding?  I’m really grasping at straws… but here it goes anyway:


The TFA group reduced their carbohydrate consumption over the course of the study.  Carbohydrate consumption is directly correlated with liver fat accumulation.  But as per the trans fat study, trans fat consumption is inversely correlated with liver fat.  So we might expect trans fat-induced increase in liver fat to be cancelled out by the carb reduction-induced decrease in liver fat.  And this is exactly what happens!


Furthermore, liver fat didn’t change in the control group because 1) their carbohydrate intake didn’t decline, and 2) they weren’t eating a ton of trans fats.  IOW, neither of the major dietary determinants were altered.

So, according to these colorful explanations, trans fats may have been just as harmful to Bendsen’s women as they were to Kavanaugh’s monkeys.  The reason why the results differ can be at least partially explained by the inferior dietary intervention utilized by Bendsen.  IOW, Kavanaugh’s dietary intervention was perfect; the subjects (monkeys) ate their prescribed diet exactly, no cheating, no sneaking in any snacks.  The diet changed markedly in Bendsen’s study; all women gained weight meaning that the test foods were probably not isocalorically substituted for foods in their normal diet.  Perhaps they just ate the foods in addition to their normal foods (unlikely considering the marked changes in macronutrient consumption).

Some more data from Bendsen’s overweight but otherwise healthy postmenopausal women were reported in another paper, and hints of trans fat-induced insulin resistance were revealed…

Here are the results from an oral glucose tolerance test:


Glucose:  Just like Kavanaugh’s monkeys, there was no change in the glycemic response to a glucose load.

On the right, insulin levels.


Insulin:  The open triangles are the control group, solid squares are the TFA group..  The dashed lines indicate insulin responses at baseline and the solid lines represent insulin responses at 16 weeks. In a randomized controlled intervention study, ALL changes in the intervention group must be compared not only to baseline measurements (pre-treatment), but more importantly they must be compared to the changes in the control group.  Over the 16 weeks, insulin response declined very slightly in the control group (see the little red arrow around the 45 minute mark).  However, insulin response increased slightly in the TFA group.  Take either of these changes individually and they would amount to nil.  But when you consider the change in control vs that in TFA, a modest trend appears.  The TFA group is beginning to show a hint of peripheral insulin resistance.  Maybe I’m seeing something where there is nothing, but the Kavanaugh’s study lasted 6 years and Bendsen’s study was only 16 weeks.  We must expect the changes to be ~20 times smaller in the Bendsen study.

OK, perhaps I got lost in the minutiae, or lost sight of the forest for the trees, but that doesn’t mean I’ll be eating microwave popcorn any time soon.  And on the bright side, creating this post was a great brain exercise

calories proper