fat blog, take I

Trans fats are everywhere.  Go to your cupboards, grab any packaged food products like crackers or cereal and you will probably find the words “partially hydrogenated” in the ingredients list.  So, what are trans fats? and how bad are they?

There are two types of fatty acids: saturated (no double bonds) and unsaturated (1 or more double bonds).  Fatty acids can be relatively straight molecules, except double bonds in the “cis” configuration put a “kink” in them.  “Cis” is the opposite of “trans;” saturated fats are neither cis nor trans because they don’t have any double bonds.  See below.

Trans fats are exactly like unsaturated fats except the kink is straightened out a bit, so now they have 1 or more double bond, like unsaturated fats, but are relatively straight, like saturated fats:

It’s kind of amazing that these molecules are so similar, yet you can eat 150 grams of saturated + cis-unsaturated fat every day and live a long healthy life, or eat 5 grams of trans fats, become obese and die prematurely.

Trans fats start out as liquid cis-unsaturated fats in vegetable oils (e.g., soybean oil, canola oil, etc.).  From a manufacturing standpoint, cis-unsaturated fats are too soft and unstable.  So to put them into foods would result in a messy product that melted at room temperature and then goes rancid.  That is not exactly what you think of when you picture a delicious warm muffin, or some crispy crackers, or an oreo cookie.  Converting cis-unsaturated fats into trans-unsaturated fats is what makes the difference.  Now your favorite processed food products have the perfect consistency, taste delicious, and don’t go stale.  From the perspective of the food company, people will buy more because it tastes better, and they don’t have to worry about it going bad if there is a slump in sales.  Win-win.

The melting point of the 18-carbon saturated fatty acid “stearic acid” is ~70F (mostly solid at room temperature; e.g., steak fat).   The melting point of the 18-carbon monounsaturated fatty acid “oleic acid” is ~56 F (mostly liquid at room temperature; e.g., olive oil).  The melting point of the 18-carbon monounsaturated trans-fatty acid “elaidic acid” is 113 F (almost always solid; e.g., Crisco is still solid after sitting out in the Southern California sun all day).   FTR, room temperature is 68 – 84F

Stearic acid is pretty much always solid.  It is found in steak.  Picture the white marbling in a thick cut of beef; it is solid.  Unlike oleic acid, which is found in olive oil.  Olive oil is usually a liquid, but will solidify if you put it in the fridge for a few hours.  Oils high in elaidic acid are almost as solid as stearic acid; elaidic and stearic acids can be solid at body temperature; this is highly favorable for food companies.  That is a key temperature that is important for the deliciousness of processed foods; they melt in your mouth not in your hands

Moving on to the data:  The first paper is another seminal manuscript from the infamous Nurses’ Health Study.  In brief, the Nurses’ Health Study began in the mid-70’s and has been steadily collecting data on over 100,000 women.  This particular analysis includes a sample size of ~80,000 (for the record, that is an enormous amount of people to study).

Dietary fat intake and the risk of coronary heart disease in women. (Hu et al., 1997 NEJM)

Nurses’ Health Study

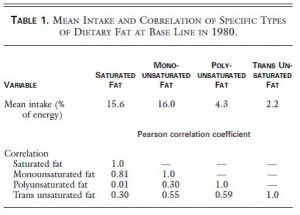
Table 1.  top half of the figure, “Mean intake.”   On average, in this population of ~80,000 women in the United States, 2.2% of total calories came from trans fat.  That’s about 5 grams on a 2,000 kcal diet.  Their average total fat intake was 37.1% , or 82 grams per day. Thus, trans fats comprise about 6 % of the total fat ingested.

bottom half of the figure “Correlation.”   Trans fat intake correlates better with PUFA & MUFA (0.55 & 0.59) than with SFA (0.30).  This is half expected and half surprising.  It’s half expected because, as stated above, trans fats are unsaturated fats, so by definition if you’re eating more trans fat then you’re eating more unsaturated fats.  It’s half surprising because you might think unhealthy people eat a lot of saturated fat and trans fat, so those two things should correlate well.  But they don’t.  It appears as though there are some people who eat vegetable oils and trans fats while others who eat saturated fats.  There is of course much overlap, but thats the gist of Table 1.

Table 2.  What are people eating?
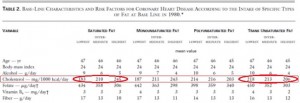
Table 2.  I love these kinds of tables; they look busy but really aren’t.  There are 4 super-columns: Saturated fat, monounsaturated fat, polyunsaturated fat, and trans unsaturated fat.  Each super-column is divided into three sub-columns: low, intermediate, and high intake levels.  For example, check out the 1st three columns in the 3rd row:  people with low saturated fat intake drink 9 grams of alcohol per day (~1 drink), people with high saturated fat intake drink less (5 grams or about a half a drink).

Now for the fun part:  cholesterol (in the red box).  Cholesterol and saturated fats are virtually always found in the same foods, so you can see that the people who ate the least saturated fat also ate the least cholesterol (red circle, 183 mg/1000kcal), and people who ate the most saturated fat also ate the most cholesterol (245 mg). Trans fats are primarily made out of vegetable oils, and there is no cholesterol in vegetable oils. People who ate the least trans fats also ate the most cholesterol (218 mg), and people who ate the most trans fat also ate the least cholesterol (206 mg).  These tables have the kind of stuff that becomes common sense but only after you think about it for a while.

Back to the half surprising point from above; maybe it should have been only 25% surprising. Healthy people try to avoid both saturated and trans fats, and healthy people who eat the least SFA or trans fat also eat the most fiber (last row in Table 2).  So all those things group together and can be seen in the table.  The advantage of this kind of table is that it independently breaks down each nutrient.  The disadvantage is that sometimes the common sense stuff doesn’t become common sense until you’ve thought about it for a long time, but I guess that’s true with a lot of things.

Moving on, to the bottom half of table 2:

similar trends…  People who eat the least saturated or trans fats also exercise the most, smoke the least, etc.  Where do you fit in?

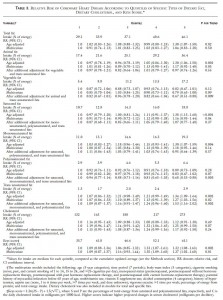
Below is Table 3 in its entirety, but don’t worry we will not be considering very much of it.

Divide and conquer.

Of all the variables on that table, Trans fats carry the highest relative risk for CHD:  

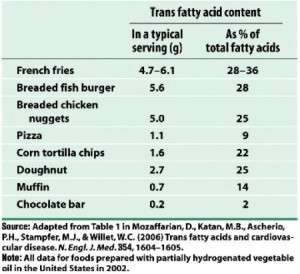
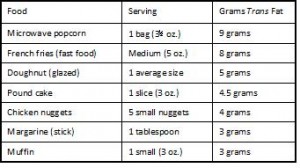
For the highest quintile of trans fat intake compared to the lowest, relative risk is 1.53, or people who consume 2.9% of total calories as trans fats (~8 grams) have a 53% greater chance of developing coronary heart disease than people who consume 1.3% of total calories as trans fats (~2.9 grams).  A difference of only 5 grams per day can increase your risk by half!  Where can you find 5 grams of trans fat ?  I thought you’d never ask:

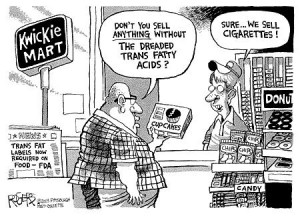
Holy sh!t 9 grams of trans fat in a bag of microwave popcorn?!?  So microwave popcorn causes irreversible lung damage and heart disease too?

(Note the absence of real food on those two charts)

Back to the data:  Furthermore, the Nurses’ Health Study seems to exonerate saturated fats a little.  The age-adjusted risk for the highest saturated fat intake (18.8% of total calories or 41 grams) compared to the lowest (10.7% or 24 grams per day) is pretty high: 1.38 or 38% greater risk of CHD.  Well, back to that ‘common sense’ theme, unhealthy people eat a lot of saturated fat and trans fats.  Trans fat is the real bad guy, so when the data are controlled for trans fats, the risk of eating a lot of saturated fat completely went away (see red circle).

The relative risk is “1.07,” which would mean a 7% increased risk for CHD.  BUT:  The numbers in paranthesis after the relative risk are the confidence interval.  In brief, when the confidence interval includes “1.0” as it does here (1.0 is between 0.77 and 1.48), there is no longer a statistically significant association.

And the same thing happened to animal fat:

The adjusted risk for eating 36.4% (81 grams) compared to 17.4% (39 grams) of total calories from animal fat is “0.97” which would mean there is a 3% reduced risk for CHD if you ate more animal fats.  BUT the confidence interval includes “1” so there is no statistically significant association.

In the Nurses’ Health Study of ~80,000 women in the United States, CHD risk was not associated with intake of saturated fat, animal fat (or cholesterol), and was significantly associated with trans fat.  My take?  If you are at risk for CHD, avoid trans fats like the plague.  And microwave popcorn.

calories proper

the mortality blog

Influence of individual and combined health behaviors on total and cause-specific mortality in men and women: the United Kingdom health and lifestyle survey. (Kvaavik et al., 2010 Archives of Internal Medicine)

The United Kingdom Health and Lifestyle Survey looked at the relationship between mortality and the following four variables:

Smoking (never, former, current);

fruits and vegetables (> or < 3x per day);

physical activity (> or < 2 hours per week); and

alcohol consumption (> or <  2/d for women or 3/d for men)

Importantly, the analysis was designed to specifically address poor behaviors; it wasn’t how many vegetables you ate; it’s whether you eat more or less than 3 servings per day.  This simplifies things statistically, but it kind of excludes healthy people.  In other words, this study cannot tell you if 8 servings of veggies per day are better than 5 (a question that would be relevant to healthy people), it can only tell you if it’s bad to have less than 3 (a question that’s really only relevant to unhealthy people).  And this study says nothing about ‘what’s the worst thing for you;’ keep in mind that it only says how bad for you are those 4 pre-specified variables.

Data were collected in 1984 on ~5,000 people in the UK who were born before 1966 (they were at least 18 years old), and follow-up lasted until 2005.

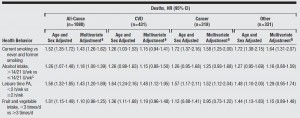
Pretty much, the whole story is summarized in Table 1.

??

Lies, damned lies, and statistics.

Divide and conquer.

The hazard ratio is calculated as follows: take the first group, smoking, “never smokers.” Of the 1,591 people who never smoked, 214 died during the study.  The rate of death among never smokers is therefore: 214 / 1591 = 0.13.  Of the 2,124 people who were current smokers when the study began, 497 died.  The death rate for smokers is 497 / 2124 = 0.23.  The hazard ratio for smoking is 0.13 / 0.23 = 1.74; current smokers had 74% increased risk of dying compared to never smokers.  For former smokers, the risk was actually much worse; they had a 134% increased risk of dying.  NOTE: that is not because quitting smoking is bad for you.  Former smokers have already done a lot of damage to their health by smoking, and smokers who are very sick are very likely quit smoking but are also still very likely to die.  These are correlations not causations.   In any case, the reason why my numbers don’t match the table is because their data are “statistically adjusted.”

Going by their hazard ratios, of the 4 poor habits in question, being a current smoker is the worst (83% increased risk of dying compared to never smokers).  In terms of mortality risk, smoking is worse than regularly drinking in excess, getting less than 15 minutes of physical activity per week, and eating zero fruits or vegetables.  Nutrition is important, but not as important as not smoking.

The next worst factor was getting less than 15 minutes of physical activity per week. OK, so nutrition is important, just not as important as exercise and not smoking.  Actually, their nutrition variable had pretty much no significant correlation with all-cause mortality.

Moving on, Table 2. All cause and cause specific mortality

Again, the worst risk factor is current smoker, which was strongly associated with cancer mortality; getting < 2 hours of physical activity per week was strongly associated with CVD and all-cause mortality.

So if someone has all 4 poor behaviors, they should 1) stop smoking, 2) exercise just a little bit, 3) drink less alcohol, and 4) eat more fruits and vegetables.  If they only have 1 poor behavior it doesn’t really matter that much.

IMHO if someone asked what I considered a poor nutrition behavior, it wouldn’t be “too few fruits and vegetables.” People don’t get sick because of eating too few of anything, they get sick from eating too much.  I would have said a poor nutrition behavior is something like “> 3 servings of processed foods per day” or “too much damn sugar” because obesity and obesity-related disorders are the number one causes of death and those two behaviors do far more harm than fruit does good.  (too much processed foods and sugars can cause obesity; too little fruit cannot)

jump back over the pond to:  Risk Factors for Mortality in the Nurses’ Health Study: A Competing Risks Analysis (Baer et al., 2010 American Journal of Epidemiology)

The Nurses’ Health Study is one of the biggest epidemiological investigations of all time.  This study included young and middle aged nurses who completed multiple questionnaires about diet and lifestyle in 1980, 1984, and 1986.

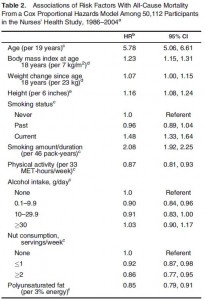
The basic outline is similar to the UK study, and according to the table above, smoking triumphed again as the worst.  But wait, table 2 continued:

A Ha! diabetes is worse than smoking.

So perhaps eating more than 3 servings of vegetables per day isn’t as good as never smoking, but being diabetes-free is the best.  However, there is one important caveat.  This view of the data doesn’t exclude a relatively extreme interpretation.  I.e., eat as much junk food as you’d like and as long as you don’t develop diabetes, your lifespan won’t be affected.  A better interpretation needs to exclude that possibility because, unfortunately, people cannot eat as much junk food as they’d like and not get diabetes.

However, this study wasn’t about what led to the leading causes of death, it was about the leading causes of death.  It’s a bit cryptic, but I think it means 1) don’t smoke and 2) don’t do anything that causes diabetes…

glycemic load”  shows a pretty good correlation with all-cause mortality.  Glycemic load is basically how much your diet increases your blood sugar.

Glycemic load is increased by:

1)       eating a greater quantity carbohydrates; or

2)       eating higher glycemic index carbohydrates

We know a high glycemic load contributes to diabetes from an earlier publication on the Nurses’ Health Study

the 800 pound gorilla, no pun intended..  is it too much of a stretch to say your best chance of dying is:

“glycemic load –> diabetes –> mortality”

?

more thoughts about the data: Having a drink a day (~10% reduced risk vs. teatotallers) or getting a little bit of exercise (13% reduced risk) were good for you, but not good enough to compensate for smoking (>100% increased risk) or a carbohydrate-rich diet (22% increased risk due to glycemic load; >100% increased risk for diabetes).  I’m usually very nutritionally biased; for example, the cause of everything can be traced to nutrition.  In the UK study they didn’t ask about glycemic load or diabetes, but they said smoking carried the greatest risk for all-cause mortality.  In the Nurses’ Health Study, smoking was bad but diabetes was worse.  I imagine the findings about diabetes would have been similar in the UK study had they asked.  So my conclusion from these studies is that the universal order of things (or just how the majority of us will go) is most likely: “glycemic load –> diabetes –> mortality”

One more study, from the National Center for Health Statistics

The preventable causes of death in the United States: comparative risk assessment of dietary, lifestyle, and metabolic risk factors (Danaei et al., 2009 PLOS Medicine)

Briefly, these authors made a death-rank chart to display the 12 quantitatively biggest contributors to mortality in the United States.  Nutrition isn’t number one, but it did capture ~10 of the top 12.

calories proper
the poor, underestimated glucagon

it appears that the time for the indirect pathway for glycogen synthesis may finally be here.  Or perhaps it is insulin’s peripheral anti-gluconeogenic actions.

this topic deserves at least 1 lecture in a graduate level nutrition course: Glucagon receptor KO prevents type I diabetes in mice

Background information
When blood glucose is high after a meal, it is cleared by three tissues.
1)      Liver
2)      Muscle (insulin-dependent)
3)      Adipose (insulin-dependent)

Insulin stimulates glucose clearance but also suppresses glucagon.   b-cells surround the capillaries within pancreatic islets; blood flows through the b-cells first than through the a-cells.  So if glucose is high, it triggers insulin release from the b-cells, which then bathes the a-cells and inhibits glucagon.

Glucagon is a counter-regulatory hormone, i.e., it acts to increase blood glucose.  If you asked me before reading this paper, I would have said glucagon is important in fasting; necessary to maintain blood glucose at a level compatible with brain glucose uptake.  How?  By stimulating hepatic glucose production (glycogenolysis and gluconeogenesis).  That’s all.  After a carbohydrate containing meal, there’s less need for hepatic glucose production (HGP), so insulin inhibits glucagon.  After a high protein meal, maybe you still get a little bit of glucagon to help with excess amino acids.  End of story.

Divide and conquer.

There were four important groups of mice:

1)      Wild-type (normal, “WT”)
2)      Type I diabetic (no insulin, “STZ”)
3)      Glucagon receptor KO (no glucagon activity, “Gcgr-/-”)
4)      STZ Gcgr-/- (no insulin or glucagon activity)

STZ (streptozotocin):        b-cell toxin, mimics type I diabetes (no insulin), Ketoacidosis, weight loss despite hyperphagia (2-fold increase in food intake!), Decreased fat mass (due to lack of insulin)

Gcgr-/-:  Decreased blood glucose levels as expected, Improved glucose tolerance (somewhat expected), Ultra-high glucagon levels but confirmed no glucagon activity

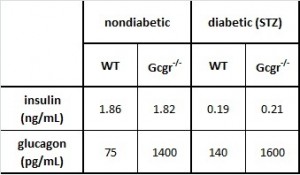
Table 1.  The basics.

  • Insulin levels are practically nil in all STZ-treated mice
  • As expected, glucagon is increased in STZ-treated mice, because insulin usually suppresses glucagon
  • Glucagon levels are astronomical in Gcgr-/-

we know from previous studies that Gcgr-/- have lower fasting glucose & better glucose tolerance (Gelling et al., 2003 PNAS)

Back to the data.  Rodent adipose tissue physiology 101:

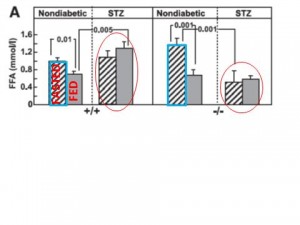
Fasting & Fed Free Fatty Acids

1st panel: normal WT mice.  Feeding increases insulin which suppresses lipolysis, thus FFA levels go down.

2nd panel: STZ (type I diabetic).  No insulin, so no change in FFA levels after feeding.

3rd panel: Gcgr-/-.
1) Higher fasting FFA compared to WT mice? (compare the two blue outlined boxes);  2)  Feeding increases insulin which suppresses lipolysis, thus FFAs drop; 3) Greater relative suppression of FFA (due to higher basal FFA) suggesting increased adipose tissue insulin sensitivity?

4th panel: STZ Gcgr-/-
1) Reduced fasting FFA compared to WT STZ, suggests a lipolytic role for glucagon, but why is this restricted to STZ mice?  2) No effect of feeding on FFAs because no insulin (just like in WT mice)

A lipolytic role for glucagon is confirmed by comparing the bars circled in red.

Compare the fasted to fed columns in each panel: all four panels are in accord with what we know about the anti-lipolytic effects of insulin.

Not sure why fasting FFAs are lower in STZ Gcgr-/- compared to nondiabetic Gcgr-/-.  Any ideas?

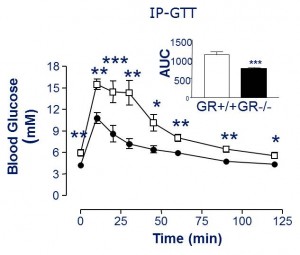
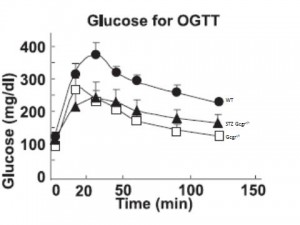
Oral glucose tolerance is improved in Gcgr-/- (compare WT [closed circles] to Gcgr-/- [open squares]), and insulin response is identical (not shown).

Glucose tolerance is improved in STZ Gcgr-/- mice.  (compare STZ Gcgr-/- [closed triangles] to Gcgr-/-[open squares]).  But STZ mice have no insulin!

This suggests that glucagon causes postprandial hyperglycemia and the primary role for insulin is to suppress glucagon (as opposed to facilitate glucose uptake in muscle, for example).  In other words, without glucagon driving up hepatic glucose production (HGP), there won’t be high postprandial glucose, and therefore it doesn’t matter if insulin is present.

Where does the dietary glucose go?  Probably not so much into muscle because there’s no insulin (there is still controversy, but there is evidence that insulin signaling in muscle is important for glucose tolerance; see MIRKO mice , although this isn’t entirely clear).

Liver glycogen?    glucagon actively inhibits hepatic glucose uptake and stimulates HGP (?)

So, to recap:  1) In the absence of glucagon, oral glucose tolerance is normal because there is no great stimulus for HGP; insulin is dispensable.     2) Point #1 is supported because without insulin, oral glucose tolerance is normal as long as there is no great push on HGP (i.e., STZ Gcgr-/-).     3) If glucagon is present, then insulin decreases glycemia by inhibiting glucagon which reduces HGP.  If glucagon is absent, then insulin is not necessary because the liver takes up more of the dietary glucose.  Clear as an unmuddied lake.

STZ Gcgr-/- Probably lower gluconeogenesis compared to STZ wild-type because: lower ketones compared to STZ wild-type, and lower fasting glucose compared to STZ wild-type.  Lower fasting FFAs compared to STZ wild-type, confirming lipolytic effect of glucagon.

Gcgr-/- Elevated fasting FFAs compared to WT, suggesting lipolytic effect of glucagon is restricted to STZ-treated mice.  Reason unknown, any ideas?

OK, like John Dewey now, in the normal situation: dietary glucose is absorbed but glucagon inhibits it from entering the liver at first, so the dietary glucose adds to the glucose produced via gluconeogenesis/ glycogenolysis causing a high peak in blood glucose.  Insulin inhibits glucagon lowering HGP and blood glucose comes down  (role for insulin signaling in muscle?).    Without glucagon: dietary glucose absorbed and is mainly incorporated into liver glycogen; some gets by but HGP is lower, so the total glucose peak is blunted.  Insulin is unimportant in this model, which is why glucose tolerance is the same in Gcgr-/- and STZ Gcgr-/- mice.

So insulin makes you fat and glucagon makes you hyperglycemic (blind, renal failure, neuropathy).   ‘damned endocrine pancreas.

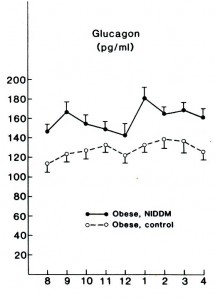
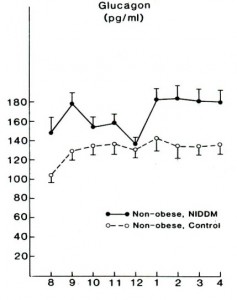
Flashback 1987 – Glucagon levels elevated in lean and obese type II diabetics; maybe this is why they are hyperglycemic?  Less to do with skeletal muscle insulin resistance, more to do with glucagon & HGP?     Reaven et al., 1987 Journal of Clinical Endocrinology and Metabolism

Flashforward 1999 – The almost exact same study was done 10 years ago in humans  (Shah et al., 1999 AJP)  “Impact of lack of suppression of glucagon on glucose tolerance in humans.”  The authors insisted on using the double negative, which is annoying, so instead of saying “lack of suppression of glucagon,” I refer to this condition as “high glucagon.”

Divide and conquer.

No time for background:  10 healthy patients.  Endogenous insulin and glucagon were inhibited by infusion of somatostatin.  At time zero, glucose infusion begins at a rate designed to mimic a 50 gram oral bolus.  Then they infused either a high dose of insulin to mimic the “nondiabetic” response, or a low dose of insulin to mimic the “diabetic” response.  In each of these conditions, glucagon was either co-infused the entire time (“high glucagon”) or delayed for 2 hours (“suppressed glucagon”).

So the 4 groups were: High insulin & low glucagon, High insulin & high glucagon, Low insulin & low glucagon, and Low insulin & high glucagon (diabetic).

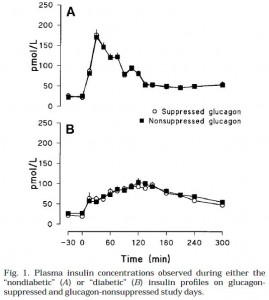
Insulin infusions looked like this (Fig 1):

Top graph is nondiabetic, note the high insulin peak.  Bottom graph is diabetic.

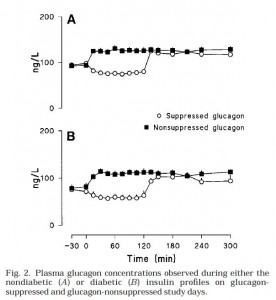
Glucagon infusions were pretty much identical for nondiabetic & diabetic conditions (Fig 2):

Top graph is nondiabetic, bottom graph is diabetic.  NOTE: Figures 1 and 2 simply reflect the experimentally produced conditions (that is, the infusions), they are not a physiological effect.  Secretion of endogenous insulin and glucagon was inhibited by somatostatin so the only insulin and glucagon in the blood is what the researchers put there.

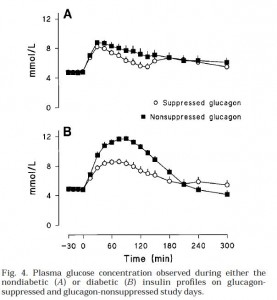
Then they gave ‘em glucose (Fig 4).  Please just focus on the top graph first.  Here’s what the glucose levels looked like in nondiabetic conditions.  In other words, high insulin [similar to nondiabetic WT (open circles) & Gcgr-/- (closed squares) above]:

Both Gcgr-/- mice and humans with suppressed glucagon have normal or improved glucose tolerance when insulin is present in nondiabetic doses (top graph).  Now look at the bottom graph; it is what happens in diabetic conditions (just like STZ-treated Gcgr-/- [open circles]; STZ-treated WT mice [closed squares])

We don’t have the data for STZ-treated WT mice, but most assuredly there is higher glucose levels, similar to what is seen in Fig 4B (low insulin, high glucagon [closed squares]).  So glucagon is not bad if insulin is there to defend you (Fig 4A).  Without adequate insulin (Fig 4B), high glucagon causes hyperglycemia.

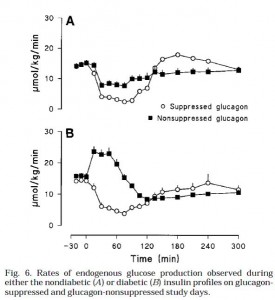
This was shown to be primarily due to differences hepatic glucose production (Fig 6):

This is an important graph.   Top graph (Fig 6A): (nondiabetic) high insulin suppresses HGP.

Bottom graph (Fib 6B): (diabetic) insulin is not necessary to repress HGP when glucagon is low (open circles).  But if glucagon levels are high and there is low insulin, HGP is high, causing the hyperglycemia seen in Fig 4B.  Interestingly, with low glucagon (open circles), HGP is suppressed to a similar level by high (top graph) or low (bottom graph) insulin (~5umol/kg/min).  High glucagon is sufficient to cause hyperglycemia.  Is it essential?  So high glucagon is why type II diabetics have postprandial hyperglycemia?  (this seems to downplay the role of skeletal muscle insulin resistance [?])

Furthermore, high glucagon (closed squares) impaired insulin’s ability to suppress HGP (compare, in both the top and bottom graphs; HGP is higher with the closed squares (high glucagon) than with the open circles (low glucagon).  This means that insulin inhibits HGP by inhibiting glucagon; it takes really high insulin to counter the effects of high glucagon (with high glucagon [closed squares] HGP could only be suppressed by high insulin [Fig 6A closed squares are suppressed; Fig 6B closed squares are not suppressed) …. Suppressing glucagon in the diabetic insulin milieu (open circles, bottom graph) was sufficient to restore glycemia down to the same levels as nondiabetics (Figure 4 [open circles], glucose peaks at 8mM in both conditions)… so is that why insulin inhibits glucagon?  Or is it how insulin suppresses HGP?  Does it matter?

I think it might, there may be fundamentally important difference.   If it’s how insulin inhibits HGP, then that excludes the possibility that insulin reduces HGP by decreasing amino acid and glycerol release from muscle and adipose, respectively.  It means that insulin acts on the liver, not peripheral tissues, to repress HGP (assuming that in humans, the liver is the major physiological target of glucagon).

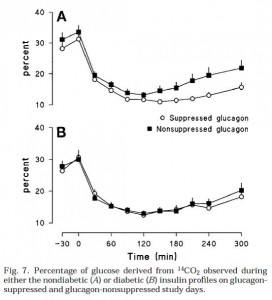
But alas! It looks like we won’t be needing to grapple with such questions today.  The researchers found that gluconeogenesis was nearly equally suppressed in all conditions suggesting that the major contributor to glucagon-induced glycemia was glycogenolysis (in this model).

The poor, underestimated glucagon

Calories, proper

the mice got fatter without a positive energy balance

the mice got fatter without a positive energy balance.

There was  a lot of good feedback from the post about 5% calorie restriction, but it has left people wondering,  how could this happen?

Truthfully, I have no clue. But since First Amendment Rights apply in the blogosphere, I am free to speculate.  However, for anyone with proper training in nutrition and or energy balance, this may seem like shouting fire in a crowded auditorium, so please forgo this post.

Divide and conquer.

Energy balance MUST AND WILL BE MAINTAINED.

For starters, lean mass (muscle) was lost, which might be indirectly caused by the reduction in food intake.  Muscle is the major contributor to energy expenditure.  If food intake declines, and muscle is lost in order to reduce energy expenditure, energy balance could be in fact maintained.  The only strange part of that conclusion is that it states that muscle was lost in order to reduce energy expenditure.  Why would muscle do this?  Perhaps it is due to a novel variation of the “use it or lose it” principle.  “Use it or lose it” refers to the decline in skeletal muscle that occurs during extended periods of disuse (think of someone’s arm after it spent 2 months in a cast).

When calorie intake is reduced, leptin levels decline rapidly signaling “starvation” mode to the brain.  This causes a large reduction in energy expenditure in order to preserve energy stores.  Previously, the decline in energy expenditure would have been predicted to occur by decreased physical activity.  And reduced physical activity could cause muscle loss due to the “use it or lose it” principle.  BUT physical activity was unchanged.  Therefore, it is possible that the decline in metabolic rate was manifested by processes other than physical activity in muscle tissue.  This means that “use it or lose it” could apply to functions (“using it”) that occur while we are resting.  Clearly, this is a marked deviation from the energy balance dogma.  And it has kept me up at nights.

What processes could these be?  None were measured or even suggested by the authors of the study, but I suppose some possibilities could be reduced activity of sodium potassium ion channels or possibly reduced futile cycling.  This is interesting, indeed.  More research is severely warranted.

So muscle was lost in order to balance the reduced food intake.  OK, so where did the energy come from to build fat mass?  This may have already been explained… if metabolic rate was reduced down to match food intake, energy balance would be maintained.  If metabolic rate was reduced even further, it would produce a relative energy surplus.  Perhaps this is precisely what occurred.  Thus, muscle was lost in order to balance the reduced food intake, and metabolic rate declined in order to create a relative positive energy balance selectively to the fat tissue.  Why would something like this occur?  It is very strange, to be sure, but may have had something to do with the stress of the feeding regimen. The body thinks it is starving, so preserving fat mass becomes a priority.  Maybe the systems that work to preserve fat mass during starvation are the same as those that build fat mass during energy surplus.

For now, trying to explain these findings without defying the laws of energy balance caused gray hairs to appear in my beard.   I’ll try to figure out the why later.

The mice got fatter without a positive energy balance.  Can this happen to us?  Does it matter?  These results suggest that fat tissue has a propensity to grow regardless of energy balance.  In the abovementioned study, the trigger may have been the hormonal response to a stressful feeding regimen.  Type I diabetics are usually very thin but develop fat deposits in their insulin injection sites; thus, in type I diabetics, the trigger is insulin.  In both situations, fat mass grew because of the hormonal milieu, not an energy surplus.

calories, proper

USDA Guidelines

Extra, extra, read all about it

USDA press release – “New dietary guidelines to help Americans make healthier food choices and confront obesity epidemic”

the new message? “eat less and move more.”  Sound familiar?

But is this really the best message?  I mean, they didn’t have to do any research or studies or anything, because, well, it’s obvious.

This paper is a nice example of how it might not be so obvious.

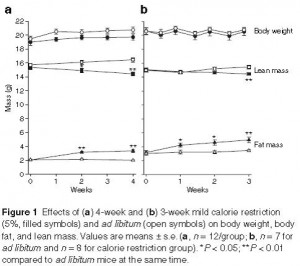
These researchers took two groups of mice, fed one group “ad libitum” (AL), meaning, the mice ate as much as they wanted, and fed the other group 5% less (calorie-restricted, CR).  For the record, 5% is not very much; it’s about 100 fewer calories for you or me.  And apparently, it’s not enough to cause weight loss:

the experiment was performed twice, and the results are in panels a & b above.  The top lines represent body weight and you can see that there is virtually no difference between the groups.  Look a little further down, however, and you will see that the calorie-restricted group actually lost lean mass (skeletal muscle).  Aargh.  If that isn’t bad enough, mathematically it doesn’t exactly work out unless the mass of something else increased to balance it.  Look further down on the figure, their fat mass actually increased.  Sounds like the worst diet ever.  They didn’t get fatter, they got fattier.

1. Why did they lose muscle?

2. How did they gain fat while being underfed?

What is going here ?

To a large degree, muscle mass determines energy expenditure, which in turn is roughly equivalent to your food intake.  So there is a good relationship between the amount of muscle you have and the amount of food you eat.  As seen above, the opposite appears true also.  By reducing food intake, muscle mass declined, apparently to match the new (lower) food intake level.   So, for now, we can blame the muscle loss on the calorie deficit.

What about the fat gain?  Fat gain is very unlikely if you are in a hypocaloric state… so maybe the mice weren’t technically hypocaloric.  They researchers measured resting energy expenditure (REE) and found that their metabolism was significantly lower.

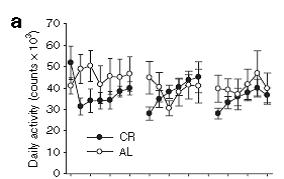
In other words, the 5% calorie restriction would have been hypocaloric for “ad libitum” fed mice, but once on the diet, their metabolic rate slowed down so much that 5% fewer calories was no longer hypocaloric.  What caused this reduction in metabolic rate?  The researchers then measured physical activity and found the mice certainly weren’t less active, and were actually more active at some time points.

Since they weren’t less active, the reduced energy expenditure must have been in the form of a lower metabolic rate.  In other words, they didn’t get tired or lazy, their body’s intrinsic metabolic rate simply declined.  This was likely related to the loss of muscle mass, but admittedly, these data are a bit cryptic.

To summarize: 5% calorie restriction -> muscle loss -> lower energy expenditure -> reduced metabolic rate -> increased fat mass ?     Well yes, all of those things occurred, but whether or not they necessarily occurred in that sequence is less clear.

Major fundamental finding: the mice ate less, moved more, and got fattier.

Eating less and moving more is not the answer.

calories, proper

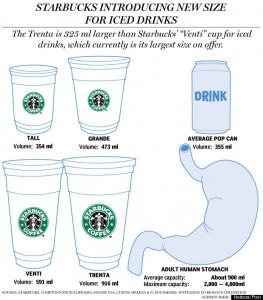
Trenta

Tired at night? Sleepy first thing in the morning?  Bid farewell to your woes, Trenta has arrived.

One small step for man, 1 Litre of coffee for mankind.

>600 mg caffeine = ~10mg/kg

Your nearest Trenta dealer

Bad news if you’re a spider…

Some observations about coffee

1)      Caffeine vs. placebo

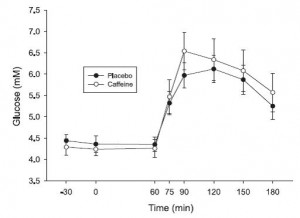
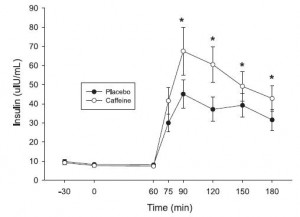
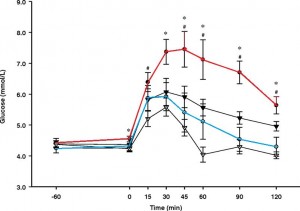
Acute caffeine reduces glucose tolerance.  This would suggest adding sugar to coffee is a no-no.  Sweetener? Perhaps.  The jury is still out.  The caffeine dose used in the study below is 5 mg/kg; that is HALF of the Trenta.

Graham et al., 2001 Canadian Journal of Physiological Pharmacology

2)      Coffee vs. decaf

But wait!  coffee (5 mg/kg; red line) vs. decaf (blue line) consumed prior to eating a high glycemic index meal (Moisey L L et al. Am J Clin Nutr 2008;87:1254-1261).  Is caffeine the bad guy?

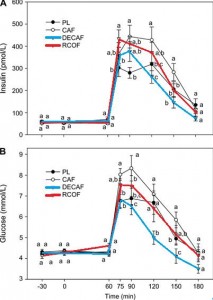
3)      Coffee vs. decaf vs. caffeine vs. placebo

A Ha!   Coffee was worse than decaf (Moisey et al. 2008; Battram et al., 2008)   Caffeine (open circles) was worse than placebo (closed circles) (Graham et al., 2001; Battram et al., 2008)   But caffeine is worse than coffee!?

Battram et al., Journal of Nutrition 2006

What does this mean?  Caffeine is toxic? Coffee inhibits caffeine?  Decaf was almost healthier than placebo.

Decaf + caffeine = coffee?  What else does decaffeination do to coffee?

The whole is greater than the sum of its parts.

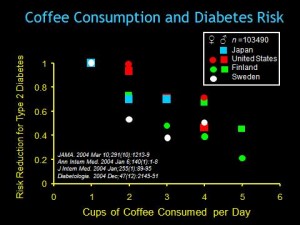
4)      Coffee vs. diabetes risk

BUT epidemiological data suggest the opposite; coffee is protective.

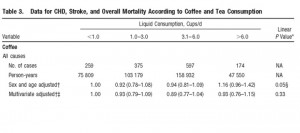
5)      Coffee vs. mortality

de Koning Gans  et al., Arteriosclerosis, Thrombosis, and Vascular Biology. 2010

Coffee had no effect on mortality… or did it?  High coffee drinkers tend to be less healthy – eat more, weigh more, and smoke a lot more than low coffee drinkers.  Thus, uou’d expect their mortality to be higher due to lifestyle habits.  but it’s not.  Either coffee protects against the effects of a poor lifestyle, or we need to re-evaluate what defines a poor lifestyle.


calories proper
 

Become a Patron!


US vs. Forty Barrels and Twenty Kegs of Coca-Cola

United States v. Forty Barrels and Twenty Kegs of Coca-Cola

flashback 1916
Coca-Cola busted for being adulterated with an ingredient known to be harmful to health.  Caffeine!!!  lol

HFCS you’re next.

more clips from TPMC

Calories in the body are a measure of how much energy a given food provides when it is “burned.” The extent to which this occurs comprises the “metabolic rate.” Let us take, for example, a 160 pound woman who expends 2,000 calories per day. If weight-stable, she is consuming 2,000 calories of food per day, and is creating 2,000 calories of heat per day (that is not a coincidence). The calories expended provide energy for all aspects physical life, breathing, daily activity, walking, eating, etc., etc. Extra calories are used to fuel physical activities, as opposed to non-physical activities such as reading… even if you are reading really, really fast. More intense activities like running or climbing stairs require more energy, and thus burn more calories, relative to lower intensity activities like walking or sitting on the couch. These calories can be derived directly from the food in your most recent meal, or from the body’s storage depots. So, basically, you consume calories in the form of food, and expend calories in the form of mechanical work and heat. That is calorie balance.
HART-D trial: aerobic, resistance, or both?

calories, proper. Sticking to the data-
Today’s study: aerobic exercise is good for you, but bad for muscular size and strength.

The HART-D trial was a 9 month exercise study which compared resistance (RT), aerobic (AT), and combined (combo) training. Combo did a lot less resistance exercise than RT, and a little less aerobic training than AT. The primary outcome measure was glycated hemoglobin, which combo improved the most, but I am primarily interested in Table 4.
Effects of Aerobic and Resistance Training on Hemoglobin A1c Levels in Patients With Type 2 Diabetes

To start out with my conclusion, I think this study shows that aerobic training is bad for muscle, fat loss, and strength (albeit due to a very small statistically non-significant extent). In short, aerobic exercise is softening (in a small statistically non-significant manner).

The exercise interventions were good.

Aerobic training (AT & combo groups)
150 min/wk of moderate intensity (50-80% VO2max) (?10-12kcal/kg BW*week)

Aerobic: 12 kcal/kg*wk x 98.2 kg = 1170 kcal /wk 623.7-681.9 MET/min*wk
Combo: 10 kcal/kg*wk x 100.6 kg = 1006 kcal /wk 532.0-572.8 MET/min*wk

Resistance training (RT & combo groups)
Days/wk sets x exercises ( x 10-12 reps)
RT: 3 2 x 4 upper, 3 x 3 lower, 2 abs
Combo: 2 1 x 4 upper, 1 x 3 lower, 1 abs

Basically the combo group did about 33% of the resistance training and 80% of the aerobic training as RT and AT, respectively. They all exercised for 140 minutes per week which burnt approximately 1200 kilocalories. In brief, the combination regimen achieved the biggest reduction in glycated haemoglobin while simultaneously reducing blood glucose-lowering medications more than any other group. That is a pretty nice finding, but I think the data presented in Table IV are of critical importance to anyone concerned with body composition, physical performance, and quality of life in general.

Observations:
Aerobic training alone reduced fat-free mass… Their muscles got smaller (3rd row, 4th column).
Aerobic training alone reduced strength… They got weaker (3rd row, 5th column).
The aerobic training alone group lost the least amount of fat mass despite reducing their food intake the most (3rd row, 1st and 3rd columns). I repeat: the aerobic training alone group lost the least amount of fat mass despite reducing their food intake the most…
I can’t entirely explain this, however I would guess that either:
1) Aerobic exercise makes you so tired for the rest of the day that you just lie around doing nothing, expending much less energy. Or
2) Measurement errors, which might be important considering the small overall differences between groups.

Moving on,
Any group that resistance trained (RT & combo) lost more fat mass and gained more strength than those who didn’t (aerobic only)
Resistance training alone increased fat-free mass (also confirms the adequacy of the resistance training regimen… in other words, if muscle mass & strength didn’t respond to the resistance exercise, I wouldn’t consider this a good study.)

Resistance training in the combination group probably would’ve increased muscle mass if it wasn’t for that darned muscle-burning aerobic exercise 🙂

The combo group lost the most fat while reducing their food intake the least. From this I would recommend combination training, however this group also had no improvements in muscle mass and only a modest increase in strength, two things that are very important for quality of life.

In conclusion, resistance training prevailed in this study. Aerobic training is still important for patients with congestive heart failure, so combination training may be more appropriate for this population (and for people with chronic hyperglycaemia), however for the rest of us, resistance training is superior.

Thoughts?

Calories, proper.

calories everywhere

You can find 100 of them in conveniently packaged snacks, our bodies burn them all the time, and yet they can be neither seen nor touched. That is because a calorie is technically a unit of heat. Just like how feet and meters are ways to quantify distance, calories quantify heat. More specifically, a calorie is the amount of heat required to raise the temperature of one gram of water (~1 mL) from 14.5°C to 15.5°C. Another popular unit used to quantify heat is the joule, which is equal to approximately 0.239 calories. When expressed as a unit of mechanical energy, 1 calorie = 4.2 joules. Lastly, a British Thermal Unit (BTU), more famous for measuring the cooling capacity of air conditioners, is the amount of heat required to warm a gallon of water by 1°F. The important point to remember is simply that a calorie is, albeit somewhat abstract, a unit of heat. Knowing that calories are a measure of heat is important, although less useful than knowing about the calories in food, and how they are handled by the body. Calories, whether those in food or those expended by the human body, are measured by a procedure known as calorimetry.