Category Archives: TPMC

calories proper

The Laws of Energy Balance FTW!

Weight loss maintenance is not determined by calorie intake… or physical activity… but by The Laws of Energy Balance FTW!!!

Odd, the sensation I felt when reading this news release (gloating?).  As reported at a meeting of the Obesity Society, results from the Utah Obesity Study of gastric bypass patients 2 and 6 years after surgery.  By the 2 year mark, they lost over 100 pounds, or 36% of their starting weight (went from 296 to 189 pounds).  Energy expenditure declined from 2201 to 1736 kcal/day.  Food intake went from 2085 to 1638 kcal/day.  (Hint: it’s no coincidence that energy expenditure and food intake declined to the exact same degree.)  Physical activity and fitness levels increased.

By the 6 year mark, they still weighed 29% less than their starting weight.  N.B. that’s an amazing level of success, it’s virtually unheard of in diet intervention studies.  +1 for gastric bypass; -1 for nutrition.

Here’s what piqued my interest: during the gradual increase from 189 pounds to 210 pounds, which occurred between years 2 and 6 post-surgery, the most significant factor associated with weight regain was not calorie intake or physical activity… it was metabolic rate.  This represents another fail for “eat less move more,” and a win for the Laws of Energy Balance.

So what’s this got to do with The poor, misunderstood calorie?

what we know about metabolic rate:

1)      It’s invisible.

2)      Fructose vs. The Laws of Energy Balance (circa December, 2011): sugar-sweetened beverages can cause fat gain, not by providing excess calories, but by reducing metabolic rate.

3)      Holiday feasts, the freshman 15, and damage control (circa January 2012): overeating a high protein diet causes less fat gain than overeating anything else because it increases metabolic rate.

4)      Missing: 300 kilocalories (circa July 2012):  after losing weight, subjects assigned to the low carb diet maintained a higher metabolic rate than those on an isocaloric low fat diet.

“Eat less move more” is not the answer.  But eating less sugar, more protein, and fewer carbs might be.  Nutrition matters.

calories proper

Missing: 300 kcal… AGAIN!

Or, the curious perils of crappy sleep, part II: calorie-thieving gnomes.

In part I of the Crappy Sleep series, we discussed, among other things, the malevolent metabolic effects of the most utterly abnormal sleep structure (28-hour days, 6.5 hours of sleep per night [~5.6 hours / 24 hours], and dim lighting during the days).  In this study, the sleep was disrupted to a physiologically relevant degree for two weeks: 8.5 vs. 5.5 hours per night; in a cross-over study.

In part I of Missing calories, we discussed the effects of 3 different diets on metabolic rate after weight loss.  In this study, energy balance was assessed during 2 different sleep regimens in dieters in a CROSS-OVER STUDY.  If you haven’t guessed it, I believe a well-designed and executed cross-over study is superior, necessary, and essential for most metabolism-related studies.

Insufficient sleep undermines dietary efforts to reduce adiposity   (Nedeltcheva et al., 2010)

Continue reading

BPA

Though they won’t kill you [instantly], environmental and dietary xenoestrogens warrant a bit of attention, especially considering their theoretical mechanism of action is, among other things, augmenting insulin secretion.  This is of particular importance given the growing body of evidence of a causal role for insulin hypersecretion in the obesity epidemic (see Barbara Corkey’s 2011 Banting Lecture for an overview).

And this is the SECOND time this year BPA has made headlines.

BPA. Looks like some kind of medieval weapon or something.

Continue reading

Soda vs. childhood obesity

What happens if you give skinny kids a can of fully sugared regular soda to drink every day for a year?

What happens if you take the soda away from overweight kids for a year?

The answer to these two questions should be a definitive user’s guide to the question: how bad is soda for my children?   And we got those answers this week.


A set of powerful studies were recently published, the likes of which I thought we’d never see.  It’s unethical to assign anyone to start smoking so we can properly study the effects of cigarettes; and before today, I would’ve thought it unethical to assign young children to start drinking fully sugared regular soda.  And not just one or two cans…  over 350.  For the 4 year olds the first study, by the end of the trial they had been on soda for almost a third of their life… during a critical period of development.  Ethics schmethics.  Hopefully this study will never be repeated.

Continue reading

Why diets fail, Op. 106

Correction: diets don’t fail, dieters do.  And don’t take that the wrong way; adhering to a restrictive diet is one of the most difficult tasks for ANYone; thus, the obesity epidemic.  Some recent insights into diet-induced weight loss success, or lack thereof, have shed a new light on why some dieters adhere and others don’t.

In Insulin resistance, I discussed how insulin sensitivity may influence how well someone responds to a diet.  In brief, insulin resistant obese people do much better on low carb than low fat in a closely controlled clinical setting.  If you’re one of the lucky few insulin sensitive obese people, then simply reducing calories works.  Unfortunately, however, most obese are insulin resistant.

When it comes to devising a weight loss strategy, I’m willing to cut every corner and use every trick in the book to achieve success.  Data in this new analysis came from Chris Gardner’s notorious A to Z study, where patients were given diet books and told to have at it.  It was the weakest intervention in the history of diet studies, but it is exactly what everyone who wants to lose weight does.  And just like in Gardner’s study, most people fail.

Continue reading

Missing: 300 kilocalories

or
Weight-loss maintenance, part II (as promised)

Effects of dietary composition on energy expenditure during weight-loss maintenance (Ebbeling et al., 2012)

A three-way crossover study!  Excellent study design.  In brief, the participants lost 30 pounds in 12 weeks on a pseudo-Zone diet (the official version) consisting of 45% carbs, 30% fat, and 25% protein, then switched to one of 3 “weight-loss maintenance” diets for 4 weeks.  (FTR “weight-loss maintenance” cannot even be remotely assessed in 4 weeks, but what the heck, it was a THREE-WAY CROSSOVER.)

To put the issue to bed before it is even raised, the volunteers were given professionally prepared food for about half a year and paid ~$2,500 if they stuck to the plan.  They STUCK to the plan.

or more simply: 

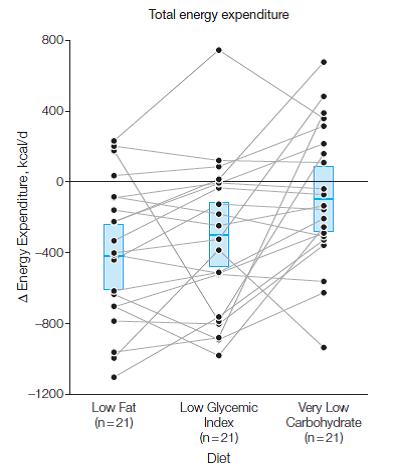
The diets were classified by the authors as high glycemic load (high carb low fat), low glycemic index (e.g., Mediterranean Diet), & low carb (e.g., Atkins Diet).

These “glycemic” indices in general are primarily determined by the carb & fat contents.  A low carb diet will always have a low glycemic index and low glycemic load, and the opposite is true for a low fat high carb diet.  Any high glycemic index food turns into a low glycemic index meal when it’s combined with other foods (like we normally eat).  The only way to make a strictly high GI diet is with low fat; the easiest way to make a low GI diet is with low carb.

The major outcome measurements dealt with energy expenditure, with the premise being that preservation of metabolic rate after weight loss should improve “weight-loss maintenance.”

Resting energy expenditure (REE) is measured by indirect calorimetry.  It’s the amount of calories that a total couch potato would burn daily and is usually determined by body composition (more muscle = higher REE).  While body composition was similar in each group, REE was modestly higher in subjects on the low carb diet.

RQ (respiratory quotient) measures the relative amount of fat and carbs you’re burning: 0.7 = fat oxidation; 1.0 = carb oxidation.  It is determined by diet (eat more carbs, burn more carbs), body composition (have more body fat, burn more body fat), and exercise intensity (marathons burn fat; sprints burn carbs).  The higher carb oxidation on the low fat diet and higher fat oxidation on the low carb diet likely reflect the respective dietary compositions.


Total energy expenditure (TEE) is exactly what its name implies.  It’s the total amount of calories you burn in a day.  If your body weight is stable, then this is also approximately how many calories you’re eating.  This result is actually pretty interesting.  TEE on the low carb diet was over 300 kcal higher relative to the low fat diet.  This is probably at least partially due to the higher protein content of the diet (30% vs. 20% of total calories or 150 vs. 100 grams per day).  TEE of the intermediate low GI diet was in between low fat and low carb diets (2937 kcal/d), so TEE increased as carb intake declined and fat intake increased across all 3 diet groups.  Follow the blue boxes in the figure below to see the averages, and since this was a THREE-WAY CROSSOVER (!), you can follow the lines to see how each person fared individually:

300 kcal is equivalent to an hour of exercise, yet subjects on low carb weren’t exercising more (although the slowly-losing-his-wits-Dr Bray suggested otherwise in an editorial, arguing that the increased TEE/REE ratio meant increased physical activity, despite the actual data, which showed if anything, slightly lower total and moderate-vigorous intensity physical activity in the low carb group).

Burning an additional 300 kcal per day is like losing over 2 pounds of fat per month by doing exactly nothing.  BUT

to be clear (e.g., disclaimer, mea culpa, evidence of heresy, etc.):

  1. all participants in the study ate the same amount of calories
  2. low carbers burned over 300 more calories per day compared to low fat dieters
  3. body composition  and body weight were similar between the groups

300 calories per day is a LOT of calories, why didn’t it impact weight loss?

This seemingly paradoxical conclusion suggests energy intake is the primary determinant of weight loss, independent of energy expenditure and diet composition.  It is either a violation of The Laws of Energy Balance, experimental error, or evidence of dark magic.

Moving on,

the authors were quick to note urinary cortisol (an anti-inflammatory and stress hormone) and CRP (a marker of systemic inflammation) were highest on low carb, and this could cause insulin resistance.  However, I’d note 2 things: 1) CRP declined in ALL groups relative to baseline, but the reduction was less in low carbers compared to the other groups; and 2) CRP was low and within the normal range in all subjects throughout the entire study. But most importantly, hepatic and peripheral insulin sensitivity improved most in low carbers, in whom CRP and cortisol was the highest.

Similar to the Jakubowicz study (dessert for breakfast), the Ebbeling study was interesting but not groundbreaking; nothing to write home about.  Both showed modest benefits for low carb over low fat.  The news media haven’t feasted on these studies yet, but when they do, however, I’m sure they’ll disagree.  “Weight-loss maintenance” is a riddle wrapped in a mystery inside an enigma, not a simple question to be elucidated by a mere 4-week diet study, even if it’s a three-way crossover.  even if it has dark magic.

If you’d like to consult with me, reach out: drlagakos@gmail.com.

Check out my Patreon campaign! Five bucks a month gets you full access and there are many other options. It’s ad-free and you can quit if it sucks 🙂

Affiliate links: Still looking for a pair of hot blue blockers? TrueDark is offering 10% off HEREand Spectra479 is offering 15% off HERE. If you have no idea what I’m talking about, read this then this.

Join Binance and get some cryptoassets or download Honeyminer and get some Bitcoins for free

20% off some delish stocks and broths from Kettle and Fire HERE

If you want the benefits of  ‘shrooms but don’t like eating them, Real Mushrooms makes great extracts. 10% off with coupon code LAGAKOS. I recommend Lion’s Mane for the brain and Reishi for everything else

Join Earn.com with this link.

Start your OWN Patreon campaign!

calories proper


Save

QLSCD II (or Grains IV)

WRT the Quebec Longitudinal Study of Child Development (QLSCD), I failed to adequately emphasize one major implication of their findings.  It is a point that completely and wholly illustrates the disconnect from data, empirical science, and all common sense exhibited by mainstream beliefs in calories and dieting.   gravitas

Higher intakes of energy and grain products at 4 years of age are associated with being overweight at 6 years of age (Dubois, Porcherie et al., 2011 Journal of Nutrition)

Divide and conquer

Exhibit A


The table above shows the percentage of underweight, normal weight, and overweight children consuming the recommended number of servings for each food group.  15.5% of underweight children, 19.1% of normal weight children, and 42.6% of overweight children meet the recommended ?5 servings of grains per day.  Grains comprise [sic]: “breads, pastas, cereals, rice, and other grains”

There is a direct relationship between body weight and the percentage of children consuming ?5 servings of grains per day, i.e., more grains equals greater chance of being overweight.

Exhibit B


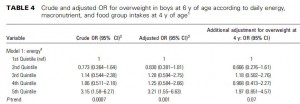
This table shows the odds for being overweight at 6 years of age in increasing quintiles of how many calories consumed daily two years earlier.  The crude odds risk (first column) shows a poor relationship between calorie intake at 4 years old and risk of being overweight 2 years later.  I say “poor” because the risk is non-significantly lower in the second quintile, higher in the third, lower in the fourth, but much higher in the fifth quintile (3.15x more likely to be overweight for the biggest eaters compared to the littlest eaters).  These data are unadjusted and could be confounded by a variety of factors.  Thus, the significance level of the trend is high p=0.0007.

The second column is similar to the first, but is adjusted for many known confounders: birth weight, physical activity, mother’s smoking status during pregnancy, annual household income, and number of above normal weight parents.  As such, the degree of statistical significance was reduced from 0.0007 to 0.001.

The third and most important column is further adjusted for body weight at 4 years of age, and shows that calorie intake is no longer associated with body weight at 6 years of age.  In other words, being overweight at 4 years old predicted being overweight at 6 years old better than calorie intake (and physical activity).

In the authors’ own words [sic]: “The only food group significantly related to overweight was grains.”  No association was observed for overweight risk with vegetables and fruits, milk products, or meat and alternatives.

IMHO, the observation that being overweight at 4 years old was the best predictor for being overweight 2 years later is remarkable… body weight status at 4 years old is a more important risk factor than both physical activity and calorie intake.  The only ‘controllable’ variable  is grains; i.e., you can’t change whether or not your child was overweight at 4 years of age, and physical activity and calorie intake doesn’t matter.  But grain consumption seems to matter, and it is something that can be controlled.

What is it about grains?  I don’t know, exactly, but it’s not simply that they’re carbohydrates because elevated carbohydrate intake didn’t increase risk for being overweight.

Exhibit C


“Eating less and moving more” is not the answer.  Nutrition matters, not the guidelines.


calories proper


Empty calories, II

You should be ashamed of yourself!

Foods, fortificants, and supplements: where do Americans get their nutrients? (Fulgoni et al., 2011 Journal of Nutrition)

The Journal of Nutrition just published an analysis of micronutrient intake in healthy Americans.  The dataset came from the National Health and Nutrition Examination Survey (NHANES), which is run by the Centers for Disease Control (CDC)  and the National Center for Health Statistics (NCHS).

The USDA database was their primary source for nutrient information, but the Food and Nutrient Database for Dietary Studies (FNDSS) and Nutrient Database for Standard Reference (SR)  were also consulted when appropriate values were unavailable.  As the authors faithfully noted in the methods section, these registries are not perfect, but they really did do a lot of footwork to get accurate, up-to-date data.

Importantly, intake from whole foods, processed foods, and supplements was differentiated.  AND bioavailability was taken into account!   Kudos.

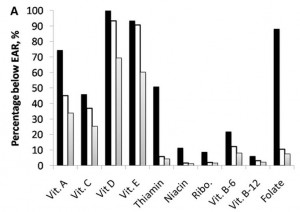
Shamefulness: over half of you are not getting enough vitamins D and E, and many are not getting enough vitamins A and C, and magnesium and calcium.

And if it weren’t for processed foods, too many of you would be consuming too little thiamin, niacin, riboflavin, and folate!  Why are you dependent on processed foods for vitamin sufficiency!?!

In the graph below, the higher the solid bars, the more people are vitamin insufficient if only whole foods are considered.  Notice that when processed foods are taken into consideration, the values are much lower for thiamin, niacin, riboflavin, and folate (open bars).  And supplements don’t add a whole lot to the picture (shaded bars).

Supplements don’t change the big picture very much because, well, who takes supplements?  Healthy people.  Healthy people who are probably already getting enough vitamins and minerals from the whole foods in their diet.  Someone who lives on fast food, soda, and crisps probably doesn’t care enough about their health to swallow a multivitamin every morning.  However, their intake is not suboptimal because they don’t take a multivitamin pill, it’s suboptimal because their diet contains too many empty calories!

TO DO: from whole food sources (i.e., not empty calories), get more:

Magnesium: spinach

Vitamin A: red meat, chicken, spinach, kale

Vitamin C: berries, broccoli, kale, peppers

Vitamin D: salmon/fish, whole eggs, red meat, liver

Vitamin E: spinach, nuts, fish

Potassium: spinach, tomatoes, beans


And while “adequate is adequate,” stop relying on processed foods and start eating more whole foods for:

Folate: foliage (leafy vegetables like spinach), also high in turkey, chicken, beans, etc.

Thiamin: pork, and lesser amounts in liver, whole eggs, nuts

Iron: red meat


processed foods are empty calories.  a processed food that has been chemically fortified with a synthetic vitamin cocktail is still “empty calories” in my book.  And although frank toxicity is rare, processed foods are close to providing too much of certain nutrients, e.g., niacin, vitamin A, folate, and zinc.  Stick to whole foods, and don’t overdo it with your kids- they were more likely than adults to be getting too much zinc, niacin, vitamin A, and folate, and the overage was largely due to processed foods.


Calories proper


more clips from TPMC

Calories in the body are a measure of how much energy a given food provides when it is “burned.” The extent to which this occurs comprises the “metabolic rate.” Let us take, for example, a 160 pound woman who expends 2,000 calories per day. If weight-stable, she is consuming 2,000 calories of food per day, and is creating 2,000 calories of heat per day (that is not a coincidence). The calories expended provide energy for all aspects physical life, breathing, daily activity, walking, eating, etc., etc. Extra calories are used to fuel physical activities, as opposed to non-physical activities such as reading… even if you are reading really, really fast. More intense activities like running or climbing stairs require more energy, and thus burn more calories, relative to lower intensity activities like walking or sitting on the couch. These calories can be derived directly from the food in your most recent meal, or from the body’s storage depots. So, basically, you consume calories in the form of food, and expend calories in the form of mechanical work and heat. That is calorie balance.

TPMC update

The poor, misunderstood calorie is currently under review at my publisher and should be available soon! Check back often as I will post samples.