Category Archives: Dietary fat

what is our proper “natural” diet?

Figuring out how best to eat, physiological insulin resistance, and an homage to pioneering nutrition research.

Insulin resistance, as we know it today, is associated with poor nutrition, obesity, and the metabolic syndrome.  But it’s FAR more interesting than that.  Indeed, it could even save your life.  At the time when the pioneering studies discussed below were occurring, the researchers had no idea insulin resistance was going to become one of the most important health maladies over the course of the following century.  Furthermore, these somewhat-primitive studies also shed some light, possibly, on how we should be eating.  hint: it might all come down to physiological insulin resistance.

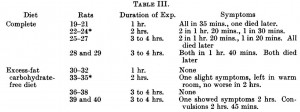
The reduced sensitivity to insulin of rats and mice fed on a carbohydrate-free, excess fat diet (Bainbridge 1925, Journal of Physiology)

Rats were fed either a normal starch-based diet (low fat), or a high butter diet (low carb) for one month, then fasted overnight and injected with a whopping dose of insulin (4 U/kg).  First, take a guess, what do you think happened and why.  Then, click on the table below.

To make a long story short, all the starch-fed rats died while all the butter-fed rats lived.

On a high-fat zero-carb diet, plasma insulin levels are low.  Insulin is low because there no carbs (i.e., it’s supposed to be low).  Under conditions of low insulin, unrestrained adipose tissue lipolysis leads to a mass exodus of fatty acids from adipose tissue.  These fatty acids accumulate in skeletal muscle and liver rendering these tissues insulin resistant.  But this doesn’t matter, because insulin sensitivity is unnecessary when there aren’t any carbs around.  So if that rogue research scientist who’s always trying to jab you with a syringe filled with insulin actually succeeds, you won’t die.  The high-fat diet prevents insulin-induced hypoglycemic death.  This is physiological and absolutely critical insulin resistance.

To determine if this was specific to dairy (butter) or a general effect of a high fat zero carb diet, Bainbridge repeated the experiments with lard.  Lo-and-behold, lard-fed rats were just as fine as those dining on butter.  

To be sure, these studies exhibited a high degree of animal cruelty… but their simplicity is laudable.  And Bainbridge’s findings are not an isolated case.

Studies on the metabolism of animals on a carbohydrate-free diet.  Variations in the sensitivity towards insulin of different species of animals on carbohydrate-free diets (Hynd and Rotter, 1931)

Instead of starch, lard, and butter, Hynd and Rotter used milk and bread, cheese, and casein.  And their findings were essentially identical to Bainbridge’s: mice, rats, or rabbits fed carbohydrate-free diets were insulin resistant and protected against insulin-induced tragedies.

The interesting finding was in kittens, who sadly maintained insulin sensitivity when fed fish (high protein) or cream (high fat).

You’re probably thinking: why would I say any state of heightened insulin sensitivity is “sad?”  WELL, I say “sad” because we’re talking about physiological insulin resistance; a condition when resistance to the hypoglycemic effect of insulin is essential, and lack thereof is incompatible with survival.  To be clear: 1) kittens remain insulin sensitive on high fat and protein diets; and 2) this is OK because there aren’t any rogue research scientists running around trying to jab them with insulin.  While I can’t say for sure, this might have something to do with what kittens are supposed to eat, i.e., their natural diet.  High protein and fat diets won’t make them insulin resistant because unlike rodents, that is their normal diet.  (real mice eat fruits and seeds; laboratory mice eat pelleted rodent chow; cartoon mice eat cheese.)   Lard causes ectopic lipid deposition in insulin sensitive tissues in rodents because they aren’t accustomed to it.  Mice are optimized to eat a high carb diet.  Kittens eat protein and fat, usually in the form of mice.  But when given bread, kittens develop insulin resistance.  There is no bread in mice.

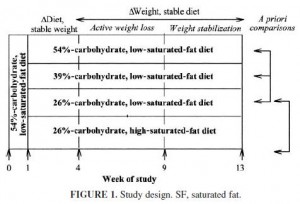
While we shouldn’t base our diet around the possibility of turning a corner and being jabbed with a syringe filled with insulin, perhaps we are simply more similar to kittens.  Hypercaloric diets loaded with sugar, excess carbohydrates, and empty calories cause [pathological] insulin resistance (which could theoretically save your life if a rogue research scientist jabbed you with insulin), whereas the opposite is true for diets high in fat and protein.  This is repeatedly demonstrated in diet intervention studies, most recently in the notorious Ebbeling study (Missing: 300 kilocalories).  When people were assigned to the very low carbohydrate diet, insulin sensitivity was significantly higher than when they were on low fat diets:Soapbox rant: I’m not saying low carb is what we are supposed to eat.  Nor am I saying it is the optimal diet.  IMHO any diet which excludes processed junk food and empty calories is “healthy.”  The Paleo diet isn’t healthy because some nutritionista says it’s what we are supposed to eat; Paleo is healthy for the same reason as Atkins, Zone, South Beach, and a million others: no junk food.

Maybe the diet we’re supposed to eat has nothing to do with the healthiest diet.  Maybe not.  But it probably isn’t bad for you.  just sayin’

calories proper

Coconut flour is a protein & fiber powerhouse, Op. 90

and similar to almond flour, it’s gluten-free and anti-hyperglycemic (i.e., the opposite of white flour).

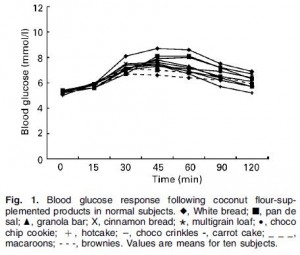
Glycaemic index of different coconut-flour products in normal and diabetic subjects (Trinidad et al., 2003)

In this CROSSOVER study, different doses of coconut flour were incorporated into common test foods to see how they impacted the blood glucose response to said test foods.  The total carbohydrate load of each food was 50 grams and to make a long story short, coconut flour dose-dependently reduced the glycemic index.

There’s a lot happening in that figure, but basically the foods with the least coconut flour (e.g., white bread) elicited far greater increases in blood glucose than foods with the most coconut flour (e.g., coconut flour brownies).  Mechanistically, this is most likely due to coconut flour’s fiber and/or fat content (both of which slow down glucose absorption and both of which are markedly higher in coconut flour compared than white flour).

Coconut flour: anti-hyperglycemic

Moving on,
the lipid component of coconut flour, coconut oil, is kind-of-amazing in itself.

1) Coconut oil is a perfectly suitable substitute for butter if you’re following a casein-free diet (e.g., GFCF).  You don’t need to be a molecular gastronomer or food scientist to try it; refined coconut oil can be used just like butter (“virgin” coconut oil, on the other hand, retains a strong coconut flavor).

2) Coconut oil is rich in the magical ketogenic medium chain fatty acids (e.g., C12 laurate) and to over-simplify a series of very elegant studies on diet and diabetes (detailed in Diet, diabetes, and death [oh my] [highly recommended reading if you’re into fatty acids, etc.]), coconut oil is remarkably protective against diabetic pathophysiology; a property not shared with lard, corn oil, or shortening.

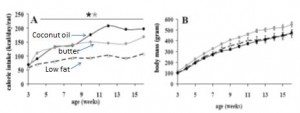
Indirect confirmation of the presence of ketogenic medium chain fatty acids in coconut oil can be seen in this study by Romestaig.  Rats fed a diet rich in coconut oil ate more calories but gained less weight than rats fed a high butter or low fat diet:

Coconut oil-fed rats (solid black circles) ate more than the butter group but weighed less.  Coconut oil-fed rats ate WAY more than the low fat group but weighed just as much.  Nice, huh?  Getting back to the point, this is virtually identical to what happens on bona fide ketogenic diets (see Episode 2 of the ketosis series and Ketosis, III), where carbohydrates are kept below 5% of calories (which is phenomenally low, 25 grams on a 2000 kcal diet).

Coconut flour: anti-hyperglycemic
Coconut oil: ketogenic
Coconut protein ?  … calorie for calorie, coconut flour has more protein than most other flours.

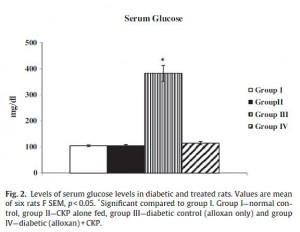
In recent study on diabetic rats, Salil showed that coconut protein completely protected against alloxan-induced diabetes (this study was published in 2011; unlike the earlier studies referenced above, researchers are no longer allowed to give fatal doses of alloxan to rats and count the days until they die.  Nowadays they just look at the surrogate marker blood glucose [it goes up very high in diabetes]).  Alloxan is a pancreatic toxin which destroys insulin-producing beta cells.

Group 1 (open bar) = controls group.  Group II (black bar) = fed coconut protein.  Group III (vertical stripes) = diabetic.  Group IV (diagonal stripes) = diabetic and fed coconut protein.  A diet high in coconut protein made these rats invincible to alloxan… just like coconut oil.  Coincidence?  (to be continued)

Coconut oil and coconut protein are both present in coconut flour.   While it’s not as expensive as almond flour, coconut flour is still pricier than regular white flour.  But people love their baked goods, pastas, and breads.  If there is ever going to be a way for these foods exit the realm of “empty calories,” the first step is abandoning white flour.  Maybe your muffins won’t be so big and fluffy, but neither will your ass.

calories proper


Almonds: nutrition’s coolest drupe, Op. 89

(it’s a “drupe,” not a nut.  [Thank you Wikipedia.])

Should almonds be upgraded from “snack” to food?  Should almond flour be used in place of some or all white flour?  Yes and yes, IMHO.

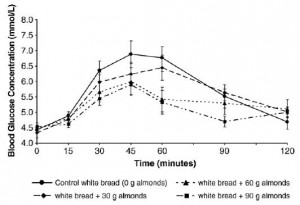
In 2007, Josse and colleagues did a quick-and-dirty study on almonds and glucose tolerance.  They fed a group of volunteers 50 grams of carbs from white bread and either 0, 30, 60, or 90 grams of almonds and then measured blood glucose over the following two hours.  “Quick” because they probably had almonds and bread in the refrigerator, and glucometers in their desk drawers; “dirty” because there were a lot of uncontrolled variables; for example: fiber, protein, and fat content of the test meals differed wildly:In a proper study, they might have tried to feed everyone the same amount of fiber, protein, and fat, because each of these is known to affect blood glucose.  In any case, the result was pretty cool:

Whole almonds dose-dependently blunted the blood glucose response to the test meal.  Conclusion: almonds = anti-hyperglycemic.  But almonds are complex lil’ things; they’re made of protein, fat, fiber, and a lot of nutrients; so what’s responsible for all the anti-hyperglycemic effect?  this post is not simply an academic pursuit; indeed, almond flour and almond oil are commercially available, affordable, widely used, and are comprised of different fractions of the almond.  So Mori and colleagues decided to study.

Acute and second-meal effects of almond form in impaired glucose tolerant adults: a randomized crossover trial.  (Mori et al., 2011)

In this excessively high quality study, the effect of 4 different types of almond preparations on glucose tolerance was assessed.

What was tested (in a FIVE-WAY crossover study):
WA = whole almonds
AB = almond butter
AF = defatted almond flour (remember this stuff? lacks all the bifidogenicity of regular almond flour )
AO = almond oil
V = vehicle: negative control.

Basically, the participants were fed a breakfast of OJ and Cream of Wheat with the equivalent of 33 almonds (42.5 grams) for a total of 75 grams of carbs, and blood glucose was measured over the next 2 hours.

Notable nutritional differences between the almond preparations:  they all contain a similar fat content except for the defatted almond flour; whole almonds and almond butter have 2-3 times more fiber than almond flour and almond oil; almond oil has half the protein as all the others.

In brief, no almond preparation affected insulin or free fatty acids.

Whole almonds, almond butter, and almond oil, on the other hand, all blunted the glycemic response.  Defatted almond flour, which only really differs in its lack of almond fat, did not.  Thus, according to last post, almond fat is a potent bifidogen (i.e., good for gut bacteria); and now we see it’s also responsible for the anti-hyperglycemic effect of almonds.  These two effects are probably unrelated, however, as any effect on gut bacteria will take significantly longer than a few hours as the almond fat hasn’t even reached the large intestine by then… (the anti-hyperglycemic effect is evident within 2 hours; the bifidogenic effect noted by Mandalari was 8-24 hours).

OK, almond fat slows the absorption of glucose, so what? this is not exciting… it’s common among most fats- “dietary fat reduces the glycemic index of food.”  But this has a greater implication: one could alternatively conclude that almond flour’s lack of fiber was at fault, as dietary fiber is also known to slow glucose absorption.  However, almond oil, which has even less fiber than defatted almond flour, was also anti-hyperglycemic.  So it’s not the fiber (… perhaps because almond fiber is predominantly insoluble).

With regard to all-things-almonds: almond fat, not almond fiber, is anti-hyperglycemic and bifidogenic (what can’t it do?).

Almond fat: +2

Solution: whole almonds (with meals?), almond oil (with whatever), and regular [non-defatted] almond flour (for baking?).  WRT the latter, get all the benefits, a boost for the gut microbiota, and significantly fewer carbs than with white flour (while actually attenuating the glycemic impact of said white flour).

An argument for almond flour: most baked goods are made with white flour.  These foods are predominantly empty calories, the bane of human health and well-being.  Substituting almond flour for white flour is one way to decrease the emptiness of those calories, and thus of life itself (it’s gluten-free too).

calories proper

The day almonds became interesting.

Non-sequiter nutrition: Atwater’s almonds, et al., Op. 87

Almonds have been considered a super-food for as long as I can remember.  And in accord with my level of interest in super-foods, I’ve never cared.  Today, however, almonds became interesting. One small serving of almonds (1 ounce or 28 grams) provide ~171 kilocalories (alternatively, 100 calorie packs have, well, 100 kilocalories).  This measurement of a food’s energy content takes into account the amount of heat produced when it is electrocuted in a bomb calorimeter as well as its digestibility.  The importance of taking both of those things into consideration?  Marshmallows and tree bark produce a lot of heat when they burn.  Unlike marshmallows, however, a tree bark smoothie wouldn’t give us any energy because we can’t digest wood.  This is further complicated because digestibility of a food consumed by itself can differ when it’s eaten with a meal.

Usually, and unlike carbs and protein, the digestibility of fat is impeccably high and unvarying.  Almond oil, however, might be an exception in more ways than one.

Discrepancy between the Atwater factor predicted and empirically measured energy values of almonds in human diets (Novotny et al., 2012)

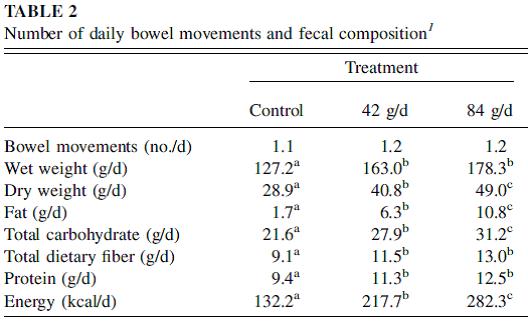
This was a ridiculously complicated study designed to determine the calories in almonds.  It was a three-way crossover with 18-day feedings of 0, 42, or 84 grams of almonds per day (0, 1.5, or 3 ounces per day).  The researchers gave the volunteers ALL of their food for the entire study, and in exchange, the volunteers gave the researchers the byproducts (urine, feces) for the second half of each feeding period.  This is already an expensive and extremely  labor-intensive study, but I think they were trying to do more than just quantify the calories in almonds; I think they were trying to stick-it-to-the-man.

N.B. the almonds were eaten with normal meals.  The diet was normal.  There are no tricks up my or the researcher’s sleeves.  And I’m honestly fascinated by Table 2.

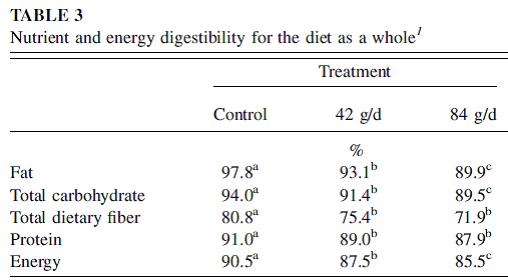
1.5 servings of almonds (42 grams) had a phenomenal effect on food digestibility.  And 3 servings doubled the amount of non-absorbed calories.  In the beginning of the post I noted that a serving of almonds had 171 kilocalories.  But a serving of almonds increases the non-absorbed kilocalories by about 50.  So does this mean we should re-assign a serving of almonds to 121 kcal?

Yes, the authors decided; and I agree.  And I think this sticks-it-to-the-man.  Perhaps this is the source of almond weight loss lore (?)… imagine the fastidious dieter who weighs out 3 servings of almonds for their daily snack, accounts for the 513 kilocalories in their food diary (but is really only getting 357 kilocalories), and they lose weight…  and those 100 calorie packs only have 68 calories.  Ha!

OK, but just out of curiosity which calories aren’t absorbed?  Are almond calories poorly absorbed, or do almonds block the absorption of other nutrients?

From Table 3, it’s probably fat.  Combined with earlier findings from Ellis, it’s probably almond fat that was trapped inside delicious and crunchy cell walls (Ellis et al., 2004).

In brief, Ellis measured almond fat after three treatments:

1)      Mechanically crushing the almonds

2)      Chewing the almonds (and measuring spit-out almond fat)

3)      Eating the almonds (… and measuring accessible fecal almond fat)

The first two methods didn’t release a lot of almond fat, but the third did, by a little.  As opposed to crushing or chewing, after actual digestion, gut microbes degrade the crunchy cell walls to release the almond fat contained therein.  Unfortunately, however, fat absorption is very inefficient in the large intestine (where this is all happening), which is why the almond fat is either fermented or excreted.

So at this point we’ve got more fat, but also more carbs and fiber from the almond cellular structures making their way into the large intestine (on a high almond diet)… what do the resident microbes have to say about all of this?

A lot, according to a series of studies by Mandalari and his robotic gut simulator  (Mandalari et al., 2008).

Unless you are seriously constipated, the bacterial changes after 24 hours of fermentation are irrelevant.  Looking at 8 hours, which is probably more physiologically relevant, gives us this:FOS, fructooligosaccharides; FG, finely ground almonds; DG, defatted finely ground almonds.

Table 2 (above) is, in a word, perplexing.  Whether or not Mandalari set out to stick-it-to-the-man, he sure did (unless that is just a thing with almonds [?]).  Similar to FOS, almonds had a relatively potent bifidogenic effect.  This is not surprising because of almond’s high fiber content.  What was surprising, however, was that this is completely absent in defatted almonds.  The fiber is the same in almonds and defatted almonds, therefore there is something uniquely magical about almond fat and the long series of unfortunate unlikely events that must occur in order for the bifidogenic effects of almonds to manifest.

The unlikely events: the almond fat must first be protected during chewing and digestion, otherwise it would be absorbed in the small intestine, before it made it all the way to the more “microbial” large intestine.  This is accomplished by almond’s robust cell walls.  Almond fat needs to be released in the large intestine; this requires microbes and is therefore less likely to occur in the small intestine (where microbes are less abundant; if there were more microbes in the small intestine, the almond fat would be released and absorbed before it made it into the large intestine).  The almond fat needs to be not absorbed in the large intestine so it can exert its bifidogenic effect; this happens because the large intestine is inherently poor at fat absorption.  Everything must be exactly in place (kind-of-like in M. Night Shyamalan’s “Signs”): almond’s cellular structure, the intestine’s region-specific digestive enzymes, microbial geography, differential fat absorption capacity, etc., etc.  It’s like an astrological event that occurs once every million years.

***

Back to the Novotny (Atwater) study for a moment.  48 grams (1.5 servings) of almonds only provide about 5 grams of fiber, but it increased stool weight by almost half.  Fiber is known to increase “regularity,” but the effect of almonds is pharmacologically disproportionate to it’s fiber content.

According to a review by Ahmad (2010), almond oil improves bowel transit time and reduces the symptoms of irritable bowel syndrome.  Not whole almonds.  Not almond fiber.  Almond oil.  And injecting it might even cure IBS (don’t try this at home; Sasaki et al., 2004).

Is it time for a paradigm switch?  Will almond oil open the door for other fats to be researched for bona fide prebiotic properties, akin to inulin and GOS?

Indeed, almonds became interesting today.

Check out my Patreon campaign! Five bucks a month for full access and there are many other options. It’s ad-free and you can cancel if it sucks 🙂

Consults are open, contact me if you’re interested: drlagakos@gmail.com

Affiliate linksjoin Binance and get some cryptoassets or download Honeyminer and get some Bitcoins for free! And now you can mine Bitcoin from your Chromebook!

Still looking for a pair of hot blue blockers? Carbonshade and TrueDark are offering 15% off with the coupon code LAGAKOS and Spectra479 is offering 15% off HERE. If you have no idea what I’m talking about, read this then this.

20% off some delish stocks and broths from Kettle and Fire HERE

If you want the benefits of  ‘shrooms but don’t like eating them, Real Mushrooms makes great extracts. 10% off with coupon code LAGAKOS. I recommend Lion’s Mane for the brain and Reishi for everything else

Join Earn.com with this link.

Start your OWN Patreon campaign!

calories proper


Missing: 300 kilocalories

or
Weight-loss maintenance, part II (as promised)

Effects of dietary composition on energy expenditure during weight-loss maintenance (Ebbeling et al., 2012)

A three-way crossover study!  Excellent study design.  In brief, the participants lost 30 pounds in 12 weeks on a pseudo-Zone diet (the official version) consisting of 45% carbs, 30% fat, and 25% protein, then switched to one of 3 “weight-loss maintenance” diets for 4 weeks.  (FTR “weight-loss maintenance” cannot even be remotely assessed in 4 weeks, but what the heck, it was a THREE-WAY CROSSOVER.)

To put the issue to bed before it is even raised, the volunteers were given professionally prepared food for about half a year and paid ~$2,500 if they stuck to the plan.  They STUCK to the plan.

or more simply: 

The diets were classified by the authors as high glycemic load (high carb low fat), low glycemic index (e.g., Mediterranean Diet), & low carb (e.g., Atkins Diet).

These “glycemic” indices in general are primarily determined by the carb & fat contents.  A low carb diet will always have a low glycemic index and low glycemic load, and the opposite is true for a low fat high carb diet.  Any high glycemic index food turns into a low glycemic index meal when it’s combined with other foods (like we normally eat).  The only way to make a strictly high GI diet is with low fat; the easiest way to make a low GI diet is with low carb.

The major outcome measurements dealt with energy expenditure, with the premise being that preservation of metabolic rate after weight loss should improve “weight-loss maintenance.”

Resting energy expenditure (REE) is measured by indirect calorimetry.  It’s the amount of calories that a total couch potato would burn daily and is usually determined by body composition (more muscle = higher REE).  While body composition was similar in each group, REE was modestly higher in subjects on the low carb diet.

RQ (respiratory quotient) measures the relative amount of fat and carbs you’re burning: 0.7 = fat oxidation; 1.0 = carb oxidation.  It is determined by diet (eat more carbs, burn more carbs), body composition (have more body fat, burn more body fat), and exercise intensity (marathons burn fat; sprints burn carbs).  The higher carb oxidation on the low fat diet and higher fat oxidation on the low carb diet likely reflect the respective dietary compositions.


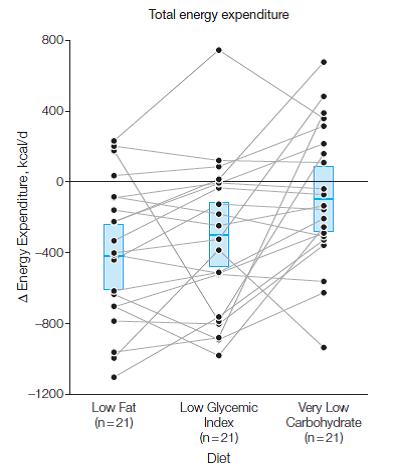
Total energy expenditure (TEE) is exactly what its name implies.  It’s the total amount of calories you burn in a day.  If your body weight is stable, then this is also approximately how many calories you’re eating.  This result is actually pretty interesting.  TEE on the low carb diet was over 300 kcal higher relative to the low fat diet.  This is probably at least partially due to the higher protein content of the diet (30% vs. 20% of total calories or 150 vs. 100 grams per day).  TEE of the intermediate low GI diet was in between low fat and low carb diets (2937 kcal/d), so TEE increased as carb intake declined and fat intake increased across all 3 diet groups.  Follow the blue boxes in the figure below to see the averages, and since this was a THREE-WAY CROSSOVER (!), you can follow the lines to see how each person fared individually:

300 kcal is equivalent to an hour of exercise, yet subjects on low carb weren’t exercising more (although the slowly-losing-his-wits-Dr Bray suggested otherwise in an editorial, arguing that the increased TEE/REE ratio meant increased physical activity, despite the actual data, which showed if anything, slightly lower total and moderate-vigorous intensity physical activity in the low carb group).

Burning an additional 300 kcal per day is like losing over 2 pounds of fat per month by doing exactly nothing.  BUT

to be clear (e.g., disclaimer, mea culpa, evidence of heresy, etc.):

  1. all participants in the study ate the same amount of calories
  2. low carbers burned over 300 more calories per day compared to low fat dieters
  3. body composition  and body weight were similar between the groups

300 calories per day is a LOT of calories, why didn’t it impact weight loss?

This seemingly paradoxical conclusion suggests energy intake is the primary determinant of weight loss, independent of energy expenditure and diet composition.  It is either a violation of The Laws of Energy Balance, experimental error, or evidence of dark magic.

Moving on,

the authors were quick to note urinary cortisol (an anti-inflammatory and stress hormone) and CRP (a marker of systemic inflammation) were highest on low carb, and this could cause insulin resistance.  However, I’d note 2 things: 1) CRP declined in ALL groups relative to baseline, but the reduction was less in low carbers compared to the other groups; and 2) CRP was low and within the normal range in all subjects throughout the entire study. But most importantly, hepatic and peripheral insulin sensitivity improved most in low carbers, in whom CRP and cortisol was the highest.

Similar to the Jakubowicz study (dessert for breakfast), the Ebbeling study was interesting but not groundbreaking; nothing to write home about.  Both showed modest benefits for low carb over low fat.  The news media haven’t feasted on these studies yet, but when they do, however, I’m sure they’ll disagree.  “Weight-loss maintenance” is a riddle wrapped in a mystery inside an enigma, not a simple question to be elucidated by a mere 4-week diet study, even if it’s a three-way crossover.  even if it has dark magic.

If you’d like to consult with me, reach out: drlagakos@gmail.com.

Check out my Patreon campaign! Five bucks a month gets you full access and there are many other options. It’s ad-free and you can quit if it sucks 🙂

Affiliate links: Still looking for a pair of hot blue blockers? TrueDark is offering 10% off HEREand Spectra479 is offering 15% off HERE. If you have no idea what I’m talking about, read this then this.

Join Binance and get some cryptoassets or download Honeyminer and get some Bitcoins for free

20% off some delish stocks and broths from Kettle and Fire HERE

If you want the benefits of  ‘shrooms but don’t like eating them, Real Mushrooms makes great extracts. 10% off with coupon code LAGAKOS. I recommend Lion’s Mane for the brain and Reishi for everything else

Join Earn.com with this link.

Start your OWN Patreon campaign!

calories proper


Save

Don’t eat doughnuts for breakfast, Op. 85

or
Weight-loss maintenance, part 1

“Weight-loss maintenance” is a critical part in the battle against obesity because losing weight is much easier and significantly more successful than keeping it off.  The difference lies predominantly in duration: a few months of dieting to lose weight vs. keeping it off for the rest of your life.  Two diet studies on the topic were recently published, and while neither study really addressed the issue proper, some interesting points can be gleaned from both.

Study #1

Meal timing and composition influence ghrelin levels, appetite scores and weight loss maintenance in overweight and obese adults (Jakubowicz et al., 2012)

16 weeks of weight loss followed by 16 weeks of “weight-loss maintenance.”

In brief, the weight loss was accomplished by one of two hypocaloric (1400 kcal/d) isocaloric pseudo-Dukan Diets (higher protein & lower fat than Atkins)

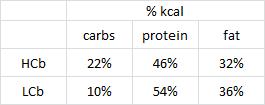
The catch:  Breakfast for the people in HCPb (High Carbohydrate and Protein breakfast)  had twice the calories, 6x the carbs, and half more protein than LCb (Low Carb breakfast).  This was compensated, calorically, by a much smaller dinner.  In other words, they ate like a King for breakfast, a Prince for lunch, and a Pauper for dinner… with the added bonus of a “sweet food… chocolate, cookies, cake, ice cream, chocolate mousse or donuts.”  For breakfast.

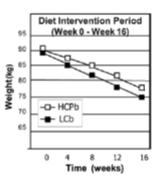
People in both groups lost roughly similar amounts of weight in the weight loss phase:

During the first 16 weeks (weight loss phase), a strict 1400 kcal diet was implemented.  During the second 16 weeks (“weight-loss maintenance” phase), macronutrient composition was supposed to be kept similar, but subjects were “free to eat as motivated by hunger or cravings.”  Critique #1a: this study would’ve greatly benefitted by food intake questionnaires to know more accurately what these people were eating; the importance of this becomes more apparent soon.

At three times throughout the study (baseline, week 16, and week 32), a “Breakfast meal challenge” was administered to assess Hunger, Hatiety, and Food Cravings.  Unfortunately, however, the “Breakfast meal challenge” was administered… after… breakfast.  HCPb binged on a high calorie 3-course meal which included dessert while LCb nibbled on a lite breakfast… And the researchers needed a 100-millimeter Visual Analog Scale and 28-item Food Craving Inventory Questionnaire to figure out who would be hungrier afterwords?  Really?

Divide and conquer

Table 2.  There were no major differences between the groups, and between those who completed or didn’t complete the study except for weight loss in those who withdrew.  Apparently, people who didn’t lose any weight on the hypocaloric weight loss diet decided to quit (was it the diet or the dieter that didn’t work? [sorry, no offense]).  In any case, this would’ve introduced a systematic bias except the non-weight-losers were similar in both diet groups.  But Hunger & Satiety was also similar between completers and dropouts… I wonder why…  i.e., the diet was working for those who were losing weight, because Hunger was low and Satiety high; in the dropouts who didn’t lose weight, Hunger was low and Satiety high because they were eating more (which is why they didn’t lose weight).  IOW: “not hungry -> eat less -> lose weight -> complete the study” vs. “eat more -> not hungry -> don’t lose weight -> dropout of the study.”  People are “not hungry” in both groups, but for different reasons.

Critique 1b: this is another place where a food intake questionnaires would come in handy.

During the weight loss phase, LCb lost a little bit more weight and became a little bit more insulin sensitive than HCPb, which is interesting only because the macronutrients were so similar.  Thus, it may have been an effect of “meal-size-timing.”  In other words, don’t eat like a King for breakfast, a Prince for lunch, and a Pauper for dinner.

Ghrelin, a hunger hormone, was significantly higher in LCb and this actually correlated very well with measured Hunger levels (unlike leptin, the far more popular anti-hunger hormone, discussed in depth HERE).  And insulin, a theorized yet controversial hunger hormone, did not: insulin was lower at week 16 while Hunger was 2x higher; and insulin was 2x higher at week 32 compared to week 16 while Hunger was the same at those time points (Table 3).  Thus, for those interested (which is admittedly probably only me), neither leptin nor insulin correlate with Hunger levels; but this study showed that ghrelin does.  Furthermore, similar to those leptin data mentioned above, Hunger was not correlated with weight loss (which is kind-of-fascinating).

The second half of the study (“weight-loss maintenance”) was complete bollocks and made no sense whatsoever (you’ll see it on the evening news).  What you can conclude from this study, however: people following the moderately higher protein and lower carb pseudo-Dukan Diet (LCb) lost modestly more weight during the first 16 weeks than those following the more traditional higher carb version (HCPb).  BOTH diets were “high protein” and “low carb,” and people in BOTH groups lost a lot of weight (~30 pounds in 4 months).  The media hasn’t had their way this study [yet], but when they do, I’m sure the they’ll disagree.

Don’t eat doughnuts for breakfast, you heard it here first.


calories proper
XL soda ban, Op. 80

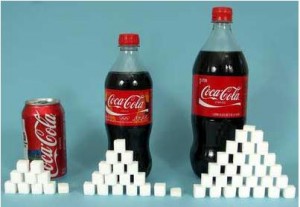
People have been warned about the dangers of excess sugar consumption, but compared to the anti-smoking campaign, the recent proposal to ban XL soda’s is like bringing a cup of water to a forest fire.

In an ideal world, a proper health initiative designed to provide people (kids too) with good nutrition information would work. The new proposal takes a different route: it bans the sale of soda’s larger than 16 ounces (but you can still buy 2-12 ouncers).  I see two possible outcomes: 1) someone who would’ve bought one 24 ouncer of soda might settle for 16 ounces; 2) the one in a million customer who wanted 24 ounces will walk away with two 12 ounce sodas instead.  Win-win, right?  In the first case, the toxic sugar burden is lessened by a third.  In the second, a potentially valuable lesson on “serving size” will be on display.   Serving size 2.0, in 3-D, spelling-it-out for all to see.

It might actually work.  From a nutritional perspective, 90 grams of highly bioavailable sugar (HFCS) is a biological disaster.  Pound for pound, there aren’t many worse things you can consume… it’s the anti-thesis of “moderation.”  Regardless of your stance on the calorie debate, no one can argue that 90 grams of sugar all-at-once is more detrimental than it’s caloric content would imply.  Even for skinny people (metabolic obesity?).  It’s worse than dietary fat, and  might be THEE cause of leptin resistance.

This isn’t a TPMC original, but this graph of soda, diabetes, and obesity is just about as compelling as epidemiology can be:


douse those sugar cubes with artificial flavors, colors, and preservatives, and we’re good to go

If the ban goes into effect and actually impacts sales, will there be a backlash? more food company lobbying?  increased government subsidies (reduced HFCS consumption -> more taxpayer dollars used to cover the losses)?  Who knows.  If it teaches people a lesson about serving size or empty calories it might be worth it.

calories proper

the opposite of food, Op. 76

Processed non-junk food

or

as close to “non-junk” as processed food can be

Notice the inverse relationship between fat content and the number of ingredients in these three commercially available sour cream products.  This is processed food.

Regular:
Cultured pasteurized grade A cream and milk, enzymes.

Low-Fat:
Cultured Milk, Cream, Nonfat Dry Milk, Whey, Modified Corn Starch, Sodium Phosphate, Guar Gum, Carrageenan, Calcium Sulfate, Locust Bean Gum, Gelatin, Vitamin A Palmitate.

Fat Free:
Cultured Low-fat Milk, Modified Corn Starch, Whey Protein Concentrate, Propylene Glycol Monoester, Artificial Color, Gelatin, Sodium Phosphate, Agar Gum, Xanthan Gum, Sodium Citrate, Locust Bean Gum, Vitamin A Palmitate.


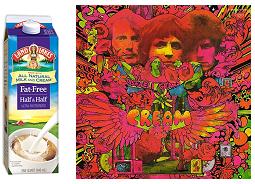
Fat-Free Half & Half

not cream

In general, “Half & Half” refers to a 50:50 blend of whole milk and cream.  People think it’s better than cream because it has less fat.  Whole milk is about 3% fat by weight, while cream is about 30%.  Mix ‘em together and you end up with Half & Half, which is somewhere in between (12-14%).  Fat has a profound effect on flavor and texture… so how exactly does “Fat-Free Half & Half” taste and feel just like regular Half & Half?!?  Muah ha ha ha haaaa!

divide and conquer

From what I can gather, the fat is replaced with corn syrup and pharmaceutical grade thickeners, emulsifiers, etc., scientifically engineered to mimic the precise flavor and texture of Half & Half.  There are even artificial colors added to make it look like cream.  There are artificial colors added to make it look like cream?  AYFKM?  For some reason, I find this oddly offensive.  It is to these artificial colors which I object.  I want this concoction (that is advertised as better than cream) to look like whatever “corn syrup, carrageenan, sodium citrate, dipotassium phosphate, mono and diglycerides, and vitamin A palmitate” looks like.  And it should release a pale green mist upon contact with coffee.

The sugar in Fat-Free Half & Half comes from corn syrup, while that in real dairy is lactose.  Glucose is sweeter than lactose, and there’s 2-3x more sugar in Fat-Free Half & Half.  Does this mean people use less of it?  I doubt it, because the additional sweetness is probably necessary to compensate for the lack of fat.

And what about all the other additives in Fat-Free Half & Half?  This is reminiscent of the introduction of trans fats into our diet by way of replacing butter and lard with margarine and shortening…

Carrageenan is partially responsible for improving the mouthfeel and texture of Fat-Free Half & Half.

carrageenan. Looks scary, right?

At high doses, it’s an inflammatory gut irritant.  Given coffee’s not-so-gut-friendly reputation, do you really want to push it with carrageenan?

On another note, carrageenan is used to design some of the most beautifully artistic desserts.

In this context, I’m reminded of the phrase: “the dose makes the poison.”  In other words, those dishes are a dietary rarity, reserved for the most special of occasions.  At that level of exposure, it could be a blend of carrageenan, trans fat, sucrose, and Red #40, you could eat 5 of them at a time, and you’d never experience any malevolent effects.  But what about a few tablespoons in your coffee every morning for 30 years???  (alternatively, perhaps I’m underestimating carrageenan exposure a bit) (other, more sordid uses of carrageenan)

Avoid processed foods, especially when they’re no more convenient or healthy their conventional counterparts.


calories proper


P.S.  Perhaps I was a little too hard on Fat-Free Half & Half.  It’s not as bad as microwave popcorn, or this classic:

One 43 gram Twinkie contains 5 grams of fat, 25 grams of sugars, 1 gram of protein, no fibre, 150 kcal, and over 35 ingredients:

  • Enriched Wheat Flour – enriched with ferrous sulphate, B vitamins (niacin, thiamine mononitrate, ribofavin and folic acid).
  • Sugar
  • Corn syrup
  • Water
  • High fructose corn syrup
  • Vegetable shortening – containing one or more of partially hydrogenated soybean, cottonseed or canola oil, and beef fat.  [trans fat]
  • Dextrose
  • Whole eggs
  • Modified corn starch
  • Cellulose gum
  • Whey
  • Leavenings (sodium acid pyrophosphate, baking soda, monocalcium phosphate)
  • Salt
  • Cornstarch
  • Corn flour
  • Corn syrup solids
  • Mono and diglycerides
  • Soy lecithin
  • Polysorbate 60
  • Dextrin
  • Calcium caseinate
  • Sodium stearol lactylate
  • Wheat gluten
  • Calcium sulphate
  • Natural and artificial flavours
  • Caramel colour
  • Sorbic acid (to retain freshness)
  • Colour added (yellow 5, red 40)


The easy diet diet, Op. 72

Regular followers of this blog (all 3 of you) know I think positively about carbohydrate-restricted diets.  In randomized controlled intervention studies, low-carb diets are a little better most of the time compared to low calorie and low fat diets (note the italics).  They are healthier and there is probably no end to the benefits of chronically lower insulin levels.  The only relevant disadvantage is that [I thought] such a diet requires too big of a change for most peoples lifestyle…  however, this might not be the case.  In light of some recent [relatively unscientific] findings, that change might not be so big after all.

In one study, Feinman and colleagues (Feinman et al., 2006 Nutrition Journal) surveyed a group of low carb dieters from the “Active Low-Carber Forum” about their diets.  There was no formal subject recruitment or randomization; it was just a bunch of people who were following various low carb diets.  The only requirement was that they were actually following a low carb diet for weight loss.  For starters, there were a LOT of people who lost a LOT of weight: 62% of ~86,000 participants lost at least 30 pounds and kept it off for over a year (I know I know, it’s possible that people who lose a lot of weight are selectively more likely to participate on this particular forum [this study is confounded out the wazoo but still had a few pearls]).

What I found most interesting was what these people said were their biggest dietary changes.  The top 2 were, not surprisingly, avoiding sugar and starch.  Number 3 was drinking more water.  So to sum up the top 3 changes: basic healthy dieting 101; not drastic lifestyle alterations.

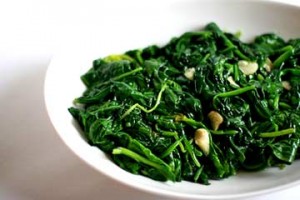
Number 4 was the biggie: most people increased their green vegetable intake by over half… not bacon, hot dogs, and red meat… leafy greens.  This is great (just think of all those micronutrients).  They weren’t counting calories or replacing everything in their refrigerator; they were avoiding sugar and eating more leafy greens.

leafy greens: winner

sounds easy, right?  Of course eating more protein and fat also occurred, but it wasn’t a universal requirement: only 5% reported increasing beef, butter, and bacon… instead, people just ate a little more of whatever was most convenient for their lifestyle.

This study changed my view.  These people lost over 30 pounds on low carb and kept it off for over a year without making any huge changes.

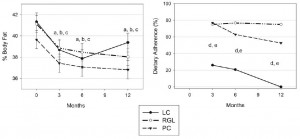
Another more recent study (Kirk et al., 2012 Journal of Pediatrics) was a diet intervention study in obese children.  They compared a low carb diet (LC), low glycemic index diet (RGL), and a portion controlled diet (PC).

It’s hard to put kids on a low carb diet.  Indeed, adherence to the low carb diet was horrific, less than 30% at 3 months and down to 20% at 6 months (figure below on the right).  But comparing this to the figure on the left is astonishing.  Despite adherence of only around 25%, low carb dieters had the biggest reduction in body fat.  It’s not until adherence was nil that the kids starting gaining weight back.

weight loss vs. adherence

What does this say about low carb?  it’s the easiest diet in the world, even if you can barely follow it!  25% adherence to a low carb diet resulted in greater fat loss than 80% adherence to the other diets.

You might just be better off half-assing a low carb diet than strictly adhering to any another one-

calories proper

Taxes, saturated fat, and HDL, Op. 71

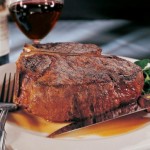
Since red meat won’t kill you (it will make you stronger), why is taxing saturated fat still up for discussion?  The Danish proposal will add a $1.32 per pound to foods with >2.3% saturated fat; the cost of butter will increase by 30% more and olive oil by 7.1%.  I know, right?  WTF?
Again, I don’t think taxation is the solution, but for the sake of comparison: Arizona’s proposed “fat fee” would cost an extra $50 annually for childless obese patients; Rhode Island’s $0.01/oz of soda; or France’s 3.5% tax on all sugar-sweetened beverages.
Nutritionally speaking, saturated fat should be off the political chopping block; any intervention designed to reduce its consumption will do more harm than good.  In brief, here’s one example of what might happen if it worked, i.e., if dietary saturated fat consumption was reduced:

The effect of replacing dietary saturated fat with polyunsaturated or monounsaturated fat on plasma lipids in free-living young adults (Hodson et al., 2001 EJCN)

Subjects were given a high saturated fat diet and then switched to either a high polyunsaturated fat diet (trial I) or high monounsaturated fat diet (trial II).  In both cases, as seen in the table below, HDL decreased.


Alternatively, here’s what might happen if dietary saturated fat consumption was increased (in brief):

Separate effects of reduced carbohydrate intake and weight loss on atherogenic dyslipidemia (Krauss et al., 2006 AJCN)

The bottom two groups in the chart above ate similar diets except monounsaturated fats were replaced by saturated fats in the last group.

As seen in the table below, saturated fat significantly increased HDL.


So did weight loss, but I’d choose a steak over a stairmaster any day…  (daydream thought bubble: “indeed, ‘adherence’ and ‘compliance’ would be things of the past”)


If you believe HDL is important, taxing saturated fat might be a bad idea.  unless you have stock in statins.


calories proper