Category Archives: Dietary fat

Chris Gardner strikes again!

Weight loss on low-fat vs. low-carbohydrate diets by insulin resistance status among overweight and obese adults: a randomized pilot trial (Gardner et al., 2015)


diet compositions


Low carb diet: participants went from 230 grams/d to less than 50 for the first 3 months, then creeped up to ~80 over the next 3 months.

Will the critics say “the carbz weren’t low enough!”?  REALLY?


Continue reading

AMYLIN

Brief background reading: amylin (according to Wikipedia)


In a study by Hollander on type II diabetics, the synthetic amylin analog pramlintide was tested (Hollander et al., 2003).  In this year-long RCT, over 600 patients were treated with placebo or up to 120 ug pramlintide BID (twice per day).  On average, these subjects were obese (BMI 34), diabetic for ~12 years, and had an HbA1c of 9.1%.  After one year, HbA1c declined 0.62% and they lost about 1.4 kg… not very impressive.


But it’s not all bad news; after viewing those relatively negative results (3 lb weight loss over the course of 1 year), another group of researchers led by Louis Aronne and Christian Weyer believed amylin had yet to be tested proper.  So they designed a better study; it was shorter, used higher doses of pramlintide, and they enrolled obese yet non-diabetic patients (Aronne et al., 2007).  They opted for higher doses of pramlintide (240 ug TID [three times per day]) because in dose-escalation studies, the incidence and severity of adverse drug reactions was consistently low at all doses tested.


They chose to study obese-er subjects (BMI 38, compared to 34 in the Hollander study) because obese subjects lose fat more readily than lean people, so if the study is designed to measure fat loss, then it is better to select a population of subjects where more fat loss is predicted.  They selected non-diabetic subjects for a similar reason; diabetics must regularly inject insulin which promotes the accumulation of fat mass — this could counteract any fat reducing effects of pramlintide.
In other words, it was a more powerful and better designed study.


After 16 weeks, pramlintide-treated subjects lost an average of 3.6 kg (~8 lbs), or about half a pound per week.  30% of patients lost over 15 pounds (1 lb/wk)!  Importantly, the weight loss didn’t appear to have reached a plateau by week 16, so it would have most likely continued along a similar trajectory had the study been longer.  There were no side effects, and a battery of psychological evaluations showed that the patients receiving pramlintide felt it was easier to control their appetite and BW, they didn’t mind the daily injections, and overall well-being increased.  At the very least, these evaluations meant the subjects weren’t losing weight because of nausea or malaise.  In fact, it was quite the opposite.


Continue reading

Ketone supps

1st Generation: ketone salts.  Only problem is the huge dose of salt limits how much you can take without adverse effects… but these are the ones on the market.


2nd Generation: ketone esters.

Advantage: no salt, and probably “slow-release.”

Disadvantage: gonna be WAY more expensive than the salts (which are still pretty expensive).


~40 grams of (R)-3-hydroxybutyl (R)-3-hydroxybutyrate (a ketone ester) (from Clarke et al., 2013):


ketone ester


They did this thrice daily, so some people were getting up to 170 grams.

ONE HUNDRED SEVENTY GRAMS


[keep that number in mind]


Continue reading

Tissue-specific fatty acid oxidation

Does it matter where fatty acids are oxidized, liver or skeletal muscle?  Of course, they’re oxidized in both tissues (quantitatively much more in the latter), but relative increases in one or the other show interesting effects on appetite and the regulation of fat mass [in rodents].

Warning: a lot of speculation in this post.

A LOT.

It’s known that LC diets induce a spontaneous decline in appetite in obese insulin resistant patients.  Precisely HOW this happens isn’t exactly known:  the Taubes model?  improved leptin signaling?  probably a little bit of both, other mechanisms, and possibly this one:


Exhibit A. Oxfenicine


oxfenicine

Continue reading

Muscle growth sans carbs

1.  net muscle growth = synthesis – breakdown

2.  need =/= optimization

3.  #context


muscle sans carbs


I’m totally cool with keto, honestly!  but still don’t really like seeing stuff like the above graphic and people interpreting it to mean “KETO IS MUSCLE-SPARING.”


Continue reading

Personalized Nutrition II

More on Zeevi et al. (2015) (this is a follow-up to part 1)

I like this study a lot, or at least the fundamentals… or new tools that it might bring to the table.  Like, we know sleep and physical activity are important, and we know all calories aren’t created equal.  This study is the next level, showing there are even big differences in specific carb-rich foods depending on who’s eating them.

And more interestingly, if I’m interpreting the results of the intervention study correctly (which may not be the case), gut microbial responses to specific foods were very individualized… and predictable!

But first, the main part of the study — standardized meals (after overnight fast): 50g carbs from glucose, white bread, bread and butter, bread and dark chocolate, and fructose.  All repeated at least once (except fructose).  Everyone responded pretty similarly to fructose (little to no blood glucose spike), but a wide range of responses to glucose.

PPGR = PostPrandial Glucose Response


glucose and fructose


Bread:


bread


The range of PPGR to bread was ~15 to 79!

Again, here are some of the findings I found most interesting (besides the huge range in glycemic response to bread):


banana and cookie


Participant #468 has a consistently higher response to glucose than to white bread.  Participant #663 is the opposite.  And participant #445 is still winning.

I truly wonder if there’s a gut microbe (or something) that’s involved here…


Continue reading

Personalized Nutrition by Prediction of Glycemic Responses

“please stop asking gurus how many carbs you need to optimize health”


bananas cookies

An interesting paper came out recently by Zeevi et al. (2015), showing, in part, that we’re all unique snowflakes (in some contexts).


#context

#context


Mini-rant: this study is in line with a lot of my beliefs about individuality in human biology.  We don’t know all the mechanisms, but we do know that some people respond better to some interventions than others.  We learn a lot from studies on diet, light, sleep, physical activity, etc., but the findings rarely/never apply equally to everyone (and some people experience completely opposite effects; eg, see studies where individual data are reported).  LIGHT exposure can improve sleep quality in some but cause agitation in others.  Low carb diets can help weight loss in some people but low fat is better for others.  Dairy, wheat, protein, the ‘biome, and fibre/resistant starch all fall into this category.  Sleep ‘requirements’ vary by person, season, geography, etc., etc…  there’s no QED answers in many of these contexts.

anecdote: some people say they’ve never had better blood glucose than when they were having a few servings of beans/legumes per week; others just report bloating & farts (no bueno).

End rant.

Background reading:

  1. The Atlantic ran a decent piece on this study (certainly more colorful than my take)
  2. Reddit AMA with some of the people involved in the study


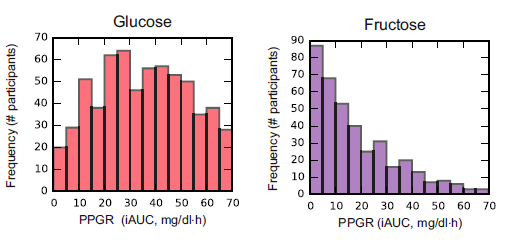
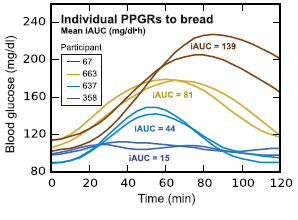
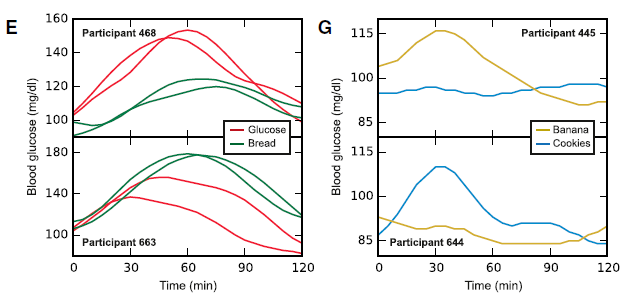
In this particular study (video summary below): they continuously monitored the blood glucose responses in 800 people to all of their meals for a week, including a variety of test meals.  Main result: many different responses, even to the same foods!  An oversimplified example: some people had smaller relative postprandial glucose excursions after 50g carbohydrate from rice compared to 50g carb from potatoes, and other people responded oppositely.  And friggin’ tomatoes?!

Translation: need to move beyond recommending #IIFYM.

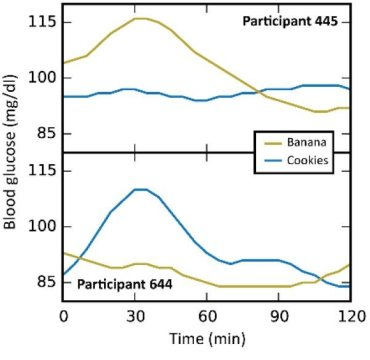
Some foods were universally well-tolerated [in this population] in the context of mixed meals, like quinoa and salmon; other foods did the opposite, like chocolate chip cookies and sushi.  And lastly, some foods like cottage cheese and hummus were good for some people but others.


bananas cookies[participant 445 is winning]


*In general, I don’t believe in labeling foods as categorically good or bad, which is pretty much confirmed by this study, but some patterns emerged wrt postprandial glucose excursions in this population…

#context


Continue reading

The “Insulin Index”

Similar to the glycemic index, which is an estimate of the rise in blood glucose after eating a particular food, the insulin index is an estimate of the rise in insulin after eating a particular food.  In general, these indices are obvious: processed carbs have high glycemic and insulin indices, whereas whole foods are lower.  Some exceptions are things like dairy and lean meat, which induce more insulin than you’d expect given to their low carbohydrate content…

STORY TIME

When some protein-rich foods were discovered to induce insulin secretion, people thought this information might help type 1 diabetics more accurately calculate their insulin dose.  Interesting rationale, worth testing.

Tl;dr: it didn’t work very well.

More of the protein-derived amino acids may have been incorporated into lean tissue, but the extra insulin load ended up causing hypoglycemia more often than not.  Hypoglycemia is acutely more harmful than hyperglycemia, and is still quite harmful in the long-term.  Some studies on incorporating the insulin index for type 1 diabetics are mixed, ie, increased or no change in risk of hypoglycemia, but no studies show it reduces the risk.


Continue reading

Hall et al., THE FIRST SIX DAYS (update)

Some people say the study design was rigged to favor the Low Fat diet (LF), which is dirty business but not exactly criminal; sometimes, this happens in science.

The claims go something like this: baseline diet was so high in carbs that they were locked into making unreasonable adjustments to formulate isocaloric low fat and low carb diets; eg, fat was too low in the low fat diet and carbs weren’t low enough in the low carb diet.

The biggest finding was “Fat Imbalance,” which favored LF.  Here’s why I don’t think the baseline diet mattered very much.

Tl;dr: drastically cutting fat intake (LF diet) is much more effective than upregulating fat oxidation (LC diet) to create a large Fat Imbalance in an acute setting, ie, THE FIRST SIX DAYS.

Continue reading

A brief explanation of Hall et al., ie, THE LOW CARB WAR

“Examination of acute shifts in energy balance by selectively reducing calorie intake from one macronutrient.”

Intro (1/2): please don’t read this study with the media headlines in your mind.  Don’t even pay any attention to the study’s title, abstract, intro, and discussion.  In no way did this study put low carb proper on the chopping block, regardless of what you’ve seen online or elsewhere.  Mmmkay?


Intro (2/2): if you want a lesson (or refresher) in Advanced Nutrition, check out the Supplemental Information: in formulating his mathematical models, Dr. Hall seemingly reviewed every single biochemical pathway and physiological variable ever invented.  Read it, for science.  Really.


Continue reading