Category Archives: Protein

Missing: 300 kilocalories

or
Weight-loss maintenance, part II (as promised)

Effects of dietary composition on energy expenditure during weight-loss maintenance (Ebbeling et al., 2012)

A three-way crossover study!  Excellent study design.  In brief, the participants lost 30 pounds in 12 weeks on a pseudo-Zone diet (the official version) consisting of 45% carbs, 30% fat, and 25% protein, then switched to one of 3 “weight-loss maintenance” diets for 4 weeks.  (FTR “weight-loss maintenance” cannot even be remotely assessed in 4 weeks, but what the heck, it was a THREE-WAY CROSSOVER.)

To put the issue to bed before it is even raised, the volunteers were given professionally prepared food for about half a year and paid ~$2,500 if they stuck to the plan.  They STUCK to the plan.

or more simply: 

The diets were classified by the authors as high glycemic load (high carb low fat), low glycemic index (e.g., Mediterranean Diet), & low carb (e.g., Atkins Diet).

These “glycemic” indices in general are primarily determined by the carb & fat contents.  A low carb diet will always have a low glycemic index and low glycemic load, and the opposite is true for a low fat high carb diet.  Any high glycemic index food turns into a low glycemic index meal when it’s combined with other foods (like we normally eat).  The only way to make a strictly high GI diet is with low fat; the easiest way to make a low GI diet is with low carb.

The major outcome measurements dealt with energy expenditure, with the premise being that preservation of metabolic rate after weight loss should improve “weight-loss maintenance.”

Resting energy expenditure (REE) is measured by indirect calorimetry.  It’s the amount of calories that a total couch potato would burn daily and is usually determined by body composition (more muscle = higher REE).  While body composition was similar in each group, REE was modestly higher in subjects on the low carb diet.

RQ (respiratory quotient) measures the relative amount of fat and carbs you’re burning: 0.7 = fat oxidation; 1.0 = carb oxidation.  It is determined by diet (eat more carbs, burn more carbs), body composition (have more body fat, burn more body fat), and exercise intensity (marathons burn fat; sprints burn carbs).  The higher carb oxidation on the low fat diet and higher fat oxidation on the low carb diet likely reflect the respective dietary compositions.


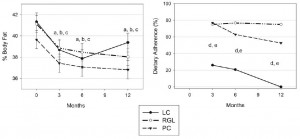
Total energy expenditure (TEE) is exactly what its name implies.  It’s the total amount of calories you burn in a day.  If your body weight is stable, then this is also approximately how many calories you’re eating.  This result is actually pretty interesting.  TEE on the low carb diet was over 300 kcal higher relative to the low fat diet.  This is probably at least partially due to the higher protein content of the diet (30% vs. 20% of total calories or 150 vs. 100 grams per day).  TEE of the intermediate low GI diet was in between low fat and low carb diets (2937 kcal/d), so TEE increased as carb intake declined and fat intake increased across all 3 diet groups.  Follow the blue boxes in the figure below to see the averages, and since this was a THREE-WAY CROSSOVER (!), you can follow the lines to see how each person fared individually:

300 kcal is equivalent to an hour of exercise, yet subjects on low carb weren’t exercising more (although the slowly-losing-his-wits-Dr Bray suggested otherwise in an editorial, arguing that the increased TEE/REE ratio meant increased physical activity, despite the actual data, which showed if anything, slightly lower total and moderate-vigorous intensity physical activity in the low carb group).

Burning an additional 300 kcal per day is like losing over 2 pounds of fat per month by doing exactly nothing.  BUT

to be clear (e.g., disclaimer, mea culpa, evidence of heresy, etc.):

  1. all participants in the study ate the same amount of calories
  2. low carbers burned over 300 more calories per day compared to low fat dieters
  3. body composition  and body weight were similar between the groups

300 calories per day is a LOT of calories, why didn’t it impact weight loss?

This seemingly paradoxical conclusion suggests energy intake is the primary determinant of weight loss, independent of energy expenditure and diet composition.  It is either a violation of The Laws of Energy Balance, experimental error, or evidence of dark magic.

Moving on,

the authors were quick to note urinary cortisol (an anti-inflammatory and stress hormone) and CRP (a marker of systemic inflammation) were highest on low carb, and this could cause insulin resistance.  However, I’d note 2 things: 1) CRP declined in ALL groups relative to baseline, but the reduction was less in low carbers compared to the other groups; and 2) CRP was low and within the normal range in all subjects throughout the entire study. But most importantly, hepatic and peripheral insulin sensitivity improved most in low carbers, in whom CRP and cortisol was the highest.

Similar to the Jakubowicz study (dessert for breakfast), the Ebbeling study was interesting but not groundbreaking; nothing to write home about.  Both showed modest benefits for low carb over low fat.  The news media haven’t feasted on these studies yet, but when they do, however, I’m sure they’ll disagree.  “Weight-loss maintenance” is a riddle wrapped in a mystery inside an enigma, not a simple question to be elucidated by a mere 4-week diet study, even if it’s a three-way crossover.  even if it has dark magic.

If you’d like to consult with me, reach out: drlagakos@gmail.com.

Check out my Patreon campaign! Five bucks a month gets you full access and there are many other options. It’s ad-free and you can quit if it sucks 🙂

Affiliate links: Still looking for a pair of hot blue blockers? TrueDark is offering 10% off HEREand Spectra479 is offering 15% off HERE. If you have no idea what I’m talking about, read this then this.

Join Binance and get some cryptoassets or download Honeyminer and get some Bitcoins for free

20% off some delish stocks and broths from Kettle and Fire HERE

If you want the benefits of  ‘shrooms but don’t like eating them, Real Mushrooms makes great extracts. 10% off with coupon code LAGAKOS. I recommend Lion’s Mane for the brain and Reishi for everything else

Join Earn.com with this link.

Start your OWN Patreon campaign!

calories proper


Save

Don’t eat doughnuts for breakfast, Op. 85

or
Weight-loss maintenance, part 1

“Weight-loss maintenance” is a critical part in the battle against obesity because losing weight is much easier and significantly more successful than keeping it off.  The difference lies predominantly in duration: a few months of dieting to lose weight vs. keeping it off for the rest of your life.  Two diet studies on the topic were recently published, and while neither study really addressed the issue proper, some interesting points can be gleaned from both.

Study #1

Meal timing and composition influence ghrelin levels, appetite scores and weight loss maintenance in overweight and obese adults (Jakubowicz et al., 2012)

16 weeks of weight loss followed by 16 weeks of “weight-loss maintenance.”

In brief, the weight loss was accomplished by one of two hypocaloric (1400 kcal/d) isocaloric pseudo-Dukan Diets (higher protein & lower fat than Atkins)

The catch:  Breakfast for the people in HCPb (High Carbohydrate and Protein breakfast)  had twice the calories, 6x the carbs, and half more protein than LCb (Low Carb breakfast).  This was compensated, calorically, by a much smaller dinner.  In other words, they ate like a King for breakfast, a Prince for lunch, and a Pauper for dinner… with the added bonus of a “sweet food… chocolate, cookies, cake, ice cream, chocolate mousse or donuts.”  For breakfast.

People in both groups lost roughly similar amounts of weight in the weight loss phase:

During the first 16 weeks (weight loss phase), a strict 1400 kcal diet was implemented.  During the second 16 weeks (“weight-loss maintenance” phase), macronutrient composition was supposed to be kept similar, but subjects were “free to eat as motivated by hunger or cravings.”  Critique #1a: this study would’ve greatly benefitted by food intake questionnaires to know more accurately what these people were eating; the importance of this becomes more apparent soon.

At three times throughout the study (baseline, week 16, and week 32), a “Breakfast meal challenge” was administered to assess Hunger, Hatiety, and Food Cravings.  Unfortunately, however, the “Breakfast meal challenge” was administered… after… breakfast.  HCPb binged on a high calorie 3-course meal which included dessert while LCb nibbled on a lite breakfast… And the researchers needed a 100-millimeter Visual Analog Scale and 28-item Food Craving Inventory Questionnaire to figure out who would be hungrier afterwords?  Really?

Divide and conquer

Table 2.  There were no major differences between the groups, and between those who completed or didn’t complete the study except for weight loss in those who withdrew.  Apparently, people who didn’t lose any weight on the hypocaloric weight loss diet decided to quit (was it the diet or the dieter that didn’t work? [sorry, no offense]).  In any case, this would’ve introduced a systematic bias except the non-weight-losers were similar in both diet groups.  But Hunger & Satiety was also similar between completers and dropouts… I wonder why…  i.e., the diet was working for those who were losing weight, because Hunger was low and Satiety high; in the dropouts who didn’t lose weight, Hunger was low and Satiety high because they were eating more (which is why they didn’t lose weight).  IOW: “not hungry -> eat less -> lose weight -> complete the study” vs. “eat more -> not hungry -> don’t lose weight -> dropout of the study.”  People are “not hungry” in both groups, but for different reasons.

Critique 1b: this is another place where a food intake questionnaires would come in handy.

During the weight loss phase, LCb lost a little bit more weight and became a little bit more insulin sensitive than HCPb, which is interesting only because the macronutrients were so similar.  Thus, it may have been an effect of “meal-size-timing.”  In other words, don’t eat like a King for breakfast, a Prince for lunch, and a Pauper for dinner.

Ghrelin, a hunger hormone, was significantly higher in LCb and this actually correlated very well with measured Hunger levels (unlike leptin, the far more popular anti-hunger hormone, discussed in depth HERE).  And insulin, a theorized yet controversial hunger hormone, did not: insulin was lower at week 16 while Hunger was 2x higher; and insulin was 2x higher at week 32 compared to week 16 while Hunger was the same at those time points (Table 3).  Thus, for those interested (which is admittedly probably only me), neither leptin nor insulin correlate with Hunger levels; but this study showed that ghrelin does.  Furthermore, similar to those leptin data mentioned above, Hunger was not correlated with weight loss (which is kind-of-fascinating).

The second half of the study (“weight-loss maintenance”) was complete bollocks and made no sense whatsoever (you’ll see it on the evening news).  What you can conclude from this study, however: people following the moderately higher protein and lower carb pseudo-Dukan Diet (LCb) lost modestly more weight during the first 16 weeks than those following the more traditional higher carb version (HCPb).  BOTH diets were “high protein” and “low carb,” and people in BOTH groups lost a lot of weight (~30 pounds in 4 months).  The media hasn’t had their way this study [yet], but when they do, I’m sure the they’ll disagree.

Don’t eat doughnuts for breakfast, you heard it here first.


calories proper

Decepticon Promicor (soluble corn fiber), Op. 81

I heard a comedian say he wished exercise was like high school; once you get your diploma, that’s it.  You never need to do high school again.  Unfortunately, the same isn’t true with artificial nutrition.  the mad food scientists are at it again.

Enter: Soluble corn fiber (SCF), mass produced by Megatron Promitor

Over a decade ago, Atkins released low carb bars.  Well, they weren’t actually low carb per se, they were low sugar.  This was accomplished by replacing sugar with glycerol (a sugar alcohol) and polydextrose (a pseudo-fiber).  While their bars are made from cheap ingredients and low quality protein, sugar alcohols and pseudo-fibers are certainly better than sugar.

Later, sugar alcohols took off in popularity, appearing in Met-Rx Protein Plus, Detour Lean Muscle, Dymatize Elite Gourmet, etc., etc.  Glycerol was prominent in Labrada and Pure Protein bars.  Supreme Protein bars use glycerol and maltitol, and a LOT of ‘em.  Quest took a stand against glycerol and uses the lower calorie and more stomach-friendly erythritol (if it ends in “-ol,” its probably an alcohol).

More recently, the field took a considerable philosophical leap forward and starting using real fiber, good fiber.  Inulin appeared in some Atkins bars, VPX Zero Impact, and the original Quest bars.  Quest has since switched to another good fiber, isomalto-oligosaccharides.  Unfortunately no one is using GOS, yet, but they will … mark my words (that’s a prediction, or stock tip… not a threat).

But now the field has taken a turn and we have another artificial ingredient, a pseudo-fiber, with which to deal.  “Soluble corn fiber (SCF)” first appeared in Splenda Fiber packets and then in Promax LS bars.

If you’re like me, you’re asking yourself: what is this stuff?  Is it real fiber?  Is it like the super fibers inulin and GOS?  Hello Pubmed

Divide and conquer

Stewart (2010) compared SCF to 3 other fibers and maltodextrin, 12 g/d x 2 weeks =

Pullulan, a rather potent fiber, is not well-tolerated.  Resistant starch (an insoluble fiber), soluble fiber dextrin, and SCF were all OK.  The gut microbiota seemed to have no preference, as short chain fatty acid production was similar in all groups (perhaps 12 grams is subthreshold?).  Similarly, health biomarkers, hunger levels, and body weight were unaffected.

Boler (2010) compared a commercially available SCF preparation to polydextrose, 21 grams per day for 21 days in 21 healthy men (cute.)

NFC, no fiber control; PDX, polydextrose; SCF, soluble corn fiber

In this study, however, SCF didn’t do so well.  It caused gas and reflux.  Perhaps this wasn’t observed in Stewart’s study because of the lower dose (12 vs. 21 grams).  Furthermore, polydextrose reduced while SCF increased short chain fatty acid production, both of which resulting in a higher acetate:butyrate ratio.  So unlike 12 grams of any of Stewart’s fibers (including SCF), the gut microbiota seems to respond to 21 grams of SCF.  And they pooped more (both fiber groups).

Data are expressed as log cfu/g feces.

Interestingly, SCF was remarkably bifidogenic.  Much more so than PDX, MOS (see Yen et al., 2011), and inulin (see Menne et al., 2000), but WAY less than GOS (see Silk et al. 2009).

the holy grail

This same group reported a more detailed analysis of the gut microbiota which unfortunately did NOT exactly confirm their earlier finding (Hooda et al., 2012):

Data presentation is different in the two publications, and if both are true, then SCF selectively increases a few specific strains of bifidobacteria but reduces many others (enough to increase the total amount but decrease the variety).  The functional implications of this are unclear (to me).

In the meantime, SCF appears to be at most an OK pseudo-fiber substitute.  Megatron Promitor is not likely to test it against the super fibers (e.g., inulin, GOS, etc.) any time soon, so we won’t know if it’s an advance or simply a side-step.  Such is life.


calories proper


a novel gut health diet paradox, Op. 75

The low FODMAPs diet

FODMAPS  – Fermentable Oligosaccharides, Disaccharides, Monosaccharides, and Polyols.  Basically, FODMAPs are a bunch of sugars that are poorly digested in some people and cause a fantastic variety of health problems ranging from bloating and abdominal pain all the way to chronic fatigue and anxiety.  AND a low FODMAPs diet seems to provide some relief (Ong et al., 2010; Staudacher et al., 2011).

Just like it’s weird name, it’s difficult to simplify the rules of the low FODMAPs diet, so here it is graphically:

FODMAPs vs. GFCF

Grains are excluded from GFCF due to gluten and from FODMAPs due to oligosaccharides.  Dairy is excluded from GFCF due to casein and from FODMAPs due to lactose (not sure where FODMAPs stands on fermented dairy like kefir or FAGE).  Thus, both GFCF and FODMAPs exclude grains and dairy.  However, GFCF doesn’t restrict fructose, which is excluded in FODMAPs (monosaccharide).  And last but not least, GFCF but not FODMAPs allows polyols, but as I’ll explain later, I don’t think polyols belong on this list (perhaps “FODMAPs” was just more pleasant-sounding than “FODMAs”).

“polyols”

FODMAPs vs. low carb

A low carb diet is low in both FODMAPs and gluten.  But perhaps similar to polyols, some leniency should also be applied to casein, as standard low carb diets don’t restrict casein but still improve a variety gastrointestinal symptoms (and quality of life in IBS patients; Austin et al., 2009).  Alternatively, a dairy-free low carb diet would cover all your bases.

or you could bring a gun to a knife fight, part I.

Alterations in gut bacteria are frequently associated with gastrointestinal problems, and two classes of nutritional supplements aimed at modifying the gut flora seem to help.  “Probiotics” contain the buggers themselves, while “prebiotics” contain their fuel.

divide and conquer

Bifidobacteria

With regard to the former, “bifidobacteria” seem to be the major player.  Bifidobacteria are the highest in the gut of breast fed babies and lowest in elderly folk.  They are lacking in IBS sufferers (Kerckhoffs et al., 2009; Parkes et al., 2012), and supplementation with bifidobacteria-containing probiotics improve a variety gastrointestinal symptoms (B. infantis 35624 [Whorwell et al., 2006]; B. animalis DN-173 010 [Guyonnet et al., 2007]; B. bifidum MIMBb75 [Guglielmetti et al., 2011])

B. infantis 35624 is found in Align.

B. animalis DN-173 010 is found in Dannon’s Activia yogurt.  But as with most yogurt products, it comes unnecessary added sugars.

Personally, I’d recommend a blend like that found in Jarrow Bifidus Balance (which comes preloaded with its own stock of prebiotics, to be discussed later).

Back to the paradox (or a shameless teaser for next week’s episode): the low FODMAPs, GFCF, and low carb diets all have beneficial effects on gut health but reduce bifidobacteria.  Bifidobacteria supplements and bifidogenic prebiotics are also good for the gut.

a far more enigmatic paradox than the French one, IMO, to be continued…

If you like what I do and want to support it, check out my Patreon campaign!

 Affiliate links: still looking for a pair of hot blue blockers? Carbonshade and TrueDark are offering 15% off with the coupon code LAGAKOS and Spectra479 is offering 15% off HEREIf you have no idea what I’m talking about, read this then this.

20% off some delish stocks and broths from Kettle and Fire HERE.

If you want the benefits of  ‘shrooms but don’t like eating them, Real Mushrooms makes great extracts. 10% off with coupon code LAGAKOS. I recommend Lion’s Mane for the brain and Reishi for everything else.

Join Earn.com with this link. Get paid to answer questions!

calories proper


Candy in disguise, Op. 73

on the chopping block:To recharge between hunting, gathering, and avoiding predation, our Paleolithic predecessors snacked on gluten-free energy bars comprised of a variety of fruits nuts, and vegetable oils all stuck together with Mother Nature’s sweet sticky honey and dates.  <end sarcasm>

For the record, I’m not a card-carrying member of the Paleo community; just looking out for a respectable nutrition movement.

NoGii No Gluten Paleo Bars” should not be confused with anything healthy.

INGREDIENTS: Dates, Honey, Organic Cashews, Almonds, Apple Juice Sweetened Cranberries (Cranberries, Apple Juice Concentrate, Sunflower Oil), Sesame Seeds, Dried Unsweetened Tart Cherries, Sunflower Seeds, Unsulphured Dried Apples, Freeze-dried Strawberries, Strawberry Juice Concentrate, Organic Sunflower Oil. ALLERGENS: Contains Tree Nuts (Almonds and Cashews).

Full disclosure:

Case closed.

On a more positive note, NoGii No Gluten Paleo Bars have no added sugars.  Indeed, those were saved for their “NoGii Kids Bar.” 

INGREDIENTS: Soy Protein Crisps (Soy Protein Isolate, Tapioca Starch), Marshmallow Creme (Sugar, Brown Rice Syrup, Crystalline Fructose, Invert Sugar, Water, Egg Albumen, Agar, Gum Arabic, Natural Flavor), Brown Rice Syrup, Organic Brown Rice Crisps (Organic Brown Rice, Organic Brown Rice Syrup, Sea Salt), Rice Syrup Solids, Maize Dextrin (Dietary Fiber), Organic Canola Oil, Organic Agave Syrup, Whey Protein Isolate, Organic Palm Oil, Vanilla Yogurt Drizzle (Sugar, Fractionated Palm Kernel Oil, Whey Powder, Nonfat Dry Milk Powder, Cultured Whey, Soy Lecithin [emulsifier], Vanilla), Vegetable Glycerine, Natural Flavors, Sea Salt, Soy Lecithin, Mixed Tocopherols (Natural Vitamin E), Purified Stevia Extract, Lo Han Extract.

NoGii proudly advertises “NO HIGH FRUCTOSE CORN SYRUP” and “ALL NATURAL,” but this is despicable, ESPECIALLY because these are targeted at children.

Divide and conquer

  1. Agave syrup has MORE fructose than high fructose corn syrup (it’s like higher fructose corn syrup).  Why brag about “no high fructose corn syrup” if you’re only going to include a higher fructose substitute?
  2. Crystalline fructose.  (yes, that would be 100% fructose).
  3. Invert sugar is chemically virtually identical to high fructose corn syrup.  This is deceitful… it wouldn’t be so bad if they didn’t advertise (in all capital letters) “NO HIGH FRUCTOSE CORN SYRUP” directly on the website.
  4. Lastly, there’s nothing “Brown Rice” about “Brown Rice Syrup.”  It’s just plain syrup.  It may not have fructose, but it’s still just a blend of simple sugars.

NoGii is pulling no punches, so neither am I: they are trying to trick parents into feeding their kids something that they may not have had they known what was really in it.

NoGii.  Worst company of the week.  No, of the month, because they are targeting children.

A superior alternative:

Quest Low Carb Gluten Free Protein Bars

calories proper

The easy diet diet, Op. 72

Regular followers of this blog (all 3 of you) know I think positively about carbohydrate-restricted diets.  In randomized controlled intervention studies, low-carb diets are a little better most of the time compared to low calorie and low fat diets (note the italics).  They are healthier and there is probably no end to the benefits of chronically lower insulin levels.  The only relevant disadvantage is that [I thought] such a diet requires too big of a change for most peoples lifestyle…  however, this might not be the case.  In light of some recent [relatively unscientific] findings, that change might not be so big after all.

In one study, Feinman and colleagues (Feinman et al., 2006 Nutrition Journal) surveyed a group of low carb dieters from the “Active Low-Carber Forum” about their diets.  There was no formal subject recruitment or randomization; it was just a bunch of people who were following various low carb diets.  The only requirement was that they were actually following a low carb diet for weight loss.  For starters, there were a LOT of people who lost a LOT of weight: 62% of ~86,000 participants lost at least 30 pounds and kept it off for over a year (I know I know, it’s possible that people who lose a lot of weight are selectively more likely to participate on this particular forum [this study is confounded out the wazoo but still had a few pearls]).

What I found most interesting was what these people said were their biggest dietary changes.  The top 2 were, not surprisingly, avoiding sugar and starch.  Number 3 was drinking more water.  So to sum up the top 3 changes: basic healthy dieting 101; not drastic lifestyle alterations.

Number 4 was the biggie: most people increased their green vegetable intake by over half… not bacon, hot dogs, and red meat… leafy greens.  This is great (just think of all those micronutrients).  They weren’t counting calories or replacing everything in their refrigerator; they were avoiding sugar and eating more leafy greens.

leafy greens: winner

sounds easy, right?  Of course eating more protein and fat also occurred, but it wasn’t a universal requirement: only 5% reported increasing beef, butter, and bacon… instead, people just ate a little more of whatever was most convenient for their lifestyle.

This study changed my view.  These people lost over 30 pounds on low carb and kept it off for over a year without making any huge changes.

Another more recent study (Kirk et al., 2012 Journal of Pediatrics) was a diet intervention study in obese children.  They compared a low carb diet (LC), low glycemic index diet (RGL), and a portion controlled diet (PC).

It’s hard to put kids on a low carb diet.  Indeed, adherence to the low carb diet was horrific, less than 30% at 3 months and down to 20% at 6 months (figure below on the right).  But comparing this to the figure on the left is astonishing.  Despite adherence of only around 25%, low carb dieters had the biggest reduction in body fat.  It’s not until adherence was nil that the kids starting gaining weight back.

weight loss vs. adherence

What does this say about low carb?  it’s the easiest diet in the world, even if you can barely follow it!  25% adherence to a low carb diet resulted in greater fat loss than 80% adherence to the other diets.

You might just be better off half-assing a low carb diet than strictly adhering to any another one-

calories proper

Paleo vs. carbs (per se), Op. 68

The Paleo diet:

A)     the next big thing

B)      Atkins-lite

C)      Fail

D)     None of the above

While proponents of the Paleo diet take a page out of nutritionism‘s book and argue it’s about food choices, not macronutrients, my reductionism mandates inclusion of a comparative breakdown by protein, fat, and carbs.  In a recent publication, Lindeberg (a Paleo pioneer) compared Paleo to the Mediterranean diet in a cohort of CHD patients (Lindeberg et al., 2007 Diabetologia).  To make a long story short, Paleo came out on top in a variety of endpoint measures after 12 weeks.

Divide and conquer

The Paleo diet consisted of lean meat, fish, fruits, vegetables, potatoes, eggs, and nuts; grains and dairy were off-limits (Paleo is GFCF-friendly).  Paleo carbs include fruits, veggies, nuts, and beans… no starches, cereals, whole grains, added sugars, etc… FYI Atkins is very similar to Paleo but includes a lower absolute amount of Paleo carbs.  The Mediterranean dieters ate whole grains, low-fat dairy, vegetables, fruits, fish, oils, and margarines.  Both diets exclude processed junk food and both are relatively healthy diets.  

As such, both groups lost weight; slightly more on Paleo but this was probably due to reduced caloric intake (not uncommon for Paleo dieters; see below and also Osterdahl et al., 2008 EJCN):But the benefits of Paleo were much more robust WRT insulin sensitivity, which was markedly improved on Paleo but not Mediterranean.

Paleo: 1

Mediterranean: 0

With a 4% weight loss, why didn’t glucose tolerance improve in the Mediterranean dieters?  … weight loss is almost always accompanied by improved glycemic control…   The biggest difference in “foods” consumed by the two groups was cereals: 18 grams per day on Paleo vs. 268 on the Mediterranean diet… over 14 times more!  As I’ve discussed at length with gravitas, a high intake of cereals (aka grains aka fibre [in the figure below]) does not bode well for insulin sensitivity, inflammation, and outright all-cause mortality:

As such, Paleo does well to exclude grains.  Furthermore, Paleo is higher in protein and fat and lower in carbs- all good things.  A more interesting analysis showed that waist circumference (visceral fat) was associated with grain intake even when controlled for carbohydrates.  In other words, the detrimental impact of whole grains goes beyond their intrinsic carbohydrate content. (whole grains … insulin resistance … visceral fat)

Back to those calorie data for a moment, given that they were probably just as important as cereal exclusion in determining the results.  Why did Paleo dieters spontaneously eat so much less?  In a follow-up publication, Jonsson and colleagues assessed leptin and satiety in both groups (2010 Nutrition & Metabolism) and showed that despite eating less and losing more weight (things that should increase hunger and decrease satiety), Paleo actually did the opposite (hint: something to do with whole grains, perhaps?).

While the Paleo meals were smaller (5th and 6th rows) and contained fewer calories (3rd and 4th rows), they were just as satiating as Mediterranean diet meals (7th through 9th rows), leading the authors to conclude Paleo is more satiating calorie-for-calorie and pound-for-pound.  And if that isn’t enough, Paleo dieters also experienced a significantly greater reduction in leptin! (probably caused by their reduced food intake and body weight loss)  While the general consensus is that such a change in leptin should enhance hunger, as discussed previously I think lower leptin in this context reflects enhanced leptin sensitivity, which also helps to explain the improved insulin sensitivity.  Last but not least, WRT the Mediterranean diet I suspect reduced calories explains the weight loss, but the abundance of whole grains explains the blunted glycemic improvements.  (hint: whole grains … leptin resistance … insulin resistance) … (whole grain exclusion … leptin sensitivity … insulin sensitivity)

Paleo, the next big thing?  I’m holding out for a one-on-one with low-carb proper to exclude the role of Paleo’s lower carb content.  The whole grains issue requires no further confirmation IMO (e.g., Burr et al., 1989 LancetJenkins et al., 2008 JAMA, etc.).

The Paleo diet:

A)     the next big thing

B)      Atkins-lite

C)      Fail

D)     None of the above

might be considered “Atkins-lite,” probably not “the next big thing,” definitely not “fail.”

+1 for excluding grains


calories proper

Red meat won’t kill you. It will make you stronger.

While statisticians try to wheedle causation from observational data, they really just end up showing us what health conscious people are like.  They exercise more and smoke less, eat more fruit and less red meat, etc.  This doesn’t “prove” those habits actually make health conscious people healthy.  Intervention studies, where healthy and non-healthy people are randomly assigned one of those habits, are required in order to achieve any reasonable amount of “proof.”  With regard to red meat, findings from such studies frequently stand in contrast to the observational data.
-end soapbox-

Divide and conquer

Serum lipids in humans fed diets containing beef or fish and poultry (Flynn et al., 1981 AJCN)

randomized crossover study: 1 egg + 5 oz. of red meat or fish/poultry for three months

The red meat group ate significantly more cholesterol than the poultry/fish group (540 vs. 477 mg/d), fat (104 vs. 83 g/d) and saturated fat (40 vs. 27 g/d).  Despite these differences, there were no changes in serum cholesterol or HDL.  In women but not men, red meat decreased and poultry/fish increased serum triacylglycerols, an effect that was consistent regardless of the order in which the diets were consumed (it was a crossover study).  This is significant because according to the Framingham studies, serum triacylglycerols are a more important predictor of heart disease in women than men.  And interestingly, carb intake, which usually regulates serum triacylglycerols, was similar in both groups suggesting that red meat has a triacylglycerol-lowering effect independent from simply displacing carbs from the diet.  Furthermore, the red meat group consistently ate about 200 more kilocalories then the poultry/fish group yet body weight was stable and similar in both groups.

Conclusion 1: 5 ounces of red meat (plus more cholesterol, fat, and saturated fat) for three months lowered serum triacylglycerols and didn’t affect cholesterol.  The excess calories consumed in the red meat group (mostly from saturated fat and protein) didn’t cause weight gain.

The effect of short-term diets rich in fish, red meat, or white meat on thromboxane and prostacyclin synthesis in humans (Mann et al., 1997 Lipids)

randomized intervention study: ~8 oz. white meat vs. ~12 oz. red meat vs. ~5 oz. fish for 2 weeks

This study was really trying to compare the effect on inflammatory markers of the high AA content of meat to the high EPA and DHA in fish (AA being pro-inflammatory and EPA/DHA being anti-inflammatory).As expected, the fish diet reduced inflammatory biomarkers (thromboxane and prostacyclin).  The two unexpected findings were: 1) white meat actually increased inflammatory biomarkers, and 2) red meat had no effect.

Conclusion 2: red meat and AA did not impact the inflammatory biomarkers thromboxane and prostacyclin.


Comparison of the effects of lean red meat vs lean white meat on serum lipid levels among free-living persons with hypercholesterolemia (Davidson et al., 1999 Archives of Internal Medicine)

randomized intervention study: ~5 oz/d of red meats (beef, veal, and pork) vs. white meats (poultry and fish) for 36 weeks

As seen in the table below, neither diet had any major effect on plasma lipids.

Fat, cholesterol, and total calorie intake was higher in the red meat group, but again, this didn’t result in any differences in body weight between the groups.

Conclusion 3: red meat had no effect on plasma lipids and the excess calories consumed in the red meat group (mostly from saturated fat and protein) didn’t cause weight gain.

Partial substitution of carbohydrate intake with protein intake from lean red meat lowers blood pressure in hypertensive persons   (Hodgson et al., 2006 AJCN)

randomized intervention study: 2 oz./d red meat vs. starchy carbs for 8 weeks

Conclusion 4: red meat lowered blood pressure and the excess calories consumed in the red meat group (mostly from saturated fat and protein) didn’t cause weight gain.

Increased lean red meat intake does not elevate markers of oxidative stress and inflammation in humans (Hodgson et al., 2007 AJCN)

randomized intervention study: 8 oz./d of red meat vs. carbs for 8 weeks

Subjects were instructed to eat their red meat in place of carb-rich foods such as bread, pasta, rice, potatoes, and breakfast cereals.

Conclusion 5: Biomarkers of oxidative stress (F2 isoprostanes and GGT) and inflammation (CRP and SAA) were reduced in the red meat group.


In sum:

WRT plasma lipids: red meat improved some and had no effect on others

WRT inflammation: red meat had no effect on thromboxane and prostacyclin, and decreased CRP and SAA

WRT oxidative stress: red meat reduced F2 isoprostanes and GGT

WRT energy balance: the excess calories from red meat didn’t cause weight gain.  This was the most consistent finding in all of the above studies and may be at least partially explained by the findings of the recent protein overfeeding study by George Bray and colleagues who showed, in brief, that excess protein had no impact on fat mass and actually increased lean mass.  So if you’re worried that fatty red meat might make you fat, don’t be.

The key to these 5 studies is that they are randomized intervention trials.  It’s not simply looking at what healthy people eat, but rather what happens when one specific dietary component is changed in all kinds of random people.  In other words, it’s what would happen in the real world if you made this dietary change.  And red meat consistently improved a variety of health parameters.

I suspect when the value of intervention trials is realized and fully appreciated, the habits of health conscious people will change.  Until then, we’ll just have to take the media’s reporting of nutrition studies with a grain of salt.

If you like what I do and want to support it, check out Patreon! $5/month for full access to all articles and you can cancel if it sucks 🙂

For personalized health consulting services: drlagakos@gmail.com.

Affiliate links that probably don’t work anymore: Still looking for a pair of hot blue blockers? TrueDark is offering 10% off HERE and Spectra479 is offering 15% off HERE. Use discount code LAGAKOS for a deal on CarbonShades. If you have no idea what I’m talking about, read this then this.

OMAHA. STEAKS. Check here for daily discounts and the best steaks of your life.

Keto-mojo.

Naked Nutrition makes some great products, including Naked Grass Fed Protein. Also, free shipping 

20% off some delish stocks and broths from Kettle and Fire HERE

Real Mushrooms makes great extracts. 10% off with coupon code LAGAKOS. I recommend Lion’s Mane for the brain and Reishi for everything else

calories proper

Yogurt black belt test, Op. 65

Proper yogurt can serve as a delicious and healthy addition to any meal of the day.  It contains probiotics, whose role in promoting a healthy gut flora and overall well-being is widely appreciated.  As such, yogurt can be considered an acceptable source of a little bit of sugar in your diet.  (I don’t say that very often… actually, that was probably the first time.)

BUT (you had to know there was a “but”) there are a lot of caveats.  First and foremost is selecting the best yogurt product, since not many people are down with DIY fermentation (which is unfortunate given its tremendous ease).  The yogurt with the most gravitas on the market: FAGE.  It’s supposedly Greek, but I’d say given it’s macronutrient composition, it’s more Spartan.  There are considerable differences between the plain and fruity varieties worth considering.  For example, one serving of plain contains 190 kcal, 10g fat, 8g sugar, and 19g protein, whereas one serving of the blueberry-flavored variety contains 170 kcal, 6g fat, 16g sugar, and 11g protein.  twice the sugar! This is unacceptable, primarily because while I’m not really clear what’s in the “blueberry fruit preparation” that’s listed in the ingredients, I’m sure it’s not real blueberries.  Since real blueberries have negligible protein, we can assume the total protein content of the final product is entirely from the yogurt; therefore, their ambiguously named “blueberry fruit preparation” contributes about 27 grams to the entire 150 gram serving.  This adds 12 grams of sugar, whereas 27 grams of real blueberries would provide only 3 grams of sugar (and some fiber and phytonutrients).

And pass on the 0% fat version; one serving contains all of the sugar but none of  the healthy fats that slow down sugar absorption and contribute to satiation.

On to more pressing, or ‘popular,’ matters.  Dannon is the most widely purchased yogurt on the market.  One serving of plain Dannon yogurt contains 160 kcal, 8g fat, 12g sugar, and 9 grams of protein (less protein and healthy fats, and more sugar than its Spartan counterpart).  Their vanilla-flavored variety has a whopping 25 grams of sugar (and it’s certainly not natural dairy sugar…).  One serving of blueberry-flavored Fruit-on-the-Bottom contains 140 kcal, 1.5g fat, 26g sugar, and 6g protein.  If you added real blueberries to the plain variety this would only yield 15 grams of sugar (still more than FAGE, FTR).  Again, this additional sugar is not coming from real blueberries; unlike FAGE, who disguises their mystery flavor as “blueberry fruit preparation,” Dannon doesn’t even try to hide it.  Right in the ingredients list you’ll find strike 1: sugar, strike 2: fructose syrup, and strike 3: high fructose corn syrup (I honestly don’t know why that’s listed as three separate ingredients.  It’s like they’re trying to boast about it).  I feel pre-diabetic just reading it.  Yoplait is just as bad (high sugar and low protein); come on, Trix -flavored yogurt?  Really?

With regard to promoting a healthy gut flora:  Dannon contains only 1 probiotic strain: L. acidophilus; Yoplait has 2: L. bulgaricus and S. thermophiles; FAGE has 5, L. acidophilus, L. bulgaricus, S. thermophiles, Bifidus, and L. casei.

FAGE: winner.


calories proper

Volumetrics II

Volumetrics, take II, Op. 64

Greatest dietary predictors of 2-year weight loss success: increased intake of vegetables and meat and reduced intake of empty calories   (sugars and starchy carbs).

Proponents of the low-fat diet cite the high energy density of fat (9 kcal/g) relative to carbohydrate (4 kcal/g) and claim you can eat more carbs than fat without exceeding your daily calorie budget: 100 grams of carbs = 400 kcal; 100 grams of fat = 900 kcal.  And by extension, you will: 1) feel fuller after a high carb meal; 2) eat fewer calories; and 3) lose weight.  Bollocks, bollocks, and bollocks.  Diet studies that compare low-fat to low-carb impose strict calorie restrictions on the former and unlimited consumption of the latter.

The “energy density of food” theory is about as valuable for weight loss as “eat less, move more,” and “a calorie is a calorie.”  

Fiber  and water, the great filler-uppers, have done nothing in the battle of the bulge.

The figure above is from the now famous (or infamous, in certain crowds) Shai study.  A manuscript was recently published that tried to figure out which foods were most (or least) associated with successful body weight management at two distinct time points: 1) weight loss at 6 months; and 2) weight maintenance after 2 years.

Effects of changes in the intake of weight of specific food groups on successful body weight loss during a multi-dietary strategy intervention trial (Canfi et al., 2011 JACN)

The reduction in food consumed was ~24% on the low fat diet and ~33% on the low carb diet, despite a similar reduction in calories (~22%) in both groups.  The low fat diet was not “more satiating;” both groups were eating the same amount of calories.  Yet the low carb dieters lost more weight.  But the point of the new study was about which foods were the best predictors of success in all of the groups.  Ample information about the dietary intervention, cute food pyramids (see below), and sample meal plans are available in the online supplement.

By and large, the results were similar for weight loss (at 6 months) and weight maintenance (24 months); IOW, whatever helps you lose weight also helps keep it off.  But there some interesting differences. For example, increasing vegetable intake assisted weight loss but was less important in the long-term.  Conversely, reducing starchy carbs (bread, pasta, cereals and potatoes) was moderately important for weight loss but universally important for maintenance of a reduced body weight.  Increased meat intake was one of the best predictors of successful long-term weight loss independent from background diet (it was equally true for low carb and low fat dieters).  In other words, increasing vegetable intake can help jumpstart a weight loss diet, but reducing starchy carbs increasing meat intake need to be permanent lifestyle changes.

And surprise surprise, reducing “sweets and cakes” was also a major factor across all diets.  With regard to weight loss, reducing sweets and cakes was statistically more important than increasing vegetables.  In fact, it was the most important change of all.

In sum, long-term weight loss success includes a diet with more meat and vegetables and fewer empty calories (starchy carbs, sweets and cakes, etc.).


calories proper


Become a Patron!