Category Archives: Exercise

Non-sequiter nutrition II, a sugar-thought experiment

The average western diet contains about 50 grams of fructose from a variety of sources ranging from beneficial fibrous fruits to the more insidious sugar-sweetened beverages, soda and juice.  50 grams of fructose.   2 1/2 cans of Coca-Cola.

50 grams x 4 kcal/g = 200 kcal

200 kcal / 2,000 kcal = 10%

10% of your calories are provided by fructose

Even the very high end of fructose intake rarely exceeds ~85 grams, which is still < 20%.  My point?   This is nowhere near the 60% used in mouse diet studies.  Disclaimer: I think fructose causes leptin resistance because of data from such studies.  60% fructose is the fructose that causes leptin resistance and increased susceptibility to obesity.  What does this say about “normal” levels of fructose intake?  Toxic doses cause leptin resistance and obesity susceptibility in mice, well, because they’re toxic, and fructose toxicity just so happens to manifest like that (in mice).   60% is toxic.  15 cans of Coca-Cola per day (depending on who’s counting); but is it relevant?

39 grams of sugar, roughly half of which is fructose

In mouse studies, toxic doses are used for practical reasons- it’s cheap.  The animals can be rendered leptin resistant, glucose intolerant, and susceptible to obesity within a few months of feeding this expensive purified synthetic diet.  This probably (probably) takes over 100 times longer in humans simply because it’s nearly impossible for humans to ingest mouse-toxic-levels of fructose.

1. If the dose was based on body weight (like a drug; e.g., mg/kg or mpk):

60% fructose x 12 kcal/d = 7.2 kcal.  Divided by 4 kcal/g = 1.8 grams per day.

1.8 grams for a 40 g mouse = 45 g/kg.  For a 70 kg (154 lb) human = 3,150 grams of fructose or roughly 12,600 kcal.  I.e., 150 cans of soda or about a week’s worth of calories.  In other words, you’d have to eat a hypercaloric fructose-only diet for months.

2. If the dose was based on calories:

60% fructose x 2,000 kcal/d = 300 grams = 15 cans of soda or doughnuts per day.   News flash: that’s gross, but it won’t kill you.

fructose: still not as dangerous as playing in traffic

How about just lowering your lifetime sugar exposure.  39 grams of sugar is worse than 0.01 grams of stevia or sucralose.  Anyone remember “water?”  Even if you believe “a calorie is a calorie,” exclusively, it’s still really hard to burn off 39 grams of sugar.  Try running 2 miles.  Skinny kids might do this automatically after drinking a can of soda or eating a doughnut.  Not most adults.

Don’t play in traffic either.

calories proper

Resveratrol, energy balance, and another reason to distrust health journalism, Op. 79


The great red wine compound “resveratrol,” at it again.  Disclaimer: 150 mg of resveratrol per day is too low and 30 days is too short to detect anything close to what was seen in the infamous resveratrol mouse study (Baur et al., 2006 Nature), which showed resveratrol to be the best drug ever on the planet.
This study, on the other hand, utilized the highest quality study design and was published in a great journal, but was a flop.   And the media got it wrong too:  “Resveratrol holds key to reducing obesity and associated risks.”  No, it doesn’t.

Calorie restriction-like effects of 30 days of resveratrol supplementation on energy metabolism and metabolic profile in obese humans (Timmers et al., 2011 Cell Metabolism)

The study design was pristine.  Kudos.

Sample size too small (n=11) and study duration too short (30 days), but it was a randomized, double-blind, placebo-controlled, crossover study.  And although this type of drug study does not require such a thorough assessment of compliance (a pill count would’ve sufficed), the authors tested blood levels of resveratrol and its metabolites… cool.

On the docket: resVida, DSM Nutritional Products, Ltd.

Divide and conquer
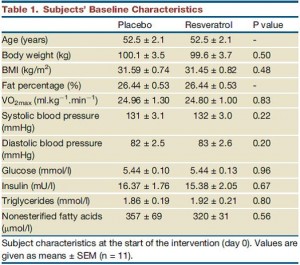
The table above shows baseline characteristics in placebo and treatment groups, but this is peculiar because although the study was randomized (which is confirmed by the high degree of similarity between the two groups), it was also a crossover.

Brief review of my Prelude to a Crossover series (I  & II):

phase 1) half the subjects get drug and half gets placebo

phase 2) both groups get nothing for a washout period

phase 3) everybody switches and gets the other treatment

There are technically two baseline periods (before phase 1 and before phase 2), and all the subjects are in both.  As such, there is only one set of baseline values, so I’m not sure what the data in the above chart actually reflect.  Is this a mistake? or are these data only representative of one of the treatment sessions (which would be an egregious insult to the prestigious crossover design).

In any case, the subjects were all clinically obese, ~100 kg (220 pounds), BMI > 30, body fat > 25%, but otherwise metabolically healthy (fasting glucose levels of < 100 mg/dL).

But here’s where it starts going from technically flawed to weird:

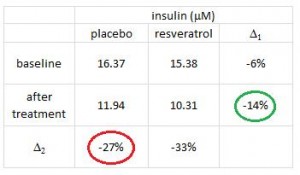
Insulin levels may have been statistically significantly lower after resveratrol compared to placebo, but not after considering baseline insulin was ~15-16 mU in both groups.
insulin proper

The authors noted that after treatment, insulin levels were 14% lower in resveratrol compared to placebo (green circle).  BUT whatever was in that placebo pill was almost twice as good!  The placebo reduced insulin levels by 27% (red circle)!  (take THAT!)  I’m glad the authors reported these data instead of burying them, but they illustrate yet another flaw.

150 mg resveratrol (10-15 bottles of red wine) for a 220 pound person = 1.5 mg/kg; 200x less than what Baur gave his mice (300 mg/kg). Interestingly, however, this produced plasma levels of resveratrol almost 3x higher (180 vs. 65 ng/mL). I have no idea how this happened, but the benefits and lack of toxicity [at such a low dose] bode well for recreational resveratrol supplementation.

As mentioned above, resveratrol was totally safe, but how to interpret this is unclear.  Our options are: 1) good; 2) meaningless; or 3) simply not bad (which I suppose is kind-of-like #2).  It could be interpreted as meaningless because resveratrol, the anti-aging drug, is meant to be taken for a very VERY long time (i.e., forever).  This study proved that resveratrol was safe when taken for 30 days which is considerably shorter than forever.

Furthermore, the dose was phenomenally low, ~150 mg/d, so anything other than “totally safe” would be a huge red flag.

Does resveratrol in fact mimic calorie restriction, as stated in the title?  During calorie restriction, food intake declines (by definition), metabolic rate and insulin levels also decline, but free fatty acids and fat oxidation increases.  In the resveratrol group metabolic rate and insulin declined (recall however that the placebo was pretty impressive also in this regard), but free fatty acids and fat oxidation decreased.  Although proper calorie restriction trials in humans haven’t happened yet, some of these  effects don’t jive.  A decline in metabolic rate will reduce the amount of fat burned.  But relative fat oxidation also declined, leading to what could be a profound reduction in fat burning… coupled with no change in food intake (noted by the authors) this will result in increased fat mass.  Energy Balance 101- no ifs, ands, or buts.  This study was far too short-term to detect a meaningful increase in fat mass, but if these preliminary findings are true (and my interpretation of the data are correct), then this drug might just make you fat.

Oddly enough, they did detect an increase in fat accumulation in skeletal muscle:
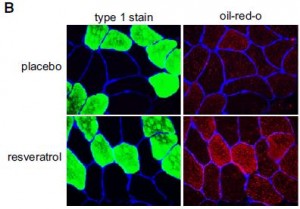
(perhaps instead of calling it a calorie restriction-mimetic, the authors should’ve gone with exercise-mimetic, citing the athlete’s paradox (e.g., van Loon and Goodpaster, 2006)

In contrast to the popular antidiabetic drug rosiglitazone, which shifts fat storage from liver (where it causes a host of health maladies), to adipose, where it can be stored safely indefinitely, resveratrol shifted fat storage from liver to skeletal muscle.  This is interesting because while the fat storage capacity of adipose is seemingly unlimited, I doubt the same is true for skeletal muscle, which needs to do a lot of stuff, like flex.

If these findings are true, which I seriously question, then it would be interesting to see what happens to skeletal muscle fat stores after a few months, considering they doubled in only 30 days (this is unbelievable, literally).

The authors try to make the case that the increased muscle fat came from adipose, but until they report body composition data, this is a tough sell.  The elevated fasting free fatty acids support their claim, but the accompaniment of unchanged meal-induced FFA suppression with lower adipose glycerol release don’t; perhaps the missing glycerol is being re-esterified to nascent adipose-derived free fatty acids?  Increased adipose tissue glucose uptake would be supported by the lower glucose levels, but that is already more-than-accounted for by the increased RQ (indicative of increased skeletal muscle glucose oxidation).

There are some mysteries in these findings, and the improper handling of crossover data do not help.  If this paper is true and my interpretation of the energy balance data are correct, resveratrol might just make you fat :/

Unless of course you’re a mouse, in which case it’ll make you better in every quantifiable measure.

calories proper

p.s. I don’t think resveratrol will really make you fat, I think this study elucidates nothing.

Taxes, saturated fat, and HDL, Op. 71

Since red meat won’t kill you (it will make you stronger), why is taxing saturated fat still up for discussion?  The Danish proposal will add a $1.32 per pound to foods with >2.3% saturated fat; the cost of butter will increase by 30% more and olive oil by 7.1%.  I know, right?  WTF?

Again, I don’t think taxation is the solution, but for the sake of comparison: Arizona’s proposed “fat fee” would cost an extra $50 annually for childless obese patients; Rhode Island’s $0.01/oz of soda; or France’s 3.5% tax on all sugar-sweetened beverages.

Nutritionally speaking, saturated fat should be off the political chopping block; any intervention designed to reduce its consumption will do more harm than good.  In brief, here’s one example of what might happen if it worked, i.e., if dietary saturated fat consumption was reduced:

The effect of replacing dietary saturated fat with polyunsaturated or monounsaturated fat on plasma lipids in free-living young adults (Hodson et al., 2001 EJCN)

Subjects were given a high saturated fat diet and then switched to either a high polyunsaturated fat diet (trial I) or high monounsaturated fat diet (trial II).  In both cases, as seen in the table below, HDL decreased.


Alternatively, here’s what might happen if dietary saturated fat consumption was increased (in brief):

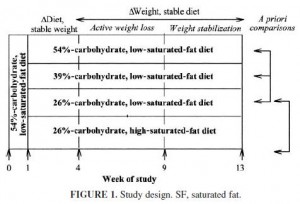
Separate effects of reduced carbohydrate intake and weight loss on atherogenic dyslipidemia (Krauss et al., 2006 AJCN)

The bottom two groups in the chart above ate similar diets except monounsaturated fats were replaced by saturated fats in the last group.

As seen in the table below, saturated fat significantly increased HDL.


So did weight loss, but I’d choose a steak over a stairmaster any day…  (daydream thought bubble: “indeed, ‘adherence’ and ‘compliance’ would be things of the past”)


If you believe HDL is important, taxing saturated fat might be a bad idea.  unless you have stock in statins.


calories proper


the boob tube

it’ll kill you!  (too much, i.e.)

OK, FTR I don’t think any amount of TV watching will kill you, and I think that any study showing otherwise is under the control of some major food company , big pharma, or downright statistical sorcery.

Playing in traffic? Perhaps.  Watching TV? No.

Without further ado, some recent studies showing I’m wrong.

Television viewing and risk of type 2 diabetes, cardiovascular disease, and all-cause mortality (Grontved and Hu, 2011 JAMA)

First, a meta-analysis.  Not good.  The first paragraph in the intro starts out with [sic]: “40% of daily free time is occupied by TV viewing within several European countries.”  At first, 40% seems like a lot; how much “free time” do we really have?  Sleep 8 hours, work 8 hours, commuting to and from work, chores, eating, showering, etc… so maybe 3 hours of free time?  40% of 3 hours = 1.2 hours.  But the authors cite “4 hours” of TV viewing which means these people have almost 7 hours of free time per day… which means commuting to and from work, chores, cooking & eating, showering, etc. only takes about 1 hour (unless they either don’t work or don’t sleep.  IOW 7 hours seems like a horrendous overestimate.  There are a few other inconsistencies in the intro, but rather than spend more time nit-picking, on to the data:

To make a long story short, every additional 2 hours of TV viewing per day increased the risk for:

Type II diabetes by 0.0176%

Fatal CVD by 0.0038%

All-cause mortality by 0.0104%

And just to be clear: yes, those are very very small numbers.

The authors searched relevant databases for every study on the topic, excluded the ones that didn’t support their hypothesis (jk… kind of*), and then independently analyzed the resulting studies.  Any disagreements were “resolved by consensus,”  which I’m not exactly clear how is accomplished when there are only 2 authors (rock, paper, scissors?).  In their favor, whenever possible the data were analyzed with and without diet and body weight in their multivariable-adjusted models.

*out of 1,655 relevant studies, 8 (agreed with their hypothesis [jk… kind of]) were included.

Divide and conquer

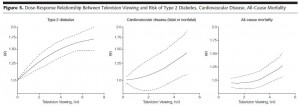
As seen above, increasing hours of TV viewing is associated with increasing risks for diabetes, CVD, and all-cause mortality.  Yikes!

The risk for diabetes was linearly related with TV viewing, but the risk was modestly attenuated by controlling for diet, and greatly reduced by controlling for body weight… IOW a poor diet is bad but excess body weight is worse (lean people can watch more TV than obese people).

Risk for all-cause mortality was less than CVD and diabetes and wasn’t affected by diet or body weight.  The inflection was around 3 hours…  which means that the risk dying isn’t appreciably increased by TV viewing if you watch less than 3 hours per day.  Phew!  (the applies to adults only).  In sum, 3 hours seems to be a safe amount of TV for lean healthy people; less if obese or pre-disposed to diabetes.

Something similar was found in an EPIC study.

Television viewing time independently predicts all-cause and cardiovascular mortality: the EPIC Norfolk Study (Wijndaele et al., 2011 International Journal of Epidemiology)


Although the overall risk for all-cause mortality associated with increased TV was about a third less than in Hu’s meta-analysis, it was 1) statistically significant, and 2) unaffected by diet or body weight (similar to Hu’s findings).


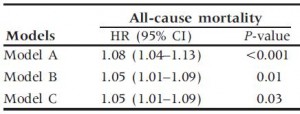
The relationship between TV viewing and all-cause mortality was attenuated after controlling for a variety of confounding factors (HR Model A = 1.08, p<0.001; HR Model B = 1.05, p=0.01), which means that someone who watches a lot of TV also has other risk factors which contribute to their risk of dying that have nothing to do with TV (like smoking, for example… unless they smoke because of the show their watching [?]).

Interestingly, the relationship was unaffected by controlling for physical activity (compare HR in Model B to Model C), which seems to imply that sitting too much (watching TV) is not necessarily equal to exercising too little… and in this population, ‘exercising too little’ was statistically unhealthier than ‘sitting too much.’

one from down under:

Television viewing time and mortality.  The Australian diabetes, obesity and lifestyle study (AusDiab) (Dunstan et al., 2010 Circulation)

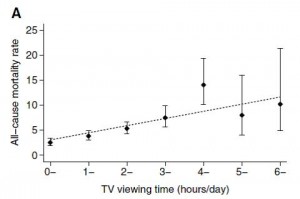
In AusDiab, TV increased the risk for all-cause mortality slightly moreso than EPIC-Norfolk, but was similarly attenuated by controlling for other risk factors:


Oddly, there is a blip at 4 hours in both AusDiab and EPIC-Norfolk.  I have no idea what this means, but it is very interesting that in both England and Australia, people who watch 4 hours of TV per day have a higher risk for all-cause mortality than those who watch for 3 or 5 hours… if you find that you’ve spent 4 hours watching TV one day, throw on a pot of coffee and watch another hour.  Food for thought.

WRT health outcomes, excessive daily TV viewing seems to be a marker for other risk factors such as obesity, smoking, etc (may even be an indirect marker for ‘family history of CVD, diabetes, etc.).  TV watching per se is not the problem, nor is I suspect the TV.  Eat less, move more?

calories proper


Episode 2 of the ketosis series

Time for the second edition of our ketosis series. Some background:  physiological ketosis occurs when the body is burning fat very rapidly, like after an overnight fast or during low carb high fat dieting (e.g., Atkins induction phase).  NB this is not the same as pathological diabetic ketoacidosis or alcoholic ketoacidosis.  In humans, ketotic diets work like a drug for fat loss.  In rodents, there are a variety of responses which although they vary widely between studies, they all provide insight into this “unique” state.

Without further ado, today’s post: A high-fat, ketogenic diet induces a unique metabolic state in mice (Kennedy et al., 2007 AJP)

This study included four! diet groups.  Although the dietary interventions were poorly designed from a nutrition perspective, the fact that there were four of them means that we should be able to learn something from this paper.

The fourth group is 66% calorie restricted (CR) chow.


As a brief aside, although the diets could have been designed better, at least their KD was a bona fide ketogenic diet (in contrast to the first paper in the ketosis series, where the ketogenic diet group was only mildly ketotic [bHB was only 50% greater in KD relative to control).   As seen in the table above, b-hydroxybutyrate, the major circulating ketone body, was markedly elevated in KD compared to the other groups.

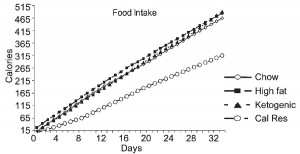
Caloric intake was similar among the groups (except CR [open circles], who ingested 33% fewer calories [by design])

One minor point: the HF diet is high in fat and sugar; KD is only high in fat, chow is low in fat, and neither KD nor chow have any sugar.  Does palatability affect food intake in mice?  If so, we might expect mice to eat more HF than KD (HF = cake icing; KD = Crisco).  And by “more,” do we mean “more calories” or “more food?”  Palatability probably doesn’t affect food intake [in the mice in this study] because although HF mice were eating just as many calories as KD and chow, they were eating much less food (higher calorie density etc.).

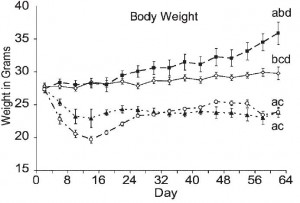
Interestingly, however, body weight differed markedly between the groups … [i sense a diatribe on the laws of energy balance… ]

HF (closed squares, top line) gained the most weight, followed by chow (open diamonds), then CR (open circles) and KD (closed triangles).  That last part is pretty amazing; mice on the ketogenic diet (KD, closed triangles) were eating half more calories than CR but they weighed just as much.  Alternatively, CR mice were eating 33% fewer calories than KD but they weighed just as much!  Either KD increases energy expenditure, or CR reduces it.

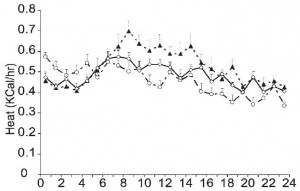
…err… or both.  Looks like KD (closed triangles) was always a little higher while CR (open circles) was always a little lower.  The figure above is showing total metabolic rate.  FTR, the units are kcal/hr which in this instance is the appropriate metric.  It is not uncommon for researchers to present these data as kcal/kg*hr, which corrects for differences in body weight.  Even though there were differences in body weight, “kcal/hr” is still the proper way to present these data because absolute, not relative, differences in metabolic rate produce changes in body weight that can be compared across groups.  Relative differences in metabolic rate, such as those that are normalized for body mass (kcal/kg*hr), are interesting and informative, but they don’t describe a variable that directly impacts body weight and can be compared across groups, which is what we are looking for in this case.

One more point needs to emphasized at this … point.

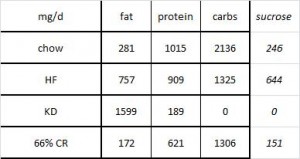
Mice fed chow, HF, and KD all ingested the same kcal/d (~15, as per figure 1.)  Since we know the composition of the diets, the amount consumed of each macronutrient can be calculated:


KD mice ate >2x more fat than HF (1599 mg vs. 757 mg).  HF mice ate the most sugar, while KD ate the least sugar.  Thus, HF mice (who were also eating a high sugar diet) diet weighed 50% more than those on the ketogenic diet, despite eating only half as much fat (and equal calories)!  Why?  *

CR mice lost weight, but their metabolic rate declined significantly (think: sluggishness, fatigue, etc.).  KD mice ate 50% more calories than CR mice but weighed exactly the same and had a higher metabolic rate (think: lots of energy, high activity level, etc.).  *

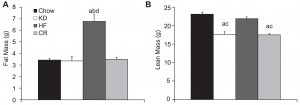
Well, actually, in terms of body composition, chow guys did the best:

HF mice accumulated the most fat mass (the product of a carb-rich high fat diet).  They also had as much lean mass as the chow group.  If we were to transcribe these data to percent body fat, chow would have the lowest (they weigh more than KD & CR, but have the same amount of fat mass; the numerator [fat mass] is the same but the denominator [body weight] is higher in the chow group).

Chow-fed mice ate the most protein and had the highest lean mass.  Coincidence?  By this you might argue that KD ate the least protein therefore they should have less lean mass than CR.  *You’re forgetting that the ketogenic diet is 0% carbs and 50% magic.

KD & CR had the lowest lean mass.  A few points about this:  for starters,  the ultra-low protein intake caused this in KD mice (muscle wasting), while in CR mice it was more likely due to a combination of deficient calories and suboptimal protein intake.  When calorie intake goes down, the amount of protein required to maintain nitrogen balance increases.  So if you reduce calories, lean mass will decline unless protein intake is increased.  In CR, calories and protein intake declined.

WRT the KD mice, they exhibited reduced lean mass but their relative metabolic rate was the highest out of all 4 groups.  Usually a loss of lean mass is accompanied by (or causes) a reduced metabolic rate, but the opposite happened.  I find this interesting.  Very interesting.

The researchers did a few more experiments*, and further confirmed that the ketogenic diet increases the absolute energy expenditure and markedly increases relative energy expenditure which allows the animals to eat just as much food while losing weight.

*actually, they did a ton more experiments, this paper was a bear.  Kudos.

They also tested “overall well-being” by measuring how much the mice explored a novel environment.  They found no difference between KD & chow, but HF mice exhibited “reduced exploratory activity.”  Translation: a high fat (ketogenic) diet is good (e.g., KD), but a high fat high carb diet is bad (e.g., HF).

For the inquiring minds, the mechanism of KD’s anti-obesity effects were most likely due to elevated heat dissipation via brown adipose tissue .  This is in contrast to which what was alluded above; although “exploratory behavior” was similar in KD mice, physical activity was not measured directly so it can’t be concluded that KD mice ran around and played more than the other mice.  Given the brown fat data, it is possible that basal metabolic rate (total heat production) was increased due to the ketogenic diet.  This could be good news for some; on a ketogenic diet, weight loss is not dependent on increased physical activity, the fat mass would simply (almost literally) melt away, no need to exercise.

This study is another example of how “eat less and move more” is wrong.  KD mice didn’t “eat less,” they ate differently; and the composition of the diet alone accomplished the “move more” part without requiring any type of exercise by increasing basal metabolic rate.  The diet did all the hard work for them.  And these mice were eating ad libitum, which means they were never hungry in contrast to the CR mice that were eating 33% fewer calories.   Calorie restricted diets are optimal for neither fat loss nor well-being.


calories proper


Marathon’ing

Another pearl debunked?

Liberation from the bane of cardiovascular exercise
Or
Time to hit the weights

Myocardial late gadolinium enhancement: prevalence, pattern, and prognostic relevance in marathon runners. (Breuckmann et al., 2009 Radiology)

In brief, this study showed that marathons kill.  Seriously.  And this applies to a lot of people; almost a half a million Americans participate in marathons annually.

MRI with late gadolinium enhancement (“LGE,” for short) a sensitive and powerful indicator of heart disease.  It gives few false positives and negatives.  Compared to other tests (EKG, stress tests, angiograms, etc.), if you have LGE you have a very high chance of cardiac mortality.

In this study, they recruited 102 recreational (nonprofessional) marathoners and 102 age-matched controls (~57 years of age).  All of the subjects were apparently healthy at baseline; anyone with pre-existing heart disease or diabetes was excluded.  The marathoners were hard-core: they ran in at least 5 marathons in the past 3 years and averaged 20 marathons in their life.  Furthermore, they ran ~35 miles per week.

12% of marathon runners had heart damage (as per LGE) compared to 4% of controls.  That is a pretty big difference: marathoners were 3 times more likely to have heart damage.

Does LGE affect cardiac events?

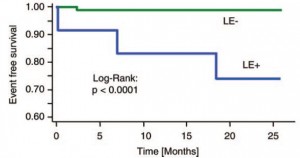
Here is a graph depicting the gravitas of LGE for marathoners:

“LE-” is the group of people with normal heart function.  Their line is almost completely straight indicating that almost 100% experienced no cardiac events.  “LE+” indicates people with LGE.  This figure basically confirms that LGE is a potent cardiac events predictor.  Over the course of the 2+ years of follow-up, 3 marathoners with LGE experienced a cardiac event compared to 1 marathoner who had normal heart function.

The numbers aren’t huge: 12 marathoners and 4 controls exhibited LGE.  4 marathoners experienced a cardiac event; 3 of them had LGE.  So marathoners were 3 times more likely to have an abnormal LGE than controls, and marathoners with LGE were 3 times more likely to experience a cardiac event than marathoners with a good heart.  IOW, a marathoner with LGE may be 9 times more likely to experience a cardiac event than a healthy control who has normal heart function.  If I were a marathoner I’d get this test done asap.  And more importantly, all of these people thought they were healthy (just like you and me); they exhibited no signs or symptoms of heart problems.

Conclusions, alternative explanations, and my take on Breuckmann’s study:

  1. Marathons are the antithesis of moderation.  They are an extremist activity.  As is running 35 miles a week.   Aerobic fitness will exhibit, like most things, an inverted U-shaped curve in relationship with mortality and quality of life.  IOW, a totally sedentary lifestyle is probably just as bad as running marathons, but running 1 mile a day or a few per week is probably beneficial.  A poor diet and sedentary lifestyle may be associated with obesity, atherosclerosis, thrombosis, whereas marathons are more like a cardiovascular-beatdown.
  2. How does marathon running kill?  Perhaps the overall stress of marathons or blood flow-induced shear stress damages the endothelial lining of vessels, which may contribute to an atherosclerotic or otherwise pathological process.  This would be exacerbated by the systemic inflammatory response associated with a prolonged high level of exertion.
  3. Then again maybe it’s all about diet:  running 35 miles per week requires a LOT of extra calories; there is bound to be some processed crap in there.  (sorry, my assumption here is that a healthy person might be able to eat a healthy 2,000 kcal diet, but if they were suddenly eating 4,000 kcal it probably wouldn’t be all the same foods as before just twice as much).  So maybe it’s the excessive caloric burden in general, or perhaps the added foods that are contributing to the problem.
  4. On the other hand, maybe they were juiced up!  I wouldn’t be surprised if running a marathon at 57 years of age required a little pharmaceutical-grade ergogenic enhancement.
  5. Last but not least, maybe their age-matched control population was not the best control group.  IOW, maybe the controls were very healthy, so anyone (including a marathoner) would appear less healthy than control.  That’s a good one.
  6. The opposite of #5.  Maybe the marathoner’s were a particularly unhealthy bunch (they were big smoker’s and drinker’s for most of their life, then gave it all up and started running… a lot of permanent damage was done prior to exercise training).


Fortunately for us, more data on these subjects were published a year earlier.

Running: the risk of coronary events : Prevalence and prognostic relevance of coronary atherosclerosis in marathon runners. (Möhlenkamp et al, 2008 European Heart Journal)

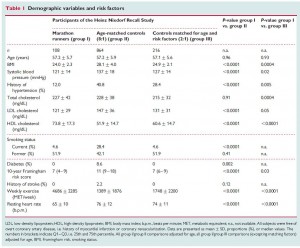
The marathoners are group I.  Group II is an age-matched control group and group III is a control group that was matched for other risk factors including BMI, lipid profile, and smoker status.  As a side note, this type of control population is far better than statistically adjusting for risk factors.  When data are statistically adjusted, you are no longer comparing people, per se, but rather are comparing a person to a mathematically derived variable (or something like that).  IOW, I really like Möhlenkamp’s choices for the control populations.

The most interesting numbers IMO:

Indeed marathoners had 42% higher HDL and 18% lower LDL than age-matched controls (like the controls from Breuckmann’s study).  This suggests lipid profile is a poor indicator of LGE.  And there were more smokers in the age-matched control group.  This basically strikes down my alternative explanation #5 above; the controls were not a healthier group of people.

Coronary artery calfification scores:

From these data (look at the middle of the three numbers in each column), it looks like although marathoners were more likely to exhibit LGE, they had a similar degree of coronary artery calcification compared age-matched controls.  Furthermore, marathoners had significantly more coronary artery calcification than the controls that were matched for other risk factors, which more implies marathon running per se increases coronary artery calcification.

Furthermore, given the increased cardiac events in marathoners compared to age-matched controls (Breuckmann’s study), these results suggest that LGE is a more powerful indicator of risk than increased coronary artery calcification.

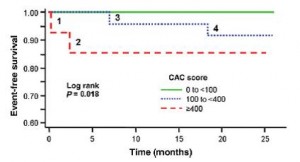
Coronary artery calcification is not a bad indicator, however:

The green line indicates event-free survival in runners with the least coronary artery calcification (they experienced zero cardiac events).  The blue dotted line is runners with intermediate coronary artery calcification, and the red dashed line is runners with the most coronary artery calcification.  This graph basically shows that the extent of coronary artery calcification is a pretty good predictor of cardiac events.


Interestingly, coronary artery calcification was not associated with years of running, miles per week, or number of marathons.  This is odd because coronary artery calcification was much worse in marathoners compared to risk-factor matched controls.   And number of marathons was significantly associated with LGE.  Does this mean that simply being a marathoner worsens coronary artery calcification, and the more you run worsens LGE?  I don’t know enough about these measurements to speculate on their pathological relationship, but in general, they are both pointing in the same direction.

But what about cardiac events in the risk-factor matched controls?  “data not shown”


More conclusions/alternative explanations:  going back to point #5 (above) regarding the possibility of an extra-healthy control group (which was subsequently de-bunked by comparing their lipid profiles and smoking history), it is also possible that this was a particularly unhealthy group of marathon runners (back to explanation #6) …  There were a LOT of former smokers; maybe it is people who started caring about their health, so they quit smoking and started running.  This could also possibly explain why coronary artery calcification was associated with marathons but not weekly running distance, number of marathons, etc.  IOW, former poor diet or lifestyle habits caused the coronary artery calcification and caused these subjects to start running (a bona fide confounding factor).  This may be supported by considering how these studies recruit their subjects.  Which marathoner is more likely to enter into this study, which entailed a labor-intensive comprehensive battery of cardiovascular and blood tests?  The recreational runner who has been healthy their whole life, to whom running is simply a hobby; or the runner who gave up their former poor diet and lifestyle to begin a health crusade and is now totally obsessed.  I think the latter has more motivation to sign-up.

But none of that explains the correlation with all measures of the marathoner (miles ran per week, number of marathons, etc) and LGE.  The LGE data suggest that marathons (training for and running in) are pathologically related to heart function.  And we still can’t rule out a role for diet!  Marathon training/running burns a LOT of calories.  Maybe it’s something their eating?  No food intake data were collected or reported in either study (but we know that unless these guys were losing weight, their food intake increased to match their expenditure; we just don’t know what they were eating).

Alternatively, maybe it’s not what they ate, but simply that they were eating so much more… the “rate of living” theory said that increased energy expenditure causes aging, disease, and death via free radicals.  Thus, caloric restriction, in which both food intake and metabolic rate are markedly reduced, improves longevity.

“Keep a quiet heart, sit like a tortoise, walk sprightly like a pigeon, and sleep like a dog.”  -Li Ching-Yuen (1677-1933)


Calories proper