Monthly Archives: February 2012

LPL, insulin, and diet, Op. 62

There are many ways to address the etiology of obesity and insulin resistance (or insulin resistance and obesity).  For example, you can follow a group of healthy people for a long time and compare those who become insulin resistant with those who don’t; alternatively, you can study a population who is predisposed to insulin resistance (e.g., offspring of type II diabetics)… regarding the latter, although it’s kind of grim, apparently healthy children of obese or diabetic parents are often in an intermediate state of insulin resistance.  It’s impossible to exclude a genetic component, but I believe environmental influences are dominant: the poor diet and lifestyle of obese parents is just as likely as obesogenic DNA to be passed on to their children.

The main reason to be concerned with these questions is that there is considerable disagreement about the specific cause of obesity and insulin resistance; i.e., which came first and does one cause the other?  Or do they simply share a common cause (e.g., hyperinsulinemia)?   I currently lean toward the “common cause” hypothesis.  Alternatively, I’d say “it’s complicated”  … insulin resistance is not one isolated phenomenon, but the end result of many interconnected biological processes.  This has important implications for treatment and prevention- if, for example, hyperinsulinemia causes obesity and/or insulin resistance, then reducing insulin levels or preventing insulin spikes should be prioritized.  And mitochondria also seem to be important.

Regulation of mitochondrial biogenesis by lipoprotein lipase in muscle of insulin-resistant offspring of parents with type 2 diabetes (Morino et al., 2012 Diabetes)

The subjects in this study were body weight and age-matched; the only major difference was impaired glucose tolerance and the presence of at least one diabetic parent in the “insulin-resistant offspring” group.  They took muscle biopsies and found, somewhat surprisingly, one of the biggest differences was the content of lipoprotein lipase (LPL).LPL is responsible for hydrolyzing circulating triacylglycerols (from chylomicrons and VLDL) to free fatty acids for tissue uptake.  Thus, this finding suggests muscle from insulin-resistant offspring is not as good at sequestering fatty acids (despite these subjects oftentimes having paradoxically higher intramuscular fat levels).  This corresponded with lower PPAR activity, mitochondria volume, and fatty acid oxidation.  And interestingly, in a set of follow-up cell culture experiments, they found that the fish oil fatty acid EPA (but not DHA) could correct this deficiency.
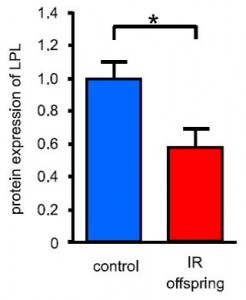
Ideally, we would like LPL activated in muscle (to take up and oxidize fatty acids) and inhibited in adipose (to prevent fat cells from getting fatter).  Fortunately, there are some relatively easy ways this can be accomplished… exercise selectively activates LPL in muscle and inhibits it in adipose, while insulin does the exact opposite.  So eat salmon, exercise, and avoid insulinogenic sugars and carb-rich foods!

Tissue-specific responses of lipoprotein lipase to dietary macronutrient composition as a predictor of weight gain over 4 years (Ferland et al., 2012 Obesity)

This study was a little more complicated than inferred by the title.  First, they took healthy adults, measured body composition and then assessed adipose vs. skeletal muscle LPL activity in the fasted and fed states after 2 weeks of a high fat or high carb diet.  To make a long story short:In lean subjects (table above), a high carb meal (after 2 weeks of high carb dieting) markedly increased adipose LPL by 153% (top row) (this is bad), and modestly increased it in skeletal muscle (80%, second row).  The high fat meal (after 2 weeks of high fat dieting) caused a smaller increase in adipose LPL (92% vs. 153%) and bigger increase in skeletal muscle LPL (80% vs. 100%) (this is good).  Thus, a high carb diet caused the most detrimental changes in adipose LPL while a high fat diet caused the most beneficial changes in skeletal muscle LPL.
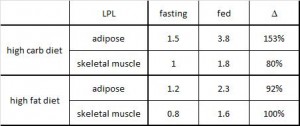
Next, they compared these acute effects with changes in body composition over the course of 4 years and found that the biggest predictor of increased fat mass was the response of adipose LPL to a high carb diet.

The Morino study showed that increased skeletal muscle LPL was positively associated with insulin sensitivity, while the Ferland study showed that a high carb diet increased adipose LPL and this was positively associated with fat mass gain over 4 years.  Skeletal muscle LPL is good, adipose LPL is bad (Rx: EPA [salmon], exercise, and keep insulin levels low).

Dare I say “nutrient partitioning?”  this might be one way to reduce body fat without drastically cutting calories.  Adopt an LPL-modulating diet and lifestyle!  The effect on fat mass not huge, about a pound per year, but that adds up to 10 pounds over the course of a decade… obesity doesn’t happen overnight.


calories proper

Insulin per se

This recent manuscript nearly slid beneath the radar… almost stopped reading at the abstract until the word “nifedipine” appeared (among its widely pleiotropic effects, nifedipine also lowers insulin).

The series of experiments described below demonstrate one aspect of the scientific method reasonably well.  None of the individual experiments, when viewed in isolation, really prove the hypothesis.  But the researchers tested it with a variety of widely different methods and all of the results went in the same direction.  The hypothesis in question: insulin causes fat gain, and hyperinsulinemia per se, not macronutrients or calories, is the root cause.

This group has previously shown that sucrose is more detrimental than fish oil is beneficial toward obesity and glycemic control.

High glycemic index carbohydrates abrogate the anti-obesity effect of fish oil in mice (Hao et al., 2012 AJP)

Divide and conquer
Mouse study.  Lots of diets, in brief:
Pair fed: high fish oil (180 g/kg) plus 13%, 23%, 33%, and 43% sucrose (by weight, switched out for casein [a poor choice IMO])
High fish oil (180 g/kg) plus sucrose, fructose, glucose, low GI carbs, and high GI carbs.
That’s a lot of diets.  Kudos.

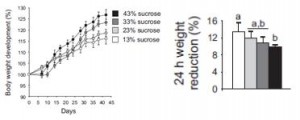
As expected, higher sugar and lower protein intakes enhance weight gain (yes, even when pair-fed similar calories [i.e., a calorie is not a calorie]) and this is at least partly due to reduced metabolic rate (as per the poor man’s energy expenditure test- measuring body weight before and after 24 hours starvation [higher weight loss = higher metabolic rate]):High sucrose-fed mice also had more inflamed adipose tissue and less thermogenic brown fat, which likely contributed to their glycemic dysregulation and elevated adiposity.

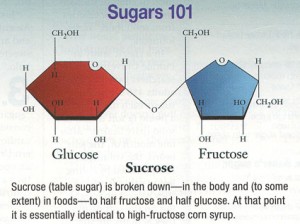
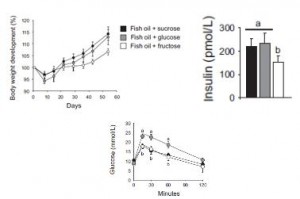
Sucrose is comprised of glucose and fructose, so to determine which component was causing obesity, they fed mice high fish oil diets plus either sucrose, glucose, or fructose.  Interestingly, the glucose group gained as much weight as the sucrose group.  Since the fructose group gained the least amount of weight, the researchers attributed the sucrose-induced obesity to insulin! (fructose doesn’t elicit an insulin response; and insulin levels were lowest in the fructose group).

Body weight, plasma insulin, and glucose tolerance:

I. Thus far: glucose and sucrose cause obesity by stimulating insulin secretion.  Glycemic deterioration is worst in the glucose-fed group because they were consuming most of the most insulinogenic sugar: glucose.  It was lower in the sucrose and fructose groups because sucrose contains only half as much glucose as pure glucose, and fructose contains no glucose.  IOW, these data suggest hyperinsulinemia per se causes obesity and insulin resistance.  Gravitas.

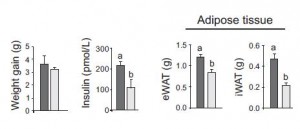
They further tested this by comparing high and low GI diets which cause higher and lower insulin levels, respectively.  As expected, the low GI diet led to less weight gain, and significantly lower insulin levels and adipose tissue accumulation compared to the high GI diet:

II. Thus far: high insulin levels, whether induced by glucose, sucrose, or high GI starch, lead to obesity.

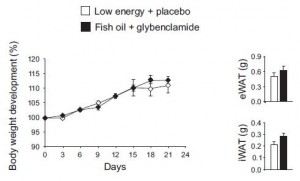
They next took a non-dietary approach by artificially increasing insulin levels with glybenclamide in fish oil-fed mice to see if hyperinsulinemia could still cause obesity.  The results weren’t robust, but the higher insulin levels tended to increase adiposity even in mice fed the anti-obesogenic fish oil diet. 

In the experiment, the opposite approach was taken: nifedipine was used to lower insulin.  The use of octreotide and diazoxide has been used in a similar context with similar results in humans, discussed HERE and HERE.Again, the results were not robust, but when viewed collectively a picture begins to emerge: raising insulin levels, whether it is with a high glucose or sucrose diet, a high GI diet, or glybenclamide increases adipose tissue growth; and conversely, lowering insulin levels, whether it is with a less insulinogenic sugar diet (fructose), a low GI diet, or nifedipine decreases adipose tissue growth.  Oh yeah, and low carb works too.


calories proper


Gluc-a-gone wild, Op. 60

optional pre-reading

Q. What happens to a type I diabetic when you 1) withhold insulin, 2) provide insulin, or 3) withhold insulin and suppress glucagon?  (Charlton and Nair, 1998 Diabetes)…

A. You learn glucagon is the bad guy.

Divide and conquer

Zero insulin makes you hyperglucagonemic, hyperglycemic, and ketoacidotic (see first column).  Insulin cures all of these things (second column), but they aren’t caused by insulin deficiency, per se… they’re caused by high glucagon, which itself is cured by insulin (second column) and SRIH (somatostatin, third column).  Cure the hyperglycemia by inhibiting glucagon and pathological diabetic ketoacidosis suddenly becomes physiological ketosis.

Uncontrolled diabetes also wastes muscle:Zero insulin makes you hypermetabolic and increases amino acid oxidation.  Insulin cures this, but again, it appears to be driven by hyperglucagonemia, not insulin deficiency.

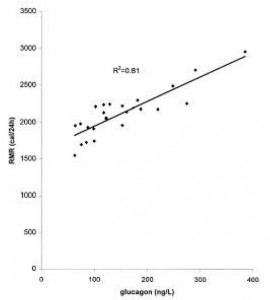
Glucagon directly correlates with energy expenditure, and this isn’t the good metabolic rate boost sought by dieters, it’s the type that indiscriminately burns everything including muscle.  High protein diets also increase energy expenditure, but in pathological hyperglucagonemia, the amino acids come from muscle, not food.

The above mentioned study is most relevant to type I diabetes.  The following study is about glucagon and the far more common type II diabetes (Petersen and Sullivan, 2001 Diabetologia).

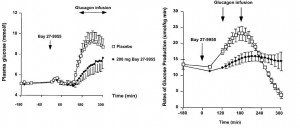
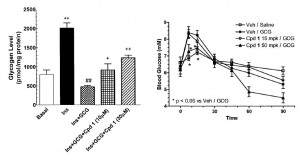
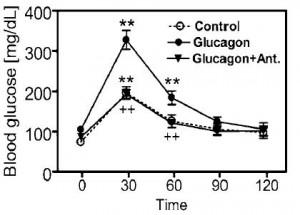
The effects of hyperglucagonemia can be blunted by glucagon receptor antagonists (GRAs).  In the figure below, a GRA (Bay-27-9955), was administered immediately prior to a glucagon infusion.  The GRA significantly reduced blood glucose levels, an effect largely attributed to the reduction in endogenous glucose production:One of the ways GRA’s accomplish this is by keeping glucose tied up in hepatic glycogen instead of flooding into the plasma (Qureshi et al., 2004 Diabetes; “CPD” is the GRA used in this study).  The figure on the left is primary human hepatocytes; on the left is in mice.Another way of looking at this is in mice chronically treated with glucagon or glucagon plus a GRA.  Glucose tolerance is obviously deteriorated by glucagon treatment, but is completely restored by a GRA (Li et al., 2008 Clinical Science):

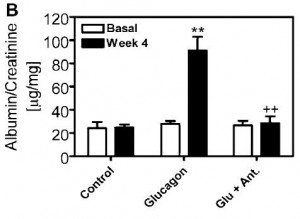
One of the most severe side effects of diabetic hyperglycemia is nephropathy, which is similarly cured by GRA treatment:

The physiological role of glucagon is to prevent hypOglycemia; but hypERglycemia is the problem most of the time.  Don’t get me wrong, hypOglycemia can be deadly, but 1) it’s not nearly as prevalent as hypERglycemia, and 2) inhibiting glucagon doesn’t cause hypoglycemia, there are a battery of counterregulatory hormones that prevent hypoglycemia.

Furthermore, reducing glucagon action isn’t limited to glucagon receptor antagonists (GRAs), leptin and amylin can do it too!

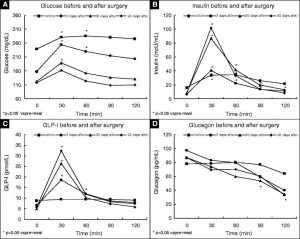
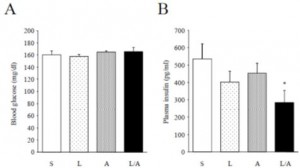
And while gastric bypass surgery is easily more extreme than GRA’s and leptin or amylin therapy, it’s magical effect on diabetes remission might also be partly attributed to glucagon suppression (Umeda et al., 2011 Obesity Surgery):

Convinced yet?


calories proper
Leptin and insulin: resistance is futile, Op. 59

The biochemical similarities between resistance to the metabolic effects of leptin and insulin are ultra-complicated.  The studies discussed below suggest leptin sensitization is a pre-requisite for glycemic improvement and weight loss.  Similarly, low leptin levels (independent of fat mass) appear to be linked with high insulin sensitivity and the ability to lose weight.  “Low leptin” in this context (i.e., independent of fat mass) does not refer to the starvation-induced rapid decline of leptin or the complete absence of leptin, but rather to a high degree of leptin sensitivity (analogous to insulin sensitivity?).  The level at which this signal is mediated, however, remains to be determined (adipocyte? sympathetic nervous system? brain? in the Electric Kool-Aid?).

Is the resistance to high levels of endogenous leptin in established obesity similar to the effects (or lack thereof) of exogenously administered metreleptin?

Divide and conquer

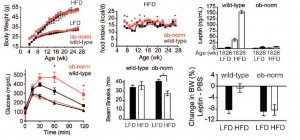
My current hypothesis: 1) leptin sensitivity needs to be high and 2) leptin levels need to be adequate (too low and leptin sensitivity is meaningless; too high and you become leptin resistant).  This is summarized nicely in this clever little experiment (Knight et al., 2010 PLoS ONE).  Ob/ob mice genetically lack leptin.  Zero leptin, and monstrously obese (the mouse on the right).  If you add back the amount of leptin found in a lean insulin sensitive mouse (~5 ng/mL), they gain just as much weight on any diet as normal mice (and much less than untreated ob/ob mice [the mouse on the right]).  But here’s the catch: on a high fat diet, treated ob/ob mice gain as much weight (top row, left figure) despite much lower leptin levels (top row, right figure).

Ob-norm mice are phenomenally leptin sensitive (bottom right), but do not have enough leptin to support insulin sensitivity (bottom left) or physical activity (bottom middle figure).  If leptin levels are too high (wild-type mice on high-fat diet), on comes leptin resistance (bottom right) and glucose intolerance (bottom left).  This picture is incomplete but good enough to support the claim that leptin sensitivity needs to be high and leptin levels need to be adequate.

Insulin-resistant patients with type 2 diabetes mellitus have higher serum leptin levels independently of body fat mass (Fischer et al., 2002 Acta Diabetologia)

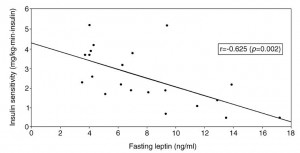
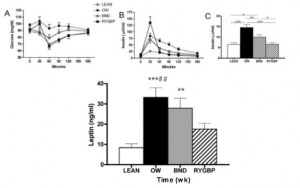
Higher insulin sensitivity in those with the lowest leptin levels (this group is probably the most leptin sensitive):The most insulin sensitive group (Tertile 3) has the lowest leptin levels but also the lowest body fat (i.e., it could be confounded by fat mass)

But the middle group is more insulin sensitive than the lowest group (by definition), and has lower leptin levels despite being fatter.  So it’s definitely not confounded by fat mass, and I think this is because they are more leptin sensitive.

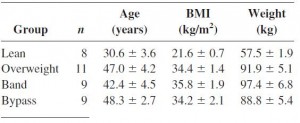
Differential effects of gastric bypass and banding on circulating gut hormones and leptin levels (Korner et al., 2006 Obesity)  

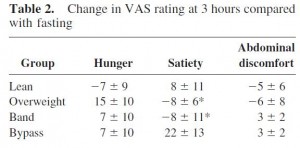
Still not confounded by weight loss because the banded group weighed more but had lower leptin and higher insulin sensitivity than the overweight group.  In support of enhanced leptin sensitivity in the gastric bypass group, they experienced a significantly greater increase in post-meal satiety than the other groups.  Similarly, the overweight group (who have much higher leptin levels) actually experienced a decline in satiety after eating!

Now we’re getting somewhere!

Amylin improves the effect of leptin on insulin sensitivity in leptin-resistant diet-induced obese mice (Kusakabe et al., 2012 AJP)

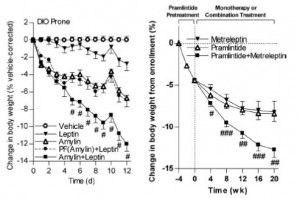
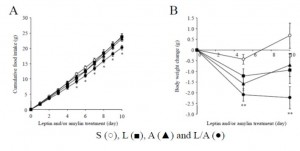
Injection with leptin (squares) or amylin (triangles) alone does not reduce food intake or body weight in leptin-resistant diet-induced obese mice (open circles), but a combination of leptin and amylin does both (closed circles).Importantly, as seen in the figure below, neither leptin nor amylin alone improves glycemia.  Theoretically, this is because leptin sensitization is required to improve insulin sensitivity.  And amylin improves leptin but not insulin sensitivity.  The far right column in the right graph shows that the leptin-amylin co-treated group were more insulin sensitive.

Leptin sensitization is required to improve insulin sensitivity.  So why didn’t amylin alone improve the sensitivity to endogenous leptin? … perhaps because leptin sensitivity was high but leptin levels were inadequate.  Amylin-alone also lowered endogenous leptin levels, which may have counterbalanced the improved leptin sensitivity (top row, compare the first and third columns):In other words, the leptin-resistant mice could be artificially made more sensitive to their own endogenous 28.5 ng/mL of leptin with 100 ug/kg/d amylin, but not to their lower 19.7 ng/mL of leptin (in this study).

In rats, however, 100 ug/kg/d amylin is capable of endogenous leptin sensitization despite similar reductions in endogenous leptin (Roth et al., 2008 PNAS):This graph is showing a proxy for leptin sensitivity in rat brain.  The black bars are vehicle-treated, the white bars are leptin-treated.  Amylin-alone increased sensitivity to both endogenous leptin (second to the last bar) and exogenous leptin (last bar).  And indeed, amylin-alone (open triangles in the figure below) reduced body weight; the addition of exogenous leptin further reduced body weight (compare inverted triangles [leptin alone] to squares [leptin plus amylin]).

Similar results are obtained in humans (figure on the right).

The intermediate effects in mice illustrate an important point.  Amylin-induced sensitization to endogenous leptin, as seen in rats and humans but not mice, is required to reap the full benefits of leptin re-sensitivation.  This didn’t occur in mice, but occurred in all species (including mice) when exogenous leptin was administered to restore leptin to an adequate level.

In sum, restoration of leptin sensitivity is required for glycemic improvement and weight loss regardless of whether it is achieved by gastric bypass (Korner study, above), amylin treatment (Kusakabe study in mice; Roth study in rats and humans), a sugar-free diet (Shapiro study, discussed HERE), or a low-carbohydrate diet (Brehm et al., 2003 JCEM – greater weight loss and glycemic improvement despite eating more calories [associated with lower leptin levels]).  Personally, I’d attempt either of the latter prior to gastric bypass or pharmacological therapy with an experimental cocktail of metreleptin and pramlintide.  But that’s just me.

Just like insulin, you gotta get leptin levels down, not up, to see benefits.

calories proper
the metabolic orchestra

What’s on YOUR plate?

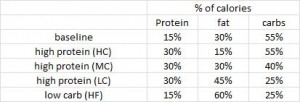
whenever something goes up, something else goes down.  e.g., compare the fat and carbs in the three 30% protein diets:

It is virtually impossible to study macronutrients in isolation, but by looking collectively at a wide range of diet intervention trials, we can get some insight into the metabolic program orchestrated by fat, protein, and carbohydrates.

the “bar:” if we are to conclude that increasing nutrient “A” causes effect #1, then it must be true if the calories are compensated by 1) lowering nutrient “B” while leaving nutrient “C” unchanged, and 2) lowering “C” while keeping “B” unchanged.  And it doesn’t count if this is accomplished indirectly by abstract statistics.

Divide and conquer

Comparison of high-fat and high-protein diets with a high-carbohydrate diet in insulin-resistant obese women (McAuley et al., 2005 Diabetologia)  

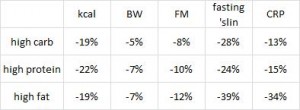
To make a very long story very short, here’s what happened after 24 weeks:

Abbreviations I: kcal, food intake in calories; BW, body weight; FFM, fat-free mass (muscle); FM, fat mass; ‘slin, insulin; CRP, C-reactive protein

Abbreviations II: HC, high carb; HP, high protein; HF, high fat

Abbreviations III: LC, low carb; LP, low protein; LF, low fat

Despite similar calorie reductions, HF lost more BW and FM than HC (HP was intermediate).  Fasting insulin was reduced most in HF and this group lost the most fat.  Anyone as surprised as me about the dramatic reduction in CRP in the HF group?  (+2 for HF)  Fasting insulin was reduced the least by HP but HP lost more fat than the HC.  You might think this undermines the insulin-fat theory, but alas, draw your attention to the kcal’s.  Perhaps the bigger reduction in calories in HP helped them shed a little more fat than HC despite a lower reduction in insulin. Furthermore, HF lowered insulin more and they lost more fat but had the same caloric deficit as HC.

But does it meet the “bar?” IOW, are these results due to the abundance of dietary fat or the lack of carbs?

Alternatively, is HC inferior because of the low fat content or the high carb content?  To address this, we need to compare two diets with similar fat but different carbs.

Effect of an energy-restricted, high-protein, low-fat diet relative to a conventional high-carbohydrate, low-fat diet on weight loss, body composition, nutritional status, and markers of cardiovascular health in obese women (Noakes et al., 2005 AJCN)

This study was half as long (12 weeks vs. 24 weeks), but compensated by a more robust calorie deficit 

Both groups were supposed to undergo an identical degree of calorie restriction, but HP lost slightly more weight despite eating slightly more food than HC.  HP also lost more fat and their insulin was more suppressed.  And importantly, HP lost less muscle than HC.  (and wow, check out those CRP data [+2 for HP]).  This was all confirmed in a much larger year-long study comparing two 30% fat diets, HP vs. HC, with nearly identical results (Due et al., 2004 International Journal of Obesity)

Summary thus far:

McAuley (first study; three moderate protein diets: fat vs. carb)
high fat is superior to high carb     or     low carb is superior to low fat

Noakes (second study; two low fat diets: protein vs. carb)
high protein is superior to high carb     or     low carb is superior to low protein

To bring this around full circle: both HF and HP independently beat HC, so what do you think would happen in a face-off between HF and HP?

Carbohydrate-restricted diets high in either monounsaturated fat or protein are equally effective at promoting fat loss and improving blood lipids (Luscombe-Marsh et al., 2005 AJCN)  

This study was of intermediate duration (16 weeks) but had the greatest weight loss:

HF vs. HP?  It’s a tie!!  Insulin was reduced more by HP and fat mass declined ever so slightly more in this group, but the difference was very small.  When the data were broken down by genders, women did retain more muscle on HP but again, the difference was small.

Luscombe-Marsh (third study; two low carb diets: protein vs. fat)
high protein is equal to high fat     or     low protein is probably just as bad as low fat

So if anyone tries to quiz you about diets and weight loss, like the way my colleagues relentlessly do to me whenever a new diet study is published, armed with this knowledge you should be able to guess the outcome (probably)…

I know what you’re thinking… what if they try to trick me, like comparing the effects of HP to high fiber??  Fiber is supposed to be good for you, green leafy vegetables and all, right?

Just stick to the data outlined above.

Comparison of high protein and high fiber weight-loss diets in women with risk factors for the metabolic syndrome: a randomized trial (Morenga et al., 2011 Nutrition Journal)  

With the exception that the high fiber group was getting 39 grams of fiber per day while HP was only getting 24 grams.

This was the shortest study (8 weeks) and accordingly weight loss was the least.

Victory!  despite a significantly lower reduction in calorie intake, HP lost more weight than high fiber.  HP also lost less muscle, more fat, and insulin declined to a greater degree.
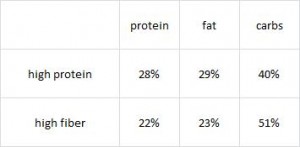
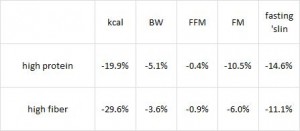
Morenga (fourth study, two mixed diets: protein vs. fiber)
higher protein, higher fat, and lower carbs are superior to high fiber

just don’t gamble with this information


calories proper