Monthly Archives: April 2011

Sugar vs. fat

This can be considered as somewhat of a follow-up to the previous post about the deleterious effect of the high fructose high fat diet in rats.  As a brief refresher, rats fed high fat were far healthier than those fed high fat and high fructose.  IOW, sugar makes everything bad happen.  In the current study, researchers first tested a high fat diet vs. a high fat high sugar diet, got interesting results, and asked the obvious follow-up question: what about high sugar alone?

A free-choice high-fat high-sugar diet induces glucose intolerance and insulin unresponsiveness to a glucose load not explained by obesity. (La Fleur et al., 2011 International Journal of Obesity)

The diets were odd, as is such when including “free-choice.” All rats received standard chow; those in a high-fat group (HF) were given a dish of beef tallow, which is high in saturated fat, while those in a high-sugar group were given a bottle of 30% sucrose (table sugar), which is composed of glucose and fructose in a 1:1 ratio (similar to high-fructose corn syrup).  Rats in the high-fat high-sugar (HFHS) group received both.

Fortunately, the researchers measured food intake with meticulous detail, so we know exactly how much sugar, fat, and calories were ingested.

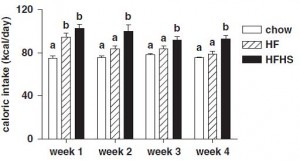
For starters, when given the option of a high-fat high-sugar food, rats [and people] eat more:

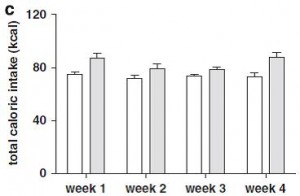
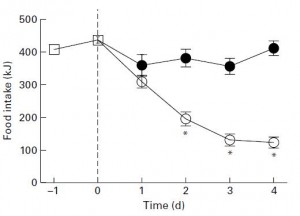
As seen above (for HF) and below (for HS, closed bars), this is not the case when either are fed alone:

The increased calorie intake exhibited by the rats fed HF during week 1 was probably due to the increased caloric density of the food.  As soon as their brain detected the increased calorie influx, less food was ingested leading to a normalization of calorie intake.  This is not the case when sugar is added to the fat; considering eating butter (high fat) or icing (high fat high sugar).   Of which would you eat more?

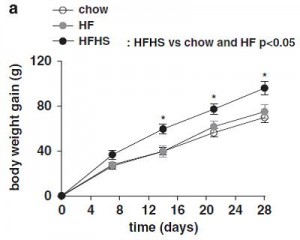
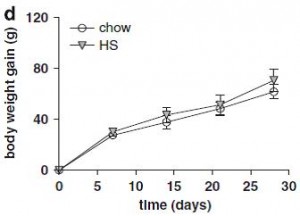
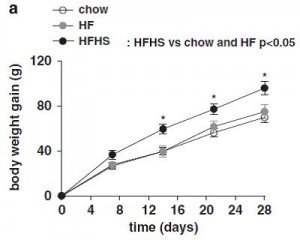
Body weight followed a similar pattern, which HFHS gaining more weight than any other group.

Unfortunately these researchers measured fat mass by excising and weighing the individual adipose depots.  This method is inferior to most other techniques and is very inaccurate but very cheap.  So we will never know precisely how body composition was affected by these interventions.

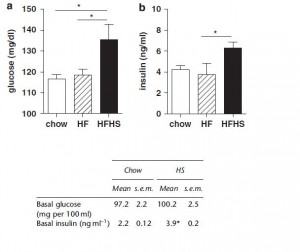
Basal glucose and insulin were elevated in HFHS, but not HF.  Basal insulin was elevated in HS.  IOW, high fat alone did not alter body weight, basal insulin, or basal glucose, while high sugar caused an increase in basal insulin.  Thus, while HFHS is the real bad guy, HS is almost as bad.

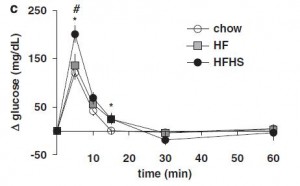
This is roughly similar to what was we saw previously.  In accord with the body weight results, and as is usually the case, glycemic response to an intravenous glucose load was most impaired in HFHS:

Did this study bring anything new to the surface?  You be the judge.  I’m still trying to figure out why the title of the paper stated that these effects were “not explained by obesity.”  In their conclusion, the authors stated that rats fed HF and HFHS became obese, but that’s not true:

HFHS became obese, while HF remained at the same body weight as control.  The authors tried to stretch it to 1) exonerate (or not fully condemn) HS, and 2) put HF in the same ballpark as HFHS.  Things look differently when the conclusions are viewed with the data posted right next to them.  According to their data, rats on the HF diet looked similar to controls while those on HS had elevated fasting insulin:

Furthermore, and I hate to have to butcher graphs like this, but if you directly compare the results shown in  Tables 1 and 2, it is clear that rats fed the HS diet exhibited significant metabolic derangements, similar to HFHS, while HF stayed relatively healthy.

Note the results from the first experiment for glucose AUC: chow (1010), HF (872), and HFHS (1505), compared to the results from the second experiment for glucose AUC: chow (1153), and HS (1447).  In the first experiment, HFHS was much worse than chow; in the second experiment, HS was as worse than chow as HFHS was in the first experiment.

Also, basal glucose was lower in HF compared to controls (117.2 vs. 121.0), while it was higher in HS compared to controls (95.2 vs. 90.7).

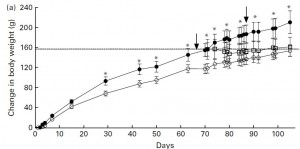
Actually, these data (not the interpretation) are in close agreement with those from that previous post:

High fat high sugar (closed circles), sugar free high fat (open circles), and high fat high sugar switched to sugar free high fat (open squares).

So I’m not really sure why the authors interpreted these data to mean that HF was worse than HS and almost bad as HFHS.  This is categorically untrue.  A case of lipophobia?  Or perhaps it’s what you get when a bunch of neuroscientists try to conduct [and interpret!] a study about nutrition.  This study was done at the Rudolf Magnus Institute of Neuroscience in the Netherlands.


Calories proper


Fructose vs. leptin, et al.

These researchers set out to tackle a huge issue, but ended up answering 2 very small parts of 1 very important question.  That is, does fructose cause obesity?  More specifically, they were asking about the relationship between fructose, leptin resistance, and obesity.  Leptin is the homeostatic wonder protein; it is secreted from fat cells when they are full, and signals “well-fed” to the brain.  Downstream effects include increased metabolic rate, fertility, reduced appetite, and more energy.  During fasting, leptin rapidly plummets which signals “starvation” to the brain.  Downstream effects include reduced metabolic rate, infertility (not enough stored energy or food available to support a baby), and hunger.  In obesity, leptin is very high but the signal never makes it to the brain = leptin resistance.  Theoretically, if leptin sensitivity of an overweight or obese patient could be improved, their physiology would ‘normalize’ resulting in the loss of excess fat mass.

These are rat studies.

Fructose-induced leptin resistance exacerbates weight gain in response to subsequent high-fat feeding. (Shapiro et al., 2008 AJP)

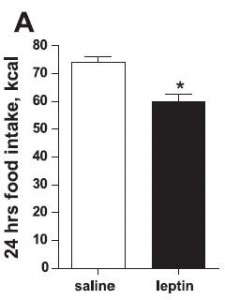
In this first set of experiments, the chow-fed rats were switched to low fat diet with or without a high dose of fructose.  Prior to starting the feeding trial, all rats were leptin-sensitive (i.e., leptin injections caused a reduction in 24 hour food intake):
After 6 months, body weight, fat mass, water weight, lean mass, serum leptin levels, and food intake were identical between rats fed control and high-fructose diets:
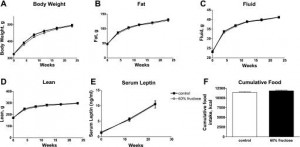
remember, both diets are very low fat.  This may appear counterintuitive; shouldn’t a high fructose (high sugar) be more fattening than a high starch diet?  Sometimes.  Rodents, however, fatten with extremely good efficiency on a high fat diet.  So added fructose on a low-fat diet is not very obesogenic in rodents.

HOWEVER, the fructose-fed rats were leptin-resistant:
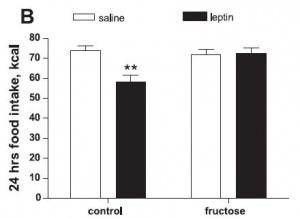
This is interesting.  Frank leptin-resistance per se, as exhibited by the fructose-fed rats, did not cause obesity, increased fat mass, or increased food intake… I’m not sure what this means.  If they were leptin resistant, shouldn’t they have eaten more or had increased fat mass?  In any case, at least we can say that fructose caused leptin-resistance in this paradigm.

Next, half the fructose-fed rats were switched to a low fructose very high fat diet.

after 2 weeks, things started to look very differently:
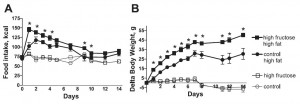
Rats previously fed high fructose (closed squares) gained significantly more weight than those previously fed low fructose (closed circles) (and rats that continued on their normal low fat high fructose (open squares) or low fructose control (open circle) diets still weighed the same).  This was not magical, the rats previously fed high fructose ate significantly more of the very high fat diet than rats previously fed the low fructose diet.

I am still a bit confused as to why fructose-induced frank leptin resistance had no effect on food intake or fat mass in rats fed the low fat diet.  But I find it very interesting that fructose-induced leptin resistance turned into high fat diet-induced hyperphagia and obesity despite very low fructose in the high fat diet… IOW, this may be a ‘legacy’ effect of fructose.  Fructose loads the gun…  (take away the fructose and you’ve still got a loaded gun) …

Although somewhat confusing, some of these findings are in accord with my belief that in the etiology of obesity, physiology is considerably disrupted prior to the onset of weight gain.  The source of this disruption is the diet.

This same group of researchers did a nice follow-up study in 2011.  They showed that 1) leptin-resistance increased the susceptibility to high fat diet-induced obesity (2008 study); and now they wanted to test if 2) this was reversible (2011 study).

Prevention and reversal of diet-induced leptin resistance with a sugar-free diet despite high fat content (Shapiro, Scarpace, et al., 2011 British Journal of Nutrition)

From a nutritionist’s perspective, the diets were chosen fairly well:

Divide and conquer.

For the first week, food intake was highest on the very high fat diet, and accordingly, they gained the most weight:
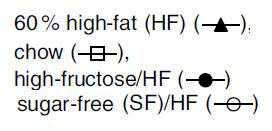
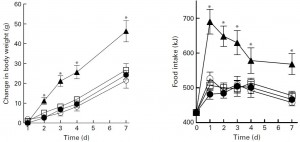
Looks like short-term fructose intake (@ 40% of calories) isn’t so bad when dietary fat is only 30% (HFr/HF, closed circles).

Just looking at chow (closed squares) vs. SF/HF (sugar-free high fat, open circles):
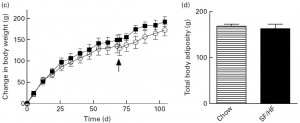
The figure on the right is fat mass assessed at day 70.  Of note, both of these diets are sugar free, and SF/HF has almost twice the fat (chow, 17% fat; SF/HF, 30% fat).  In other words, a sugar-free high fat diet does not cause obesity.  So, high fructose low fat didn’t cause more fat gain compared to high starch low fat (2008 study), and sugar-free high fat didn’t cause more fat gain compared to sugar-free low fat (2011 study).

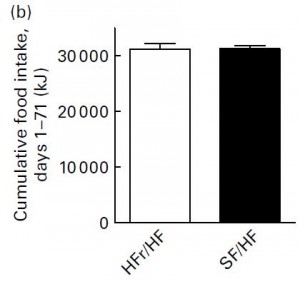
In their next experiment, they compared HFr/HF vs. SF/HF.  These diets are very similar except that instead of fructose, the SF/HF diet contains starch.  Both contain 50% carbs & 30% fat.

Despite ingesting a similar amount of calories,
the SF/HF group (open circles) gained significantly less weight:
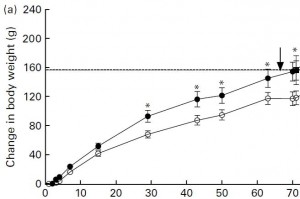
So fructose is significantly more fattening than starch (anyone surprised?).  And interestingly, fructose’s intrinsic fattening capacity extends beyond its caloric contribution (same total calorie & fat intake in both groups).  [Same calorie intake, more fat gain with fructose relative to starch … all calories are not created equal!]

Next, they tested leptin sensitivity.  This was done by injecting leptin intraperitoneally and measuring food intake for the next 24 hours.  Leptin is supposed to induce satiety (i.e., reduce food intake).  Leptin injections reduced food intake in SF/HF but not HFr/HF:
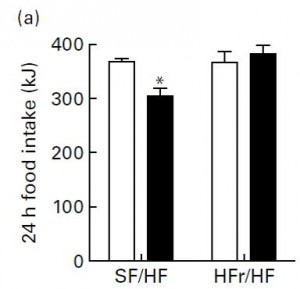
Open bars are before leptin injection, closed bars are after.  So fructose caused increased fat mass and leptin resistance.  This brings up an important point.  That is, if the HFr/HF group was leptin resistant, why did they eat as much as SF/HF?  More on this below.

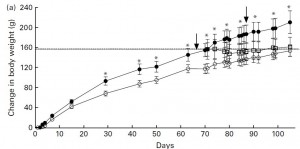
After 70 days on the diet, the researchers did something interesting.  So far, we have seen that fructose can cause leptin resistance on low fat (2008) and high fat diets (2011).  Next they researchers asked if removing fructose could reverse the leptin resistance.  So they took the HFr/HF group and switched half to SF/HF.  WRT body weight gain, rats fed the HFr/HF diet (closed circles) continued on their normal route while those switched to the SF/HF diet (open squares) gained significantly less weight and actually started to approach the weight of rats who were fed the SF/HF diet all along:
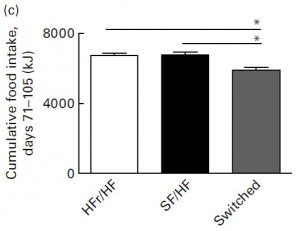
Importantly, this normalization was not in fact magical, the rats switched from HFr/HF to SF/HF consumed fewer calories than the other two groups:
18 days after the switch, leptin sensitivity was re-assessed:
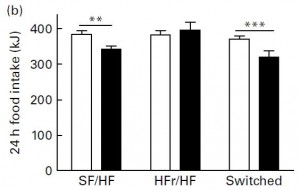
In as little as 18 days, leptin sensitivity was completely restored by removing fructose.  This says, fairly conclusively, that in this context, fructose was sufficient to cause leptin resistance.  (… now I challenge someone to find a study showing that fructose is necessary to cause leptin resistance … necessary and sufficient are two very important factors to determine true causality on a number of levels).

To really drive this home, leptin sensitivity was assessed by injecting leptin directly into the brain:
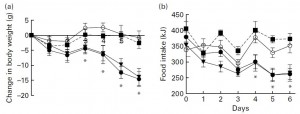
The open circles are the controls (SF/HF injected with saline).  They showed no major changes in BW or FI, just like the leptin resistant HFr/HF rats who actually received leptin injections but were leptin-resistant (closed squares).  The rats fed SF/HF (closed circles) and those switched from HFr/HF to SF/HF (closed inverted triangles) exhibited significantly reduced food intake and they lost weight.

One small plastic wrench in the gears.  When switched from HFr/HF to SF/HF, the rats ate significantly less.  They were also more leptin sensitive.  Did they eat less because removing fructose normalized their appetite?  That would be the more attractive conclusion, however it turns out that SF/HF didn’t taste as good as HFr/HF (surprise surprise, this is why your soda is filled with high-fructose corn syrup, not starch).   When rats accustomed to chow (open squares) were given access to both HFr/HF (closed circles) & SF/HF (open circles), they chose HFr/HF:
Take-home points:  as long as there was no sugar, the high fat diet did not cause obesity.   The level of dietary fat used in this study was about 2-3x higher than standard rodent chow.  Fructose + high fat caused obesity, leptin resistance, and overconsumption; removing fructose reversed these things.  Fructose possesses an intrinsic fattening element beyond its caloric contribution.


Now back to the calorie, fat mass, food intake issue mentioned above:

the HFr/HF group was leptin resistant, had more fat mass, but ate the same amount of food as SF/HF, which led me to conclude that fructose possesses an intrinsic fattening capacity beyond its caloric value.  HFr/HF rats were eating just as many calories as SF/HF rats; and they weighed more, so if you normalized food intake to body weight, HFr/HF rats would actually be eating less than SF/HF despite gaining more weight… so how can I say they were eating too much?

For one, the end justified the means.  They were accumulating fat mass, ipso facto however many calories they were ingesting was too much.  As mentioned above, HFr/HF were eating less if normalized to body weight, but since body weight is irrelevant in the face of increased adiposity, we can say that indeed, the HFr/HF group was simply eating too much.  In this example, it is helpful to consider food intake relative to energy expenditure.  Thus, neither food intake nor energy expenditure needs to be measured, only changes in fat mass.  I believe this is valid because 1) certain dietary components, e.g. fructose, have metabolic effects beyond their caloric value, and 2) while body weight may be governed by calories, fat mass is not.  Calorie counting does not work.


Calories proper


Marathon’ing

Another pearl debunked?

Liberation from the bane of cardiovascular exercise
Or
Time to hit the weights

Myocardial late gadolinium enhancement: prevalence, pattern, and prognostic relevance in marathon runners. (Breuckmann et al., 2009 Radiology)

In brief, this study showed that marathons kill.  Seriously.  And this applies to a lot of people; almost a half a million Americans participate in marathons annually.

MRI with late gadolinium enhancement (“LGE,” for short) a sensitive and powerful indicator of heart disease.  It gives few false positives and negatives.  Compared to other tests (EKG, stress tests, angiograms, etc.), if you have LGE you have a very high chance of cardiac mortality.

In this study, they recruited 102 recreational (nonprofessional) marathoners and 102 age-matched controls (~57 years of age).  All of the subjects were apparently healthy at baseline; anyone with pre-existing heart disease or diabetes was excluded.  The marathoners were hard-core: they ran in at least 5 marathons in the past 3 years and averaged 20 marathons in their life.  Furthermore, they ran ~35 miles per week.

12% of marathon runners had heart damage (as per LGE) compared to 4% of controls.  That is a pretty big difference: marathoners were 3 times more likely to have heart damage.

Does LGE affect cardiac events?

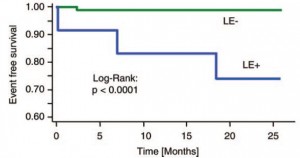
Here is a graph depicting the gravitas of LGE for marathoners:

“LE-” is the group of people with normal heart function.  Their line is almost completely straight indicating that almost 100% experienced no cardiac events.  “LE+” indicates people with LGE.  This figure basically confirms that LGE is a potent cardiac events predictor.  Over the course of the 2+ years of follow-up, 3 marathoners with LGE experienced a cardiac event compared to 1 marathoner who had normal heart function.

The numbers aren’t huge: 12 marathoners and 4 controls exhibited LGE.  4 marathoners experienced a cardiac event; 3 of them had LGE.  So marathoners were 3 times more likely to have an abnormal LGE than controls, and marathoners with LGE were 3 times more likely to experience a cardiac event than marathoners with a good heart.  IOW, a marathoner with LGE may be 9 times more likely to experience a cardiac event than a healthy control who has normal heart function.  If I were a marathoner I’d get this test done asap.  And more importantly, all of these people thought they were healthy (just like you and me); they exhibited no signs or symptoms of heart problems.

Conclusions, alternative explanations, and my take on Breuckmann’s study:

  1. Marathons are the antithesis of moderation.  They are an extremist activity.  As is running 35 miles a week.   Aerobic fitness will exhibit, like most things, an inverted U-shaped curve in relationship with mortality and quality of life.  IOW, a totally sedentary lifestyle is probably just as bad as running marathons, but running 1 mile a day or a few per week is probably beneficial.  A poor diet and sedentary lifestyle may be associated with obesity, atherosclerosis, thrombosis, whereas marathons are more like a cardiovascular-beatdown.
  2. How does marathon running kill?  Perhaps the overall stress of marathons or blood flow-induced shear stress damages the endothelial lining of vessels, which may contribute to an atherosclerotic or otherwise pathological process.  This would be exacerbated by the systemic inflammatory response associated with a prolonged high level of exertion.
  3. Then again maybe it’s all about diet:  running 35 miles per week requires a LOT of extra calories; there is bound to be some processed crap in there.  (sorry, my assumption here is that a healthy person might be able to eat a healthy 2,000 kcal diet, but if they were suddenly eating 4,000 kcal it probably wouldn’t be all the same foods as before just twice as much).  So maybe it’s the excessive caloric burden in general, or perhaps the added foods that are contributing to the problem.
  4. On the other hand, maybe they were juiced up!  I wouldn’t be surprised if running a marathon at 57 years of age required a little pharmaceutical-grade ergogenic enhancement.
  5. Last but not least, maybe their age-matched control population was not the best control group.  IOW, maybe the controls were very healthy, so anyone (including a marathoner) would appear less healthy than control.  That’s a good one.
  6. The opposite of #5.  Maybe the marathoner’s were a particularly unhealthy bunch (they were big smoker’s and drinker’s for most of their life, then gave it all up and started running… a lot of permanent damage was done prior to exercise training).


Fortunately for us, more data on these subjects were published a year earlier.

Running: the risk of coronary events : Prevalence and prognostic relevance of coronary atherosclerosis in marathon runners. (Möhlenkamp et al, 2008 European Heart Journal)

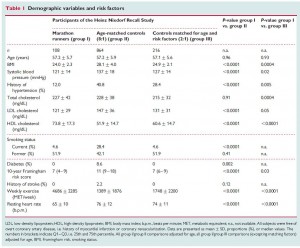
The marathoners are group I.  Group II is an age-matched control group and group III is a control group that was matched for other risk factors including BMI, lipid profile, and smoker status.  As a side note, this type of control population is far better than statistically adjusting for risk factors.  When data are statistically adjusted, you are no longer comparing people, per se, but rather are comparing a person to a mathematically derived variable (or something like that).  IOW, I really like Möhlenkamp’s choices for the control populations.

The most interesting numbers IMO:

Indeed marathoners had 42% higher HDL and 18% lower LDL than age-matched controls (like the controls from Breuckmann’s study).  This suggests lipid profile is a poor indicator of LGE.  And there were more smokers in the age-matched control group.  This basically strikes down my alternative explanation #5 above; the controls were not a healthier group of people.

Coronary artery calfification scores:

From these data (look at the middle of the three numbers in each column), it looks like although marathoners were more likely to exhibit LGE, they had a similar degree of coronary artery calcification compared age-matched controls.  Furthermore, marathoners had significantly more coronary artery calcification than the controls that were matched for other risk factors, which more implies marathon running per se increases coronary artery calcification.

Furthermore, given the increased cardiac events in marathoners compared to age-matched controls (Breuckmann’s study), these results suggest that LGE is a more powerful indicator of risk than increased coronary artery calcification.

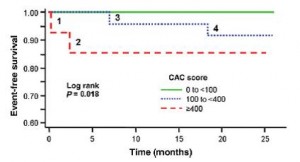
Coronary artery calcification is not a bad indicator, however:

The green line indicates event-free survival in runners with the least coronary artery calcification (they experienced zero cardiac events).  The blue dotted line is runners with intermediate coronary artery calcification, and the red dashed line is runners with the most coronary artery calcification.  This graph basically shows that the extent of coronary artery calcification is a pretty good predictor of cardiac events.


Interestingly, coronary artery calcification was not associated with years of running, miles per week, or number of marathons.  This is odd because coronary artery calcification was much worse in marathoners compared to risk-factor matched controls.   And number of marathons was significantly associated with LGE.  Does this mean that simply being a marathoner worsens coronary artery calcification, and the more you run worsens LGE?  I don’t know enough about these measurements to speculate on their pathological relationship, but in general, they are both pointing in the same direction.

But what about cardiac events in the risk-factor matched controls?  “data not shown”


More conclusions/alternative explanations:  going back to point #5 (above) regarding the possibility of an extra-healthy control group (which was subsequently de-bunked by comparing their lipid profiles and smoking history), it is also possible that this was a particularly unhealthy group of marathon runners (back to explanation #6) …  There were a LOT of former smokers; maybe it is people who started caring about their health, so they quit smoking and started running.  This could also possibly explain why coronary artery calcification was associated with marathons but not weekly running distance, number of marathons, etc.  IOW, former poor diet or lifestyle habits caused the coronary artery calcification and caused these subjects to start running (a bona fide confounding factor).  This may be supported by considering how these studies recruit their subjects.  Which marathoner is more likely to enter into this study, which entailed a labor-intensive comprehensive battery of cardiovascular and blood tests?  The recreational runner who has been healthy their whole life, to whom running is simply a hobby; or the runner who gave up their former poor diet and lifestyle to begin a health crusade and is now totally obsessed.  I think the latter has more motivation to sign-up.

But none of that explains the correlation with all measures of the marathoner (miles ran per week, number of marathons, etc) and LGE.  The LGE data suggest that marathons (training for and running in) are pathologically related to heart function.  And we still can’t rule out a role for diet!  Marathon training/running burns a LOT of calories.  Maybe it’s something their eating?  No food intake data were collected or reported in either study (but we know that unless these guys were losing weight, their food intake increased to match their expenditure; we just don’t know what they were eating).

Alternatively, maybe it’s not what they ate, but simply that they were eating so much more… the “rate of living” theory said that increased energy expenditure causes aging, disease, and death via free radicals.  Thus, caloric restriction, in which both food intake and metabolic rate are markedly reduced, improves longevity.

“Keep a quiet heart, sit like a tortoise, walk sprightly like a pigeon, and sleep like a dog.”  -Li Ching-Yuen (1677-1933)


Calories proper


Fat cats or trans fat blog, take II

Fat cats
or
Trans fat blog, take II

Protein intake during weight loss influences the energy required for weight loss and maintenance in cats. (Vasconcellos et al., 2009 Journal of Nutrition)

I am flabbergasted at how this study played out.  Regardless of whether the eloquence was intentional or not; a wonderful demonstrate that “all calories are not created equal.”

Study design: They started with obese cats and fed them one of two weight loss diets.  The goal was to lose 20% of their body weight at a rate of 1% per day.  Therefore, they were given more or less calories to meet that goal.  The rate of weight loss was controlled.

The high protein diet contained 33% more protein than control (21.4 g/mJ vs. 28.4 g/mJ).  To balance out calories, the control diet had more starch.

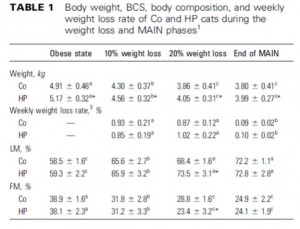
During the weight loss phase, both groups lost 20% of their initial body weight.  The high protein group lost almost 50% more fat than control!  Accordingly, the high protein group lost 64% less lean mass than control.  So only a 33% boost in protein during a hypocaloric diet caused drastic effects on body composition.

Body composition:

LM, lean mass; FM, fat mass.

The best part: remember, they were being fed on the basis of 1% weight loss per day.  The high protein group actually required 13% more food than control during the first half of their weight loss and 6% more during the second half.… in other words, if they were given the same amount of calories, the high protein group would have lost weight too quickly.  So the high protein group lost more fat and less muscle despite eating more!  Sounds like a pretty good deal, right?

Cats in the control group lost 1.65 grams of fat mass for every gram of lean mass lost.  Cats on the high protein diet lost 19.4 grams of fat for every gram of lean mass (over 10 times more).

Food intake data (ME = metabolizable energy, just think of it as calories):

It gets better.  Now all the cats are 20% reduced body weight.  Recall that muscle is the main driver of metabolic rate…

During the next phase of the study, the cats were fed enough to keep them weight stable for 4 months.  Because of their high protein diet, cats in that group finished the weight loss phase with more muscle and less fat than control.  During the maintenance phase, they were all fed the same diet, therefore any differences between groups during maintenance was due to the changes that occurred during weight loss (because diets are the same now).  Cats that lost weight via high protein diet required ~16% more calories per day to maintain their weight compared to cats that lost weight on the control diet.  So they got to eat more during weight loss, ended up with less fat mass, more muscle mass, and now have to eat more to maintain their new weight! (presumably because of their increased muscle mass).

This study was in cats, a carnivorous species, so there may have been a species-nutrient interaction; however, these findings while more robust are in agreement with what is seen in humans.  High protein dieters fare better in the short and long-term than low calorie dieters.

I think this study brilliantly illustrates that a calorie is not a calorie.  Dietary protein and carbohydrate may provide 4 kilocalories per gram when burned in a bomb calorimeter, but they are not equally fattening.

That’s about all for the coolness of energy balance in this cat study, but there is one other relevant topic with implications for human body composition.  Cats are carnivores and  experience a greater insulin response to protein than to carbohydrates…

Comparison of three commercially available prescription diet regimens on short-term post-prandial serum glucose and insulin concentrations in healthy cats. (Mori et al., 2009)

This study design was not nearly as eloquent as Vasconcellos’ (above).  They basically wanted to measure the insulin and glucose response to three different meals.  So it was a triple crossover (each cat tested each meal with a one week washout in between).  They were healthy cats.

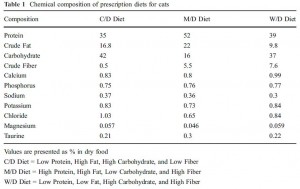
The meals were:

  1. (C/D) Low protein, high fat, high carbs, low fiber
  2. (M/D) High protein, high fat, low carbs, high fiber
  3. (W/D) Low protein, low fat, high carbs, high fiber

Diet 1 was a relatively standard control diet.  Diet 2 was Atkins-esque and is used to treat feline obesity and related disorders.  Diet 3 was another generic therapeutic diet.

Protein:  2 > 3 ? 1

Fat: 2 > 1 > 3

Carbs:  1 ? 3 > 2

C/D = diet 1 (control)

M/D = diet 2 (Atkins, usually in red)

W/D = diet 3

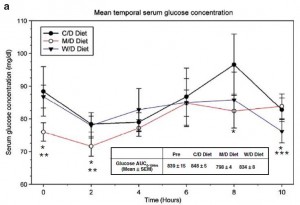
Glucose responses were relatively similar:

Diet 3 (W/D, inverted triangles) had modestly a greater glucose response, while diet 2 (M/D, Atkins diet, open circles) had the lowest.  This isn’t entirely surprising because diet 2 had the least carbs, while diet 1 had the most.

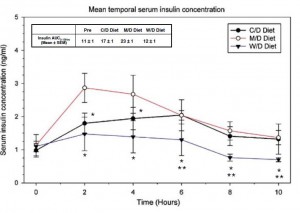
Here’s the interesting part:

Diet 2 (M/D, Atkins, open circles) had the largest insulin response despite the least carbs!   Diets 1 (C/D) & 3 (W/D) had the most carbs, but Diet 2 (M/D, Atkins, open circles) had the most protein.


This is almost exactly in line with what was seen in Vasconcellos’ study (above):

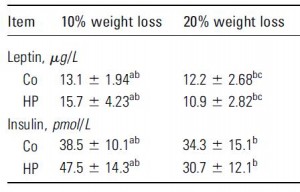
The average insulin levels over the entire weight loss period was 36.5 pM in the control group and 39.1 pM in the high protein group.

These studies were performed in cats, who evolutionarily and genetically differ markedly from humans.  Their status as true carnivores makes it difficult to extrapolate the results to humans.  But there is a large group of scientists, journalists, and bloggers, etc. who implicate insulin per se as the cause of obesity.  In cats, a high carbohydrate diet (standard store-bought dry food) causes obesity, and a high protein diet is an effective treatment.  Furthermore, a high protein diet causes just as favorable changes in body composition in cats as it does in humans.  But the high protein diet is markedly more insulinogenic in cats.  There are a few possible alternatives explanation of which I can think.

1-It might be the carbohydrates and not necessarily the insulin… that possibility agrees with the observations in both species… in humans, we know that a carb-rich diet is associated with obesity and we think it is due to insulin’s role in fat storage… in cats, we know that a carb-rich diet is associated with obesity but as seen in these two studies, it is probably not due to insulin.

2-Alternatively, maybe insulin is obesogenic only when accompanied by high carbs.  That would explain why insulin is obesogenic in humans (whose high insulin levels are associated with a high carb diet) but not cats (whose high insulin levels are associated with a high protein diet)… but this wouldn’t explain why type I diabetics are usually thin but get fat deposits around their insulin injection sites (which suggests that insulin directly promotes fat storage and doesn’t need carbs).  However, type I diabetics are frequently hyperphagic, so maybe the high carbs are present.

Aargh, a clear conclusion can’t be drawn to tie together all of the observations, but option 2 comes close.  N.B. I personally believe other dietary factors like processed foods, industrially produced trans fats, high fructose corn syrup, and grains probably have a big role in insulin resistance, which is associated with obesity, but I’d still like to see a clean cut demonstration of this across all species, or at least mammals, or at least in primates.


Calories proper


OK, so maybe protein is just as insulinogenic as carbs in humans too:

A high-protein diet induces sustained reductions in appetite, ad libitum caloric intake, and body weight despite compensatory changes in diurnal plasma leptin and ghrelin concentrations (Weigle et al., 2005 AJCN)

open squares, controls; closed circles, isocaloric high protein, open triangles, ad lib high protein


One more wrench in the gears!

This last one is a total doozy.  I feel double-crossed.  never saw it coming.  To the best of my knowledge, industrial trans fats have never failed to maim those who ingest them.  until now.


Effect of trans-fat, fructose and monosodium glutamate feeding on feline weight gain, adiposity, insulin sensitivity, adipokine and lipid profile. (Collison et al., 2011 British Journal of Nutrition)

This study was “different;” they fed pregnant/lactating cats one of four diets and then weaned the kittens onto the same diet as their mother.  In brief, the diets were:

Control: standard low fat diet

A) Control + MSG (~200mg/kg)

B) High trans fat & fructose

C) High trans fat & fructose + MSG


The diets are kind of sketchy, so here are some generalities: we can compare diet A to control and diet C to diet B to see the effects of MSG, and we can compare diet B to control and diet C to diet A to see the effects of high trans fat & fructose.

The whole story can be summed up in the following table (which has been heavily edited):

First, please note the red circle.  Body-fat increased 378.38% in control kitties and 576.50% in those fed MSG!!!  MSG is the devil for cats (?).  Interestingly, MSG had no effect on cats fed a high fructose and trans fat diet (302.59% vs. 277.32%)… (??) actually, all cats fed a high fructose & trans fat diet accumulated less fat mass than low fat fed cats.  (???)  This is in agreement with the findings above; cats become obese on a low fat high carb diet and remain lean and muscular on high fat high protein.  I’m surprised the fructose had no effect.  I’m also a little surprised that MSG was far worse than high fructose & trans fat.

Second, please note the arrows.  The red arrows show the effect of MSG on liver enzymes.  In both low fat and high fructose & trans fats, the addition of MSG markedly improved the liver enzyme ALT. The blue arrow shows that high fructose & trans fat is bad for the liver, in agreement with human and rodent data, but this is completely ameliorated by the addition of MSG [in cats] (????).

I have no idea how to interpret these findings from a biological standpoint, but I think it might have something to do with cats being true carnivores.  Cats need meat to live.  MSG is a meat-mimetic; that is, it tastes savory, better than meat, but does not provide any of the nutrients.  I don’t know how MSG would enhance fat gain but improve liver enzymes in cats on a low fat diet, but I think cats on a low fat diet is another problem because a carnivorous diet is not low fat.  And most troubling, trans fats aren’t bad for cats!  Maybe since cats generally eat a relatively high fat diet, the addition of a few grams of trans fats are well tolerated (because they comprise a small fraction of the total fat intake).  Trans fats were shown to be harmful in rodents & rhesus monkeys, two species who consume a low fat diet in their natural habitats.  Since humans are omnivores, does this mean that trans fats are worse for monkeys & rodents than they are for us?  IOW, does extrapolating the results from rodent studies to humans inevitably exaggerate the harm of trans fat?  Food for thought.


calories proper


April Fool’s day

Please forgive me in advance for the crass humor in this post.

Have obesity researchers given up?  Their most recent advice: shit your pants or eat shit.

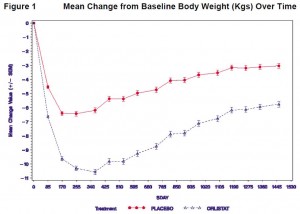
Exhibit A. The drug formerly known as Zenical and Orlistat, currently marketed OTC as Alli, is one the only medications FDA approved for the treatment of obesity.  The results from Orlistat’s weight loss trials are unequivocal (figure below).

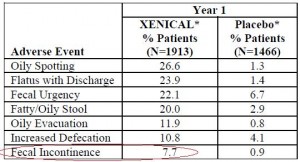
But the list of “Common Adverse Events” is horrendous.  “Common” means it happens in over 5% or 1 in 20 patients.  This was taken directly from the prescribing information.
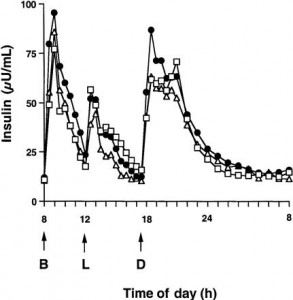
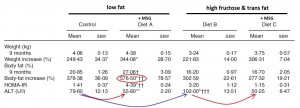
Exhibit B.

The gut microbiota consists of millions of organisms that reside in the intestines and they are intricately associated with the health of its host.  The microbiota differs markedly between obese and lean people.  In animal studies, transfer of an obese mouse’s microbiota to a lean mouse makes the latter gain fat mass, suggesting a causal relationship.  (if your interested, check it this and this)  Recently, however, scientists have taken it to the next level.  The complete abstract is below.  Fecal transplants (from lean healthy donors) have remarkable effects on glucose tolerance and insulin sensitivity.  I shit you not.

Metabolic effects of transplanting gut microbiota from lean donors to subjects with metabolic syndrome (Vrieze et al., 2010 EASD)

Recent data in animal models revealed that obesity is associated with substantial changes in composition and metabolic function of gut microbiota. Moreover, colonization of germ-free mice with faeces harvested from obese mice resulted in a significantly greater increase in total body fat than colonization with a ‘lean microbiota’. However, data on the role of gut microbiota in human obesity are scarce. Thus, our aim was to examine the effect of faecal infusions derived from lean healthy donors on gut microbiota composition, glucose and lipids in metabolic syndrome.  This study was a double-blind, randomised controlled trial. A total of 18 male subjects with newly diagnosed metabolic syndrome (BMI?30 kg/m2, FPG>5.6mmol/L, TG>1,6 mmol/L with no medication use) underwent jejunum biopsies and subsequent polyethylene-glycol bowel lavage through duodenal tube followed by random assignment to either allogenic (from lean male donors with BMI<23 kg/m2, n=9) or autologous faecal transplantation (reinfusion of own collected faeces, n=9). We studied changes in sigmoidal microbiota composition and fasting lipid profiles at 0.5, 2, 6 and 12 weeks after faecal transplantation. Weight, jejunal gut microbiota (epithelial biopsy) and glucose metabolism (peripheral and hepatic insulin sensitivity as assessed by hyperinsulinemic euglycemic clamp with stable isotopes) were studied before and 6 weeks after transplantation.  Lean subjects were characterized by different sigmoidal gut microbiota compared to obese subjects (by HITChip phylogenetic microarray analysis). Fasting levels of TG-rich lipoproteins (TG/ApoB ratio) were significantly reduced following donor faeces (1.43 ± 0.21 to 1.11 ± 0.18, p<0.01) with no effect after autologous faeces infusion. Resting energy expenditure and basal endogenous glucose production (EGP) did not change in both groups after faecal infusion. Although weight remained stable, an improvement in both peripheral (Rd) and hepatic insulin sensitivity (suppression of EGP) was found 6 weeks after allogenic faeces (median Rd: from 26.2 to 45.3 ?mol/kg.min, p=0.02 and EGP suppression: from 51.5 to 61.6 %, p=0.08) while no significant changes were observed in the autologous treatment group (Rd: from 21.0 to 19.5 ?mol/kg.min and EGP suppression: from 53.8 to 52.4 %, ns). Changes in jejunal microbiota are currently analyzed. Lean donor faecal infusion improves hepatic and peripheral insulin resistance as well as fasting lipid levels in obese individuals with the metabolic syndrome underscoring the potential role of gut microbiota in the disturbances of glucose and lipid metabolism in obesity. Our data could provide pathophysiological insight in the metabolic deviations in obese subjects and a rationale for therapeutic intervention.


For the record, those changes in insulin sensitivity are fairly robust, especially compared to control.  And perhaps the title of this post was too crude; the fecal transplants were administered through a nasogastric tube that goes in through the recipient’s nose and down their throat, so they’re not technically “eating” it.  By the way, those infusions consisted of 300mL (1 ½ cups) infused slowly over the course of an hour, every day for 9 days.  The environment within: how gut microbiota may influence metabolism and body composition (Vrieze et al., 2010 Diabetologia).


calories proper