BMI: everything you wanted to know but were afraid to ask
or
More than your friends know about the BMI
BMI, or “body mass index,” is an index of adiposity and is calculated as body weight divided by height-squared (kg/m2).
BMI is usually divided into 4 categories: underweight, healthy weight, overweight, and obese. These categories have specific meanings and there is a physiological rationale for culture-specific cutoff points. In the United States, healthy weight is classified as BMI 20-25 and obesity is BMI > 30.
N.B. The rationale for setting the obesity cutoff at 30 and not 28 or 32 is that Americans with BMI < 30 experience fewer health problems, e.g., lower rates of diabetes, than those > 30. It is NOT the average, nor does it have anything to do with odd biological phenomena like adipocyte cell number or maximal obesity capacity. The cutoff for Chinese is ~25 because > 25 is associated with significantly more health problems than < 25. The cutoff for Chinese (25) is not lower than Americans (30) because Chinese are on average leaner. Chinese ARE leaner, but that’s not why the cutoff is lower. The cutoff is lower because it is based on disease risk, not average body weight.
This is complicated. Trust me.
Example #1. An American living in the United States with BMI 27.5 is classified as overweight, but a Chinese with BMI 27.5 is classified obese. These terms have more to do with disease risk than body weight.
Example #2. On average, Americans are fatter than Chinese. But Chinese have higher rates of diabetes. Chinese get diabetes at a lower BMI, on average, than Americans. THIS is why the obese BMI has a lower cutoff for Chinese. Pound for pound, Chinese are more diabetic than Americans and studies like Ni-Hon-San suggest this is not genetic, but rather environmental or dietary.
BMI 101, Americans are good at getting fat without diabetes. And they’re really good at getting fat, but that’s got nothing to do with BMI category cutoffs.
Deriving ethnic-specific BMI cutoff points for assessing diabetes risk (Chiu et al., 2011 Diabetes Care)
Divide and conquer
No study more robustly exhibits the gravitas of BMI categories. From this relatively random sample, whites and blacks arethe heaviest, followed by South Asians (Indian, Pakistani, etc.), and then Chinese, who are the leanest.
Table 1.
If the obesity cutoff is universally set at 30, then 16.5% of whites, 14.7% of blacks, and 6.9% of South Asians, and a paltry 2.2% of Chinese are “obese.” And THIS is why the obesity cutoffs are not universal.
Table 2. Incidence of diabetes (per 1,000 person-years)
The first row in Table 2 shows the incidence of diabetes among those at a healthy body weight. It is fairly low, in all except for those hailing from the diabetes capital of the world, India, whose unlucky population experiences 3x more diabetes than whites (cough cough diet cough). But now focus on the first column, diabetes incidence in whites with a healthy body weight (4.1) vs. overweight (10.0) vs. obese (25.6). There is a clear increase across the groups which confirms the usefulness of these specific BMI cutoff points for this population.
But what happens when these cutoffs are applied to Chinese (Table 2, third column)? Holy crap, 79.6% of Chinese with BMI 30 have diabetes!! Actually, overweight Chinese are almost as diabetic as obese whites (despite being ~25 pounds lighter). But while this clearly shows a BMI-independent predisposition toward diabetes among Chinese (cough cough diet cough; as blogged about previously), it also demonstrates the futility of universal BMI cutoff points. Since the cutoffs are based on health risks, to say someone is obese should be associated with a specific risk. If the cutoff was universally at BMI 30, then we could conclude nothing meaningful about the incidence of diabetes in obesity since the range would be enormous (25.6 – 79.6). In other words, the word “obese” would be rendered useless by universal BMI cutoff points.
Table 3. Incidence of diabetes (per 1,000 person-years)
Lowering the obese cutoff to 27.5 for Chinese levels the playing field. 30.9% of Chinese with BMI > 27.5 have diabetes, which is roughly equivalent to the 25.6% of whites with BMI > 30. Now we can clearly say “obesity” is associated with increased risk for diabetes, and this risk is increased equally in an ethnic-dependent manner. By normalizing to disease burden, BMI categories have significantly more clinical value.
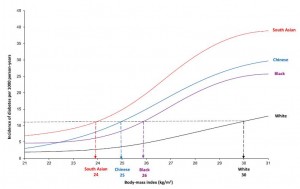
Clearest depiction of this concept:
To most accurately normalize BMI categories, one could ask at which BMI certain ethnic groups experience the same diabetes incidence as obese whites, for example. By graphing the data in this manner, it is clear that Indians, Chinese, and blacks aren’t very good at getting fat. Just a few extra pounds and here comes the diabetes. At least for Chinese, it’s a good thing they tend to stay lean (Table 1).
And this isn’t restricted to diabetes…
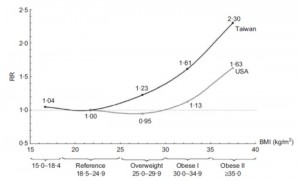
Are Asians at greater mortality risks for being overweight than Caucasians? Redefining obesity for Asians (Wen et al., 2008 Public Health Nutrition)
The relative risk for all-cause mortality increases with body weight. As per the figure above, e.g., a 225-pound American has the same relative risk for all-cause mortality as a 200-pound Chinese. Alternatively, a Chinese with BMI 25 has the same relative risk for all-cause mortality as an American with BMI 30. Thus, ethnic specificity is mandatory to establish clinical meaningfulness to the word “obesity.”
calories proper


