it appears that the time for the indirect pathway for glycogen synthesis may finally be here. Or perhaps it is insulin’s peripheral anti-gluconeogenic actions.
this topic deserves at least 1 lecture in a graduate level nutrition course: Glucagon receptor KO prevents type I diabetes in mice
Background information
When blood glucose is high after a meal, it is cleared by three tissues.
1) Liver
2) Muscle (insulin-dependent)
3) Adipose (insulin-dependent)
Insulin stimulates glucose clearance but also suppresses glucagon. b-cells surround the capillaries within pancreatic islets; blood flows through the b-cells first than through the a-cells. So if glucose is high, it triggers insulin release from the b-cells, which then bathes the a-cells and inhibits glucagon.
Glucagon is a counter-regulatory hormone, i.e., it acts to increase blood glucose. If you asked me before reading this paper, I would have said glucagon is important in fasting; necessary to maintain blood glucose at a level compatible with brain glucose uptake. How? By stimulating hepatic glucose production (glycogenolysis and gluconeogenesis). That’s all. After a carbohydrate containing meal, there’s less need for hepatic glucose production (HGP), so insulin inhibits glucagon. After a high protein meal, maybe you still get a little bit of glucagon to help with excess amino acids. End of story.
Divide and conquer.
There were four important groups of mice:
1) Wild-type (normal, “WT”)
2) Type I diabetic (no insulin, “STZ”)
3) Glucagon receptor KO (no glucagon activity, “Gcgr-/-”)
4) STZ Gcgr-/- (no insulin or glucagon activity)
STZ (streptozotocin): b-cell toxin, mimics type I diabetes (no insulin), Ketoacidosis, weight loss despite hyperphagia (2-fold increase in food intake!), Decreased fat mass (due to lack of insulin)
Gcgr-/-: Decreased blood glucose levels as expected, Improved glucose tolerance (somewhat expected), Ultra-high glucagon levels but confirmed no glucagon activity
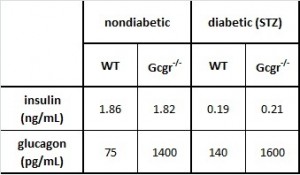
Table 1. The basics.
- Insulin levels are practically nil in all STZ-treated mice
- As expected, glucagon is increased in STZ-treated mice, because insulin usually suppresses glucagon
- Glucagon levels are astronomical in Gcgr-/-
we know from previous studies that Gcgr-/- have lower fasting glucose & better glucose tolerance (Gelling et al., 2003 PNAS)
Back to the data. Rodent adipose tissue physiology 101:
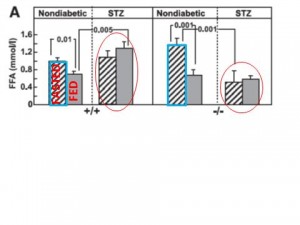
Fasting & Fed Free Fatty Acids
1st panel: normal WT mice. Feeding increases insulin which suppresses lipolysis, thus FFA levels go down.
2nd panel: STZ (type I diabetic). No insulin, so no change in FFA levels after feeding.
3rd panel: Gcgr-/-.
1) Higher fasting FFA compared to WT mice? (compare the two blue outlined boxes); 2) Feeding increases insulin which suppresses lipolysis, thus FFAs drop; 3) Greater relative suppression of FFA (due to higher basal FFA) suggesting increased adipose tissue insulin sensitivity?
4th panel: STZ Gcgr-/-
1) Reduced fasting FFA compared to WT STZ, suggests a lipolytic role for glucagon, but why is this restricted to STZ mice? 2) No effect of feeding on FFAs because no insulin (just like in WT mice)
A lipolytic role for glucagon is confirmed by comparing the bars circled in red.
Compare the fasted to fed columns in each panel: all four panels are in accord with what we know about the anti-lipolytic effects of insulin.
Not sure why fasting FFAs are lower in STZ Gcgr-/- compared to nondiabetic Gcgr-/-. Any ideas?
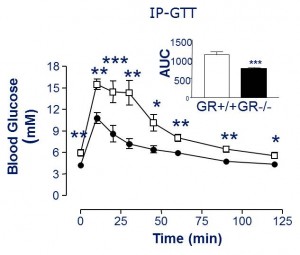
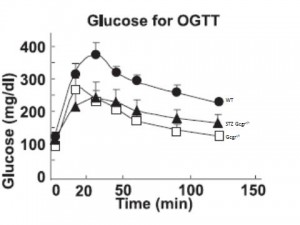
Oral glucose tolerance is improved in Gcgr-/- (compare WT [closed circles] to Gcgr-/- [open squares]), and insulin response is identical (not shown).
Glucose tolerance is improved in STZ Gcgr-/- mice. (compare STZ Gcgr-/- [closed triangles] to Gcgr-/-[open squares]). But STZ mice have no insulin!
This suggests that glucagon causes postprandial hyperglycemia and the primary role for insulin is to suppress glucagon (as opposed to facilitate glucose uptake in muscle, for example). In other words, without glucagon driving up hepatic glucose production (HGP), there won’t be high postprandial glucose, and therefore it doesn’t matter if insulin is present.
Where does the dietary glucose go? Probably not so much into muscle because there’s no insulin (there is still controversy, but there is evidence that insulin signaling in muscle is important for glucose tolerance; see MIRKO mice , although this isn’t entirely clear).
Liver glycogen? glucagon actively inhibits hepatic glucose uptake and stimulates HGP (?)
So, to recap: 1) In the absence of glucagon, oral glucose tolerance is normal because there is no great stimulus for HGP; insulin is dispensable. 2) Point #1 is supported because without insulin, oral glucose tolerance is normal as long as there is no great push on HGP (i.e., STZ Gcgr-/-). 3) If glucagon is present, then insulin decreases glycemia by inhibiting glucagon which reduces HGP. If glucagon is absent, then insulin is not necessary because the liver takes up more of the dietary glucose. Clear as an unmuddied lake.
STZ Gcgr-/- Probably lower gluconeogenesis compared to STZ wild-type because: lower ketones compared to STZ wild-type, and lower fasting glucose compared to STZ wild-type. Lower fasting FFAs compared to STZ wild-type, confirming lipolytic effect of glucagon.
Gcgr-/- Elevated fasting FFAs compared to WT, suggesting lipolytic effect of glucagon is restricted to STZ-treated mice. Reason unknown, any ideas?
OK, like John Dewey now, in the normal situation: dietary glucose is absorbed but glucagon inhibits it from entering the liver at first, so the dietary glucose adds to the glucose produced via gluconeogenesis/ glycogenolysis causing a high peak in blood glucose. Insulin inhibits glucagon lowering HGP and blood glucose comes down (role for insulin signaling in muscle?). Without glucagon: dietary glucose absorbed and is mainly incorporated into liver glycogen; some gets by but HGP is lower, so the total glucose peak is blunted. Insulin is unimportant in this model, which is why glucose tolerance is the same in Gcgr-/- and STZ Gcgr-/- mice.
So insulin makes you fat and glucagon makes you hyperglycemic (blind, renal failure, neuropathy). ‘damned endocrine pancreas.
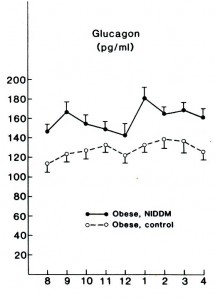
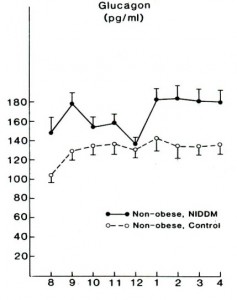
Flashback 1987 – Glucagon levels elevated in lean and obese type II diabetics; maybe this is why they are hyperglycemic? Less to do with skeletal muscle insulin resistance, more to do with glucagon & HGP? Reaven et al., 1987 Journal of Clinical Endocrinology and Metabolism
Flashforward 1999 – The almost exact same study was done 10 years ago in humans (Shah et al., 1999 AJP) “Impact of lack of suppression of glucagon on glucose tolerance in humans.” The authors insisted on using the double negative, which is annoying, so instead of saying “lack of suppression of glucagon,” I refer to this condition as “high glucagon.”
Divide and conquer.
No time for background: 10 healthy patients. Endogenous insulin and glucagon were inhibited by infusion of somatostatin. At time zero, glucose infusion begins at a rate designed to mimic a 50 gram oral bolus. Then they infused either a high dose of insulin to mimic the “nondiabetic” response, or a low dose of insulin to mimic the “diabetic” response. In each of these conditions, glucagon was either co-infused the entire time (“high glucagon”) or delayed for 2 hours (“suppressed glucagon”).
So the 4 groups were: High insulin & low glucagon, High insulin & high glucagon, Low insulin & low glucagon, and Low insulin & high glucagon (diabetic).
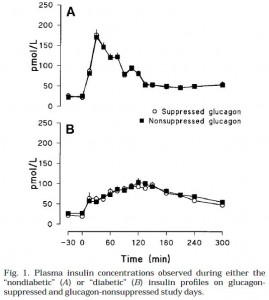
Insulin infusions looked like this (Fig 1):
Top graph is nondiabetic, note the high insulin peak. Bottom graph is diabetic.
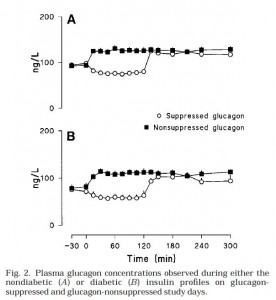
Glucagon infusions were pretty much identical for nondiabetic & diabetic conditions (Fig 2):
Top graph is nondiabetic, bottom graph is diabetic. NOTE: Figures 1 and 2 simply reflect the experimentally produced conditions (that is, the infusions), they are not a physiological effect. Secretion of endogenous insulin and glucagon was inhibited by somatostatin so the only insulin and glucagon in the blood is what the researchers put there.
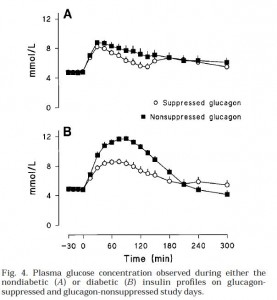
Then they gave ‘em glucose (Fig 4). Please just focus on the top graph first. Here’s what the glucose levels looked like in nondiabetic conditions. In other words, high insulin [similar to nondiabetic WT (open circles) & Gcgr-/- (closed squares) above]:
Both Gcgr-/- mice and humans with suppressed glucagon have normal or improved glucose tolerance when insulin is present in nondiabetic doses (top graph). Now look at the bottom graph; it is what happens in diabetic conditions (just like STZ-treated Gcgr-/- [open circles]; STZ-treated WT mice [closed squares])
We don’t have the data for STZ-treated WT mice, but most assuredly there is higher glucose levels, similar to what is seen in Fig 4B (low insulin, high glucagon [closed squares]). So glucagon is not bad if insulin is there to defend you (Fig 4A). Without adequate insulin (Fig 4B), high glucagon causes hyperglycemia.
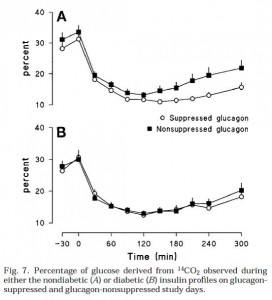
This was shown to be primarily due to differences hepatic glucose production (Fig 6):
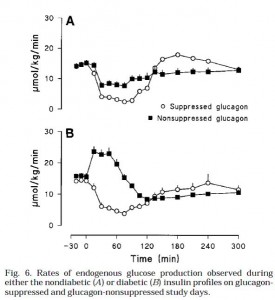 This is an important graph. Top graph (Fig 6A): (nondiabetic) high insulin suppresses HGP.
Bottom graph (Fib 6B): (diabetic) insulin is not necessary to repress HGP when glucagon is low (open circles). But if glucagon levels are high and there is low insulin, HGP is high, causing the hyperglycemia seen in Fig 4B. Interestingly, with low glucagon (open circles), HGP is suppressed to a similar level by high (top graph) or low (bottom graph) insulin (~5umol/kg/min). High glucagon is sufficient to cause hyperglycemia. Is it essential? So high glucagon is why type II diabetics have postprandial hyperglycemia? (this seems to downplay the role of skeletal muscle insulin resistance [?])
Furthermore, high glucagon (closed squares) impaired insulin’s ability to suppress HGP (compare, in both the top and bottom graphs; HGP is higher with the closed squares (high glucagon) than with the open circles (low glucagon). This means that insulin inhibits HGP by inhibiting glucagon; it takes really high insulin to counter the effects of high glucagon (with high glucagon [closed squares] HGP could only be suppressed by high insulin [Fig 6A closed squares are suppressed; Fig 6B closed squares are not suppressed) …. Suppressing glucagon in the diabetic insulin milieu (open circles, bottom graph) was sufficient to restore glycemia down to the same levels as nondiabetics (Figure 4 [open circles], glucose peaks at 8mM in both conditions)… so is that why insulin inhibits glucagon? Or is it how insulin suppresses HGP? Does it matter?
I think it might, there may be fundamentally important difference. If it’s how insulin inhibits HGP, then that excludes the possibility that insulin reduces HGP by decreasing amino acid and glycerol release from muscle and adipose, respectively. It means that insulin acts on the liver, not peripheral tissues, to repress HGP (assuming that in humans, the liver is the major physiological target of glucagon).
But alas! It looks like we won’t be needing to grapple with such questions today. The researchers found that gluconeogenesis was nearly equally suppressed in all conditions suggesting that the major contributor to glucagon-induced glycemia was glycogenolysis (in this model).
The poor, underestimated glucagon
Calories, proper

