Monthly Archives: June 2011

attention nutrition researchers

how not to do a diet study.

As previously blogged about here, pair-feeding is an interesting phenomenon.

A high oxidised frying oil content diet is less adipogenic, but induces glucose intolerance in rodents. (Chao et al., 2007 British Journal of Nutrition)

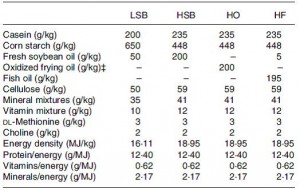
Basically, these researchers wanted to test the effects on body weight and glucose tolerance of soybean oil that was used for deep frying, like for French fries.  WRT diet and food intake, the study was well designed.  There were four diets:
Divide and conquer

The “L” stands for “low,” as in Low SoyBean oil diet; this was the low fat control group.  The “H” stands for “high,” as in High SoyBean oil, High Oxidised oil, and High Fish oil.  Apparently, High Oxidised oil is not as delicious in rat chow as it is in French fries, so the rats fed HO ate considerably less.  But if the rats on HO ate less food, they would gain less weight and might exhibit improved glucose sensitivity compared to the other groups simply because of calorie restriction.  This would be a problematic confounding factor

Enter: pair-feeding.   In pair-feeding, the amount of HO ingested is regularly measured and an equivalent amount of calories are disbursed to the other groups, so that all groups are eating the same amount of calories.  Essentially, this controls for food intake so the effects of the diet can be tested directly, e.g., without being confounded by food intake.

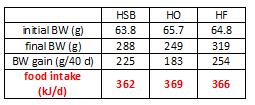
As seen below, the pair-feeding regimen was successful:

The row outlined in red shows food intake.  Note: it is very similar in all four groups; this was due to pair-feeding.


For the purpose of clarity, and since I’m not concerned with what was actually being tested, here is a simplified table.


In red, the HO group ingested 369 kJ/d, so the HSB and HF groups were fed approximately 369 kJ/d.  However, look at the markedly different amounts of weight gained.  HO gained significantly less weight than HSB and HF despite eating the same amount.  Similarly, HSB gained less weight than HF despite similar food intake.  don’t jump down my throat just yet, there was no attempt to quantify energy expenditure in any group, but that doesn’t take away from my point.  Taken at face value, these data suggest a diet high in oxidized soybean oil hinders fat gain (regardless of the mechanism).

The researchers figured that if all the groups were fed ad libitum (could eat as much as they pleased), HO would gain less fat because they ate less (as opposed to a specific effect of the dietary fat composition, which was the question they wanted to address).  This was their justification for pair-feeding.

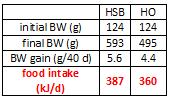
Since HO gained less fat despite pair-feeding, their first point was proven.  Therefore, the researchers discarded the difficult and labor-intensive pair-feeding for experiment #2.  As seen below, rats fed HO ad lib do indeed ingest less than HSB.  AND they gain less weight.


So my question is: did pair-fed HSB rats gain more fat than HO because of an anti-fattening effect of HO, or because of the stress imposed by being pair-fed???  Normally, ad libitum feeding occurs all throughout the night (lots of small meals).  When an animal is pair-fed, they are given the food all at once and they gorge because: 1) they are being under-fed (given less than for what they are hungry); and 2) they don’t know when will be their next meal.

So back to my question: for what exactly does pair-feeding control?  in the first experiment, calories were the same, but HO were ingesting oxidized oils while HSB had a stressful feeding regimen… there are two variables.  The results from experiment #2 show nothing but what we’d expect, i.e., eat less = gain less fat.  My point is simple: pair-feeding might control for one problem but it introduces another.  If there are any nutrition researchers reading, please consider this.

Their experiments therefore specifically do NOT address the question they asked.  Maybe it was good enough for the British Journal of Nutrition, but it tells us nothing definitive about “the adipogenic effect of high oxidized frying oil.”

For ways around this, and to learn how to design a much better experiment, I am happy to consult for a small fee 🙂     for some more free background information, read on:

The effect of feeding frequency on diurnal plasma free fatty acids and glucose levels. (Bortz et al., 1969 Metabolism)

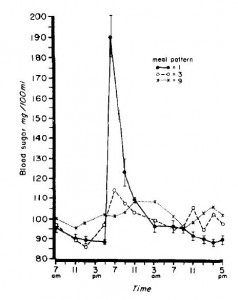
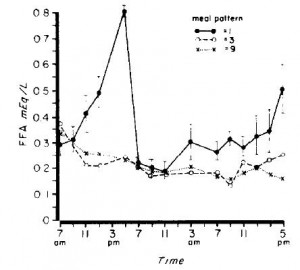
In this experiment, they fed young healthy men the following diet divided into one meal per day, 3 meals per day, or 9 meals per day.  Rodents feed all night long, so they would be most similar to the men being fed 9 times per day.  A pair-fed rodent, on the other hand, is fed only once and they eat everything in one sitting, just like the men in this study who were given all their calories at once.

The differences in blood glucose and free fatty acid responses to the meal were robust:


Hyoooge differences in serum glucose and free fatty acids.

So in addition to the stress-inducing nature of being pair-fed, there are also profound physiological differences in nutrient handling which most likely contribute to differential fuel partitioning.

For more examples of how a restricted feeding regimen can go terribly wrong, see here and here.

When you consider the possibility that the act of pair-feeding can have distinct metabolic effects, independent from whatever intervention is being administered, the results become increasingly difficult to decipher.

Effects of pair-feeding and growth hormone treatment on obese transgenic rats (Furuhata et al., 2002 European Journal of Endocrinology)

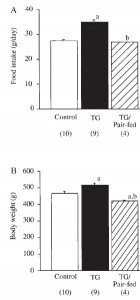
In brief, there were 3 groups: control, transgenic growth hormone-expressing mice (who eat considerably more than control mice, abbreviated “TG”), and transgenic growth hormone-expressing mice pair-fed with control.  As seen below, the pair-fed group ate (by design) and weighed just as much as control:


But when looking at the metabolic profiles of these mice, things get somewhat complicated:


Lets start out with the second row, FFA. OK, so TG mice eat more, weigh more, and have higher FFA than control (1.34 vs. 0.88 mM).  The elevated FFA could be caused by: 1) increased food intake; 2) increased body weight; or 3) the transgene.  To determine if it was caused by option #3, we look to the TG/pair-fed group.  If FFA are similar to TG, then it was caused by the transgene (option #3).  If FFA are similar to control then it was caused by options #1 or #2.  Alas, FFA in the TG/pair-fed group are similar to TG suggesting it is a specific of the transgene, independent of food intake body weight.

However, if we take a look at the first row, triglycerides, it is not so clear.  Again, we know that TG mice eat more, weigh more, and have higher triglycerides than control.  The elevated triglycerides could be caused by: 1) increased food intake; 2) increased body weight; or 3) the transgene.  To determine if it was caused by option #3, again we look to the TG/pair-fed group.  If triglycerides are similar to TG then it was caused by the transgene (option #3).  If triglycerides are similar to control, then it was caused by options #1 or #2.  But oh no!  Triglycerides in the TG/pair-fed group are significantly lower than TG and control!  This means we have to consider the fourth option: it was caused by pair-feeding.

The other two rows are easier to interpret, as insulin and leptin in the TG/pair-fed group exhibited an intermediate phenotype between control and TG, suggesting they were partially mediated by downstream effects of the transgene (i.e., increased food intake or body weight).  In the conclusion of the paper, the authors aptly explain the changes in insulin and leptin but cleverly avoid the triglycerides.  In their favor, the depressed triglycerides could have been an artefact, but the possibility that they were a product of the pair-feeding per se cannot be ruled out.  So depending on the question being addressed, pair-feeding has the potential to royally screw things up.


Calories proper


… if it ain’t broke …

“what to do with your cholesterol” or “it may not be a good idea to artificially manipulate your cholesterol levels (pharmaceutically or otherwise)”

Exhibit A: diet study, circa 1962.

A controlled clinical trial of a diet high in unsaturated fat – preliminary observations (Dayton et al., 1962 NEJM)

directly from the manuscript [sic]: “The control diet was a conventional food pattern containing 40 per cent fat calories, mostly of animal origin. The design of the experimental diet involved substitution of vegetable oils for about two thirds of the animal fat, total fat content being kept about 40 percent. An attempt was made to stabilize the iodine value of the control diet at 55 and that of the experimental diet at 100. Multiple vegetable oils were used, the choice depending more on pragmatic than on theoretical considerations. In order of decreasing quantity, corn, soybean, safflower and cottonseed oils were employed.”

basically, the experimental diet exchanged animal fat for vegetable fat (corn & soybean oil).  Iodine value reflects dietary fat unsaturation… vegetable fat has a higher iodine value because it has more unsaturated fats

A controlled clinical trial of a diet high in unsaturated fat in preventing complications of atherosclerosis (Dayton et al., 1969 Circulation)

[sic] “The control diet was similar to the regular institutional diet, which is a standard American diet. It provided, by analysis, 40.1% of calories as fat, having a mean iodine value of 53.5; cholesterol intake was 262 mg/1,000 calories (653 mg/day). The experimental diet provided 38.9% of calories as fat, with an iodine value of 102.4, and had a cholesterol content of 146 mg/1,000 calories (365 mg/day). Linoleic acid content of the two diets was 10% and 38% of total fatty acid, respectively.”

Clearly, the experimental diet successfully lowered serum cholesterol…  Total mortality was not significantly different, but:  “Deaths due to nonatherosclerotic causes numbered 71 in the control group and 85 in the experimental group.” keep those numbers in mind.


Exhibit B: an early cholesterol drug study, circa 1984

not for the faint-hearted.

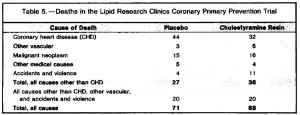
The Lipid Research Clinics Coronary Primary Prevention Trial (LRCC) is one of the first and biggest trials of a cholesterol lowering drug (cholestyramine) and mortality.  They collected a ton of data for both the placebo and treatment group, much of which is quite interesting.  The Lipid Research Clinics Coronary Primary Prevention Trial results. I. Reduction in incidence of coronary heart disease. (1984 JAMA)

It was a randomized, double-blind, placebo-controlled primary prevention trial of cholestyramine (24 g/d), lasting 7.4 years.  Roughly 3,800 healthy men aged 35-49 with LDL levels greater than 190 mg/dL.  This drug is used to treat high blood cholesterol.  P.S.  this study was done on people who were initially perfectly healthy (“primary prevention” trial).

Divide and conquer

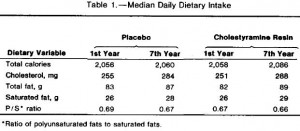
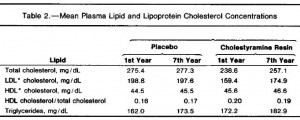
The placebo group: cholesterol intake increased from 255 to 284 mg/d.  But their plasma cholesterol decreased from 198.8 to 197.6 mg/dL.  LDL decreased from 198.8 to 197.6 mg/dL AND their HDL increased from 44.5 to 45.5 mg/dL.


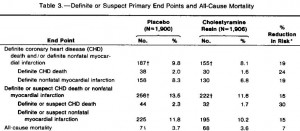
CHD mortality was reduced by 30% in the cholestyramine group but all-cause mortality only decreased by 7%.  Therefore some of the lives saved from CHD were lost to something else.  What else?


11 deaths from accidents and violence in the treatment group compared to 4 in placebo.  5 people were killed via homicide or suicide, compared to 2 in placebo.  6 people treated by cholestyramine died in car crashes compared to 2 in placebo.  Of all the people who died from accidents, half had high cholesterol.  That means that of the 8 people who died from car crashes, 4 had high cholesterol.  3 people on cholestyramine and 1 control died with high cholesterol of accidents.  4 people on cholestyramine killed themselves compared to 2 on placebo.

Did cholestyramine cause a 7% reduction in all-cause mortality because it lowered serum cholesterol levels?  Of the 8 people who died, 3 people on cholestyramine were drunk compared to 1 on placebo.

an alternative yet equally equivocal interpretation: when treated with cholestyramine, patients are twice as likely to kill themselves and 3 times as likely to die by drunk driving.

dramatic pause

Exhibit C: fibrates on trial, circa 1987

Helsinki Heart Study: primary-prevention trial with gemfibrozil in middle-aged men with dyslipidemia. Safety of treatment, changes in risk factors, and incidence of coronary heart disease. (Frick et al., 1987 NEJM)

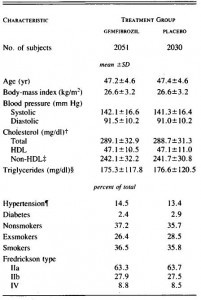
Randomized, double-blind, placebo-controlled primary prevention trial of gemfibrozil (600 mg BID), lasting 5 years.  Roughly 2,000 healthy men aged 40 – 55 with cholesterol levels greater than 200 mg/dL.  This drug is used to treat high cholesterol and lipids.  P.S.  this study was done on people who were initially perfectly healthy.


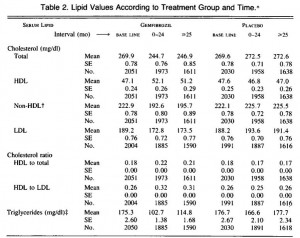
Here’s what gemfibrozil does to blood lipids:


Wham!  LDL and triacylglycerols go way down and HDL sky rockets.


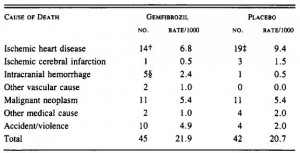
Indeed, gemfibrozil does to which it is supposed. … with some minor side effects: cancer rate: 15.1 in the treated group compared to 12.8 in placebo…  10% lower LDL and 18% more cancer.   Overall, gemfibrozil was associated with a 6% increase in mortality:


Patients taking gemfibrozil were 2.5 times more likely to die of accidents or violence. That is strikingly similar to what was caused by a 20% reduction in LDL during cholestyramine treatment in the LRCC (above) and the 20% reduction in overall cholesterol levels when animal fat was exchanged with vegetable fat.

Exhibit D, et cetera:

The Pfizer drug Torcetrapib nearly doubles HDL but increased total mortality by 60%.

Addition of nicotinic acid to a statin raises HDL but also increased total mortality (trial halted by Abbott Labs).

Most of these studies were on “healthy” subjects.  Maybe high LDL is bad.  …  Maybe low HDL is bad.  …


don’t fuck with your cholesterol levels.


calories proper


Ketosis, III

Ketosis series, take III

Hepatic steatosis, inflammation, and ER stress in mice maintained long-term on a very low-carbohydrate ketogenic diet (Garbow et al., 2011 AJP)

This study is similar to the one discussed in Ketosis series # 2, (A high-fat, ketogenic diet induces a unique metabolic state in mice [Kennedy et al., 2007 AJP]), both were 12 weeks long and used identical ketogenic diet.  However, the high fat/Western diets and body composition of mice on the ketogenic diet are different.

Nitpicking 101:  I don’t understand why researchers can’t select proper diets for these so-called “diet studies.”

KD, ketogenic diet; WD, Western diet

The macronutrient ratios are all over the place, but the worst part is that there is no attempt to control for the types of fat, protein, and carbs.  For example, the fats in the ketogenic diet are primarily lard and butter, while those in the Western diet are tallow and shortening… so basically the ketogenic diet is MUFA and PUFA while the Western diet is SFA and trans fat!  What exactly are we trying to compare, the effects of different dietary fats?  sacrebleu!

Divide and conquer

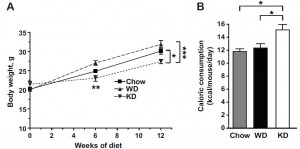
In accord with previous studies, mice on a ketogenic diet weigh less and eat more than those on chow or high fat diets.  Yada yada yada, just show this figure to the next person who promotes “eat less and move more” for weight loss.  (activity wasn’t measured in this study, but was here, which showed no change or even slightly reduced activity in mice on a ketogenic diet)


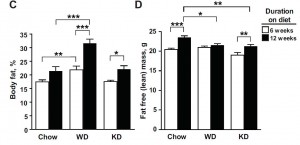
Divergences from Kennedy 2007: #1) body composition of KD mice in this study is identical chow;  lean mass in WD is less than chow and similar to KD.


WRT body fat, KD = chow < WD (HFD).  WRT lean mass, chow > WD = KD.

To refresh your memory, here are the data from Kennedy 2007:


The high fat diets are different, so a direct comparison is not possible.   But there is definitely a difference in how KD mice fared relative to chow, and the ketogenic diets were identical so a direct comparison is OK  (there were some other minor differences, like the age when the mice were started on the diet [6 wks vs. 8 wks]).  In Kennedy 2007, chow mice had the lowest body fat percentage, while in Garbow 2011 chow and KD are equivalent.  The differences are small, so it can slide (for now).  But FTR, since the ketogenic diets are identical, it would’ve been nice for Garbow to address some of these discrepancies in their discussion.

crackin’

From the body fat data above and food intake data below (which I extrapolated from diet composition and caloric intakes), it is clear that eating a lot of dietary fat won’t make you fat, even if it’s lard and butter.  KD mice ate 3x more fat than WD and almost 10x more than chow, but it didn’t cause them to get fat.  It’s only when sugar is added into the mix, as in the Western diet (40% carbs from sucrose & starch), when fat mass begins to accumulate.


Again, it’s surprising that KD mice ingested so much less protein yet maintained all of their muscle mass.  However the textbooks do say, explicitly, that nitrogen balance can be maintained when dietary protein is reduced if total caloric intake increases.  And that’s what happened (caloric intake increased), and maybe that explains the lean mass.  But it seems to me as if the increase in calorie intake (+20%?) was too much less than the reduction in protein intake (-75%) to completely account for the lean mass.  IOW, these data confirm that ketogenic diets are at least 50% magic.  I say that because the relationship between lean mass, protein, and calories is firmly adhered to by the other groups in this study.  I.e., chow mice ingested more protein than WD but the same amount of calories, and accordingly they had more muscle mass.

Moving on,

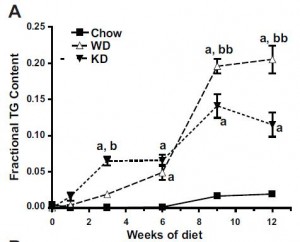
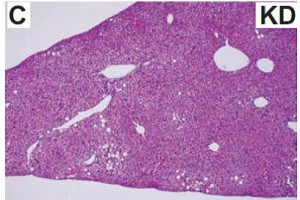
As expected, the ketogenic diet caused an increase in liver fat.  Not to worry, this is simply a product of the diet … KD = very low carbohydrate intake, so hepatic glycogen stores will be reduced; but the liver still needs energy and fat is in high abundance, so the liver accumulates fat instead.  It’s more physiological than pathological.


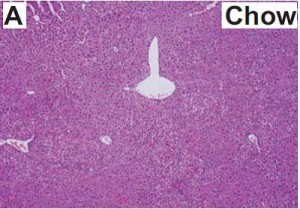
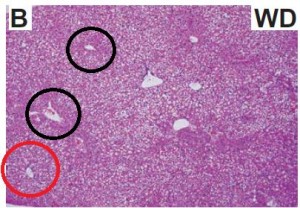
Normal liver:

Pathological fatty liver:

lots of fat around the portal vein (red circle), less fat around the central vein (black circles).

Physiological fat stores: sparse lipid droplets

From Kennedy 2007:


KD mice in both studies, and also in Jornayvaz et al. (2010 AJP), accumulated more fat in their livers than chow-fed mice, but the livers in Kennedy’s WD mice accumulated more fat than KD while the livers in Garbow’s HF mice accumulated less fat than KD …  and the high-fat diets were apparently similar in both groups:

Kennedy’s High fat diet (D12451)

Garbow’s Western diet (TD.96132)

Both diets were casein-based high fat diets, with carbs coming from sucrose and starch.  However, the fat source in D12451 is lard/soybean oil (7:1) while that in TD.96132 shortening/tallow (1:1).  Therefore, despite being fed a similar amount of fat, the WD mice in Garbow’s study were fed trans fat, which is surely worse for the liver than the lard that was fed to the HFD mice in Kennedy’s study.  This likely explains why the livers of Kennedy’s HFD mice were ~1.3x fattier than control while the livers of Garbow’s WD fed mice were ~10.3x fattier than control.

So, going back to the eternal complaint against most diet researchers: get a clue about what you’re feeding your mice or consult a nutritionist before wasting taxpayer’s money on bunk diet studies.

Alternatively, perhaps Kennedy was out to vilify the ketogenic diet.  If that were the case, then he would cunningly select a high-fat diet that produced a liver that was less fatty compared to the ketogenic diet.  This would certainly make the ketogenic diet appear worse than the horrid high-fat diet, which everyone already knows is bad :/

but that sounds like slander


calories proper