
I didn’t want to blog about the artificial sweetener study; to be honest, I didn’t even want to read it. I just wanted to report: 1) how many Diet Cokes are we talking about; and 2) when are you going to die.
Artificial sweeteners induce glucose intolerance by altering the gut microbiota (Suez et al., 2014)
Non-caloric artificial sweeteners (NAS) = saccharin, sucralose, and aspartame. Saccharin worked the best (worst) in the mouse study, so they tested it in humans. This was the part I found most relevant: seven healthy volunteers (5 men & 2 women, aged 28-36) who did not typically consume a lot of sweeteners were recruited and given 120 mg saccharin three times per day. 360 mg saccharin is ~10 packets of Sweet’n Low.
Exhibit A: 3/7 people tolerated it just fine; the other 4 not so much… or not? The study design, or rather data presentation, is cryptic. A glucose tolerance test was conducted every day of the experiment. They combined data from days 1-4 and days 5-7. This doesn’t make much sense: why not just use day 1 vs. 7? Artificially inflating statistical power..?
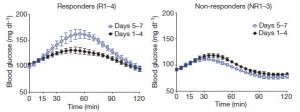
There was only 4 participants in the graph on the left. How could the data possibly be so tight? The “Days 1-4” line represents 16 data points (GTT from 4 people, each on days 1, 2, 3, & 4). Similarly, “Days 5-7” represents 12 data points. For the Non-responders, “Days 1-4” = 12 data points; “Days 5-7” = 9 data points.
…foul play? I guarantee the figures above would look MUCH sloppier, and probably lack statistical significance if we were just looking at Day 1 vs. Day 7.
Did something magical happen on day 5 that was fundamentally different from day 4? It appears so, at least for “Responder #3” :s
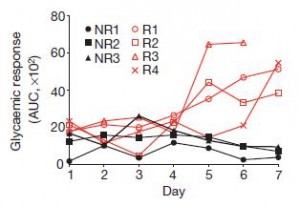
^^^those are individual data points… that degree of variability pretty much confirms the above speculation about the tight GTT data.
Conclusion of part 1: statistical wizardry produced a compelling GTT figure. Individual data points confirm statistical wizardry was performed (P<0.05).
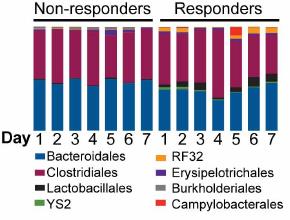
Exhibit B. Gut microbes shifted more in responders than non-responders. I think.
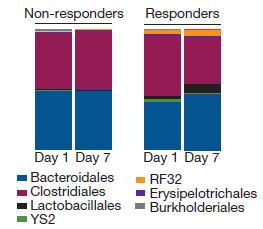
Fwiw, comparing Day 1 to Day 7 makes more sense.
Conclusion of part 2: I don’t know.
Exhibit C. Unfortunately, the most compelling data are from more animal studies. The human data don’t scare me.
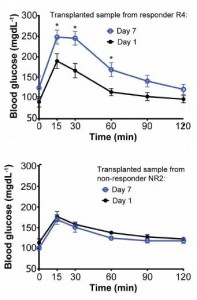
next logical step? Fecal transplants: smear human shit on mice, which for some reason I find more gross than smearing mouse shit on mice. But the data recapitulate the human study quite nicely:
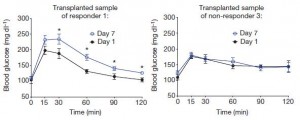
above: fecal transplant from a responder on day 7 (after a week of Sweet’n Low) causes insulin resistance relative to a fecal transplant from the same responder prior to Sweet’n Low. Compelling and consistent.
Some of the more marked changes in the microbiome were: huge increases in Bacteroides fragilis, Weissella cibaria, and Candidatus Arthromitus.
Bacteroides fragilis: associated with high protein diet; mixed findings on body weight.
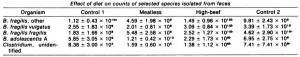
Weissella cibaria: associated with less stinky gas? Found in some fermented foods.
Candidatus Arthromitus: found in bugs guts (eg, cockroach, termite, etc.)… Arthromitus, arthropod.
My take on this study: diet!?
What differentiates a responder from a non-responder? Responders appeared to have a different microbial profile at the beginning of the study. And it appeared to change more than the non-responders, but I have to ask: 1) really? bc hard to tell from the figures; 2) if so, did it change because “responders” responded to the sweeteners by changing their diet? Was it different in the beginning because of different baseline diet? In a study with only 7 participants, this information could’ve & should’ve been comprehensibly assessed, reported, and discussed.
And grouping days 1-4 and 5-7 seems weird or misleading at best, nefarious at worst.
Mixed findings in PubMed:
Sucrose versus saccharin as an added sweetener in non-insulin-depedent diabetes: short- and medium-term metabolic effects (Cooper et al., 1988)
“No significant treatment effects were observed on fasting concentrations of blood glucose, plasma insulin or serum triglycerides, or on urinary excretion of glucose, sodium or potassium. Following a standard breakfast with either sucrose or saccharin and starch, no differences between meal responses were observed.”
Drinking saccharin increases food intake and preference (Tordoff and Friedman, 1989)
Antihyperglycaemic effect of saccharin in diabetic ob/ob mice (Bailey et al., 1997)
Influence of artificial sweetener on human blood glucose concentration (Skokan et al., 2007)
In any case, 10 packets of Sweet’n Low is probably too many packets of Sweet’n Low… just sayin’
Check out my Patreon campaign! Five bucks a month for full access and there are many other options. It’s ad-free and you can cancel if it sucks 🙂
Consults are open, contact me if you’re interested: drlagakos@gmail.com
Affiliate links: join Binance and get some cryptoassets or download Honeyminer and get some Bitcoins for free! And now you can mine Bitcoin from your Chromebook!
Still looking for a pair of hot blue blockers? Carbonshade and TrueDark are offering 15% off with the coupon code LAGAKOS and Spectra479 is offering 15% off HERE. If you have no idea what I’m talking about, read this then this.
20% off some delish stocks and broths from Kettle and Fire HERE.
If you want the benefits of ‘shrooms but don’t like eating them, Real Mushrooms makes great extracts. 10% off with coupon code LAGAKOS. I recommend Lion’s Mane for the brain and Reishi for everything else.
Join Earn.com with this link.
Start your OWN Patreon campaign!