Tag Archives: Atkins

Meal frequency, intermittent fasting, and dietary protein

Dietary protein “requirements” are some of the most context-dependent nutrient levels to decipher, and depend largely on energy balance and even meal frequency.

An objective look at intermittent fasting (Alan Aragon, 2007)

Meal frequency and energy balance (Lyle McDonald, 2008)

New study: “Increased meal frequency attenuates fat-free mass losses and some markers of health status with a portion-controlled weight loss diet” (Alencar et al., 2015)

This wasn’t well-received in social media because bro-science & many low carb advocates say grazing is no longer in vogue — “it’s much better/healthier/whatever to eat once or twice daily, because intermittent fasting and all that jazz” …however, this may be problematic when it comes to meeting overall protein needs, which is particularly important when you’re losing weight.

The study: 2 vs. 6 meals per day, crossover.

Conclusion: “On average, fat-free mass (FFM) decreased by -3.3% following the 2 meals/d condition and, on average, and increased by 1.2% following the 6 meals/d condition (P<.05).

fat-free mass

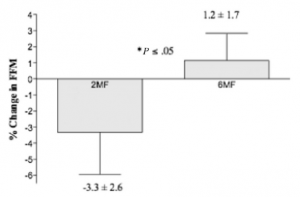
In other words, 6 meals per day was better for body composition than 2 meals per day.  But context is everything, and this hypothesis has been tested from a variety of different angles, so what does it mean?

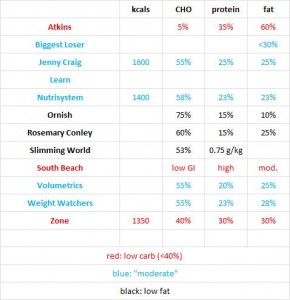
The relevant context here: 1) big energy deficit (1200 kcal/d for obese women is a pretty low calorie intake); and 2) “adequateTM” protein intake (75 g/d).

The standard dogma says that in the context of an adequate protein hypocaloric diet, meal frequency matters a LOT, whereas with high protein, it doesn’t matter as much.  Theory being that with an “adequate” (read: too low?) overall protein intake, the fasting periods are simply too long with only two meals per day; you need either: 1) higher protein intake; 2) increased meal frequency; or 3) more calories (ie, smaller energy deficit).

In this study, BOTH diets suppressed insulin and induced weight loss, but the increased protein feeding frequency skewed the weight loss to body fat while preserving fat-free mass.   I actually agree with a lot of the bro-science in this case, and also think that 75 grams of protein is not enough in the context of a big energy deficit (if body composition is a goal).


Historical precedence?

Meal frequency and weight reduction of young women (Finkelstein et al., 1971)

Relevant context:  6 vs. 3 meals per day (3 meals per day may not seem like that many more than 2, but it significantly cuts down on the duration of time spent with no food or protein).

Smaller energy deficit: 1700 kcal/d in overweight patients is less of a deficit than 1200 kcal/d in obese patients.

Higher protein intake: 106 – 115g/d.

Result: nitrogen balance (a surrogate for the maintenance of muscle mass) and fat loss were similar in both groups.  This study fixed two problems in the abovementioned study: 1) 3 meals is better than 2 in the context of an energy deficit; and 2) protein intake was higher.

And again here, with 3 vs. 6 meals per day (Cameron et al., 2010), just to make the point that 3 meals per day is better than 2 for preserving lean mass in the context of an energy deficit.

The effect of meal frequency and protein concentration on the composition of the weight lost by obese subjects (Garrow et al., 1981)

This study tested the opposite extremes: super-low calorie intake (800 kcal/d), much lower protein intakes (20g – 30g/d), and 1 vs. 5 meals per day.

Result: “a diet with a high-protein concentration, fed as frequent small meals, is associated with better preservation of lean tissue than an isoenergetic diet with lower-protein concentration fed as fewer meals.”

It basically confirmed all of the above.

Protein feeding pattern does not affect protein retention in young women (Arnal et al., 2000)

1 vs. 4 meals per day; and 70 grams of protein but no energy deficit (~2000 kcal/d isn’t very hypocaloric for lean young women).  In this study, no effect of meal frequency was seen, likely because 70 grams of protein isn’t inadequate when energy intake isn’t restricted.

1. PROTEIN “NEEDS” ARE HIGHLY CONTEXT-DEPENDENT

2. NEED =/= OPTIMIZATION

3. MEAL FREQUENCY & meal timing and peripheral circadian clocks > “MACRONUTRIENTS”

If you’re losing weight (ie, in an energy deficit), then intermittent fasting is cool if protein intake is high (above “adequateTM“)… the bigger the energy deficit, the more protein is necessary to optimize changes in body composition.

How much is ‘enough?’  Sorry, can’t give you a gram or even gram per pound of body weight answer… but if you’re losing weight and seeing no discernible effect on body composition (muscle vs. fat mass), then it may be prudent to consider eating more protein-rich foods… and paying more attention to sleep quality (which also greatly impacts nutrient partitioning).

No amount of protein will help you if circadian rhythms aren’t intact!!!

further reading:

Yes, it’s a high protein diet (Tom Naughton, 2015)

Protein requirements, carbs, and nutrient partitioning

Dietary protein, ketosis, and appetite control 

Become a Patron!

For personalized health consulting services: drlagakos@gmail.com.

Affiliate links: KetoLogic for keto-friendly shakes, creamers, snacks, etc. And get 15% off your ketone measuring supplies HERE.

Still looking for a pair of hot blue blockers? TrueDark is offering 10% off HERE and Spectra479 is offering 15% off HERE. If you have no idea what I’m talking about, read this then this.

Join Binance and get some cryptoassets or download Honeyminer and get some Bitcoins for free

20% off some delish stocks and broths from Kettle and Fire HERE

If you want the benefits of  ‘shrooms but don’t like eating them, Real Mushrooms makes great extracts. 10% off with coupon code LAGAKOS. I recommend Lion’s Mane for the brain and Reishi for everything else

Join Earn.com with this link.

Start your OWN Patreon campaign!

calories proper

Carbs: Low vs. Lower


This was met with much backlash from the low carb cavalry, because, well, if low is good then lower must be better

I’m not anti-keto; but I’m not anti-science.  FACT.


“…some people are not genetically equipped to thrive in prolonged nutritional ketosis.” –Peter Attia

Continue reading

Ketoadaptation and physiological insulin resistance

This is where the magic happens.

Rat pups, fed a flaxseed oil-based ketogenic diet from weaning onward – note the drop-off in ketones after 2 weeks (Likhodii et al., 2002):

flaxseed ketogenic diet

What happened on day 17?

Patient history: these rats have been “low carb” their whole lives.

Side note: flaxseed oil is very ketogenic! (Likhodii et al., 2000):

ketogenic rodent diets

Flaxseed oil-based ketogenic diet produced higher ketones than 48h fasting; the same can’t be said for butter or lard.  PUFAs in general are more ketogenic than saturated fats in humans, too (eg, Fuehrlein et al., 2004):Saturated polyunsaturated ketones

Crisco keto (adult rats) (Rho et al., 1999):

shortening-based ketogenic diet

suspect those two rogue peaks were experiment days…

Continue reading

2 New Diet Studies

*ugh* journalists

I’m talking to you, Mandy Oaklander!

Regarding the new low carb vs low fat study, she writes: “Popular diets are pretty much the same for weight loss, study finds.

Effects of low-carbohydrate and low-fat diets: a randomized control trial (Bazzano et al., 2014)

Further, “An earlier study in Annals of Internal Medicine did find that low-carb dieters lost slightly more weight than low-fat dieters after one year. The study today reached similar conclusions, but the differences in weight loss were not significant.”

Perhaps Mandy just doesn’t realize there’s a difference between significant, as in “meaningful,” and significant, as in “P<0.05.”  Pro-tip: you can tell them apart relatively easily, because the latter is usually accompanied by a cute little asterisk.  For example, the differences in weight loss were quite statistically significant (P<0.05):

Bazzano BW
She goes on to say “After a year follow-up, some of those pounds crept back for people on both diets…”

To that I say: yeah, but fat mass continued to decline in those on the low carb diet, meaning some of that weight re-gain was muscle:

Bazzano FM

So, between 6 and 12 months, carbs and calories were creeping up in the LC group, yet fat mass was still declining.  Perhaps this way of eating improved their metabolism, or restored the ability to effectively partition nutrients.

***in real-time: at this point, I realize that Mandy was actually talking about the other study, which she was covering accurately.  Sorry, Mandy!***

Bazzano PA

…so maybe the low-carb (LC) diet improved muscle mass because it was also high protein? …perhaps, but 19% vs 24% (71 vs 85 grams) isn’t a very big difference.  Alternatively, since the LC group really just maintained absolute protein intake (86 grams at baseline, 85 at month 12), whereas low-fat (LF) dieters decreased (86 grams at baseline, 71 at 12 months); perhaps this is why LF lost muscle mass..?  Still, those changes in protein intake are small, and I think people can be too quick to chalk up the benefits of LC to “high protein.”

In sum, this is actually one of the more “pro” LC studies.  And it wasn’t even a huge difference in carbs: 198 vs 127 grams/d at month 12 (54% vs 34%).  Big difference in fat mass; and CRP, a marker of inflammation, even declined in the LC group.

Low fat diet advocates have been giving me headaches for years… the low fat diet caused headaches (P<0.05):

Adverse Events 1


Adverse Events 2

The study Mandy was actually talking about: Comparison of weight loss among named diet programs in overweight and obese adults: a meta-analysis (Johnston et al., 2014)

It was a meta-analysis, which is just about the only type of study capable of taking down LC.


…but at least it had this cool chart (modified):

cool chart (modified)

cool chart (modified)


*ugh* scientists

crap

The macro’s in “Low fat” overlap with “Moderate,” implying “Low carb” is “EXTREME”  …the authors’ bias is subtle, I’ll give ‘em that, but I’m getting too old for this.

Dear Obesity Researchers,

If you want to design a study showing a low fat diet is as good as low carb for fat loss, here’s your best bet: recruit young, exercise-tolerant overweight patients who aren’t on any meds.  PROOF (see Ebbeling study).  Or find 10 similar ones and write up a pro-LF meta.

If you want to show low carb is better, recruit patients with obesity.


calories proper

Lipid Hypothesis 2.0: Eat Butter

The original lipid hypothesis stated, more or less, that lowering blood cholesterol would reduce premature mortality from heart disease.  At the time, it was thought that dietary cholesterol and saturated fat increased the ‘bad’ type of blood cholesterol, so the advice was to restrict those foods.  All of that was wrong.

Time

Lipid Hypothesis 2.0: Eat Butter

Continue reading

More on physical performance and ketoadaptation

The various studies on how low carbohydrate diets impact physical performance are very nuanced.  Here’s what I mean by that.

Exhibit A. Phinney 1980

Phinney 1980

In this [pioneering] study, obese patients were subjected to a variety of performance assessments in a baseline period, then after 1 and 6 weeks of weight loss via protein-sparing modified fast (1.2 g/kg ideal body weight from lean meat, fish, or fowl; probably around 80 grams of protein/d, 500-750 kcal/d). They lost a lot of weight, 23 pounds on average, two-thirds of which was body fat. There was no exercise intervention, just the performance assessments.

During the ‘exercise to exhaustion’ treadmill exercise, RQ steadily declined from baseline to week 1 to week 6, indicating progressively more reliance on fat oxidation.  This was confirmed via muscle glycogen levels pre- and post-exercise: during the baseline testing, they declined by 15%; after 6 weeks of ketoadaptation, however, they only declined by 2%, while ‘time to exhaustion’ increased by 55%.  After only 1 week of the diet, time to exhaustion plummeted, as expected, by 20%.

This was, as mentioned above, a pioneering study in the field of ketoadaptation. It also challenges one of the prevailing theories of ‘fatigue’ …while carb-adapted, the subjects fatigued after 168 minutes, with muscle glycogen levels of 1.29 (reduced by 15%); while ketoadapted, they fatigued after 249 minutes with muscle glycogen levels of 1.02 (reduced by 2%).  In other words, they had less glycogen to begin with, used less glycogen during exercise, and performed significantly better (running on fat & ketones).

Exhibit B. Vogt 2003

Highly trained endurance athletes followed a high fat (53% fat, 32% carbs) or high carb (17% fat, 68% carbs) diet for 5 weeks in a randomized crossover study. In contrast to Phinney’s study, these participants were: 1) highly trained; and 2) exercised throughout the study.

Maximal power output and VO2max during a similar ‘time to exhaustion’ test was similar after both diet periods.  Same for total work output during a 20 minute ‘all-out’ cycling time trial and half-marathon running time.  Muscle glycogen was modestly, albeit statistically non-significantly lower after ketoadaption; however, ketoadapted athletes relied on a higher proportion of fat oxidation to fuel performance as indicated by lower RQ at every level of exercise intensity:

Vogt RQ

Again, this is the essence of ketoadaptation. Physical performance as good as or better using fat and fat-derived fuels.

One reason Phinney’s glycogen-depeleted ketoadapted subjects may have done so well is their reliance on ketones (probable) and intramyocellular lipids (IMCL) (possible).  In Vogt’s study, IMCL increased from 0.69 to 1.54% after ketoadaptation…

Also, food intake and body fat declined, and training volume increased in the low fat group; whereas food intake increased, and body fat and training volume declined in the high fat group.  Reminiscent of anything?

High fat, low carb -> eat more, exercise less, STILL LOSE BODY FAT.

Vogt data

Sorcery?  No.  Diet impacts more than just mood and body composition – resting energy expenditure increased in the ketogenic dieters.  This isn’t an isolated finding.

Exhibit C. Fleming 2003 

This was another study in non-trained athletes, consuming high fat (61% fat) or control (25% fat) diets for 6 weeks.  The tests were the 30-second Wingate, to examine supramaximal performance, and a 45-minute timed ride, to examine submaximal performance.

This study differed from the previous two in several significant ways.  For starters, peak power output declined in both groups, slightly more so in the high fat group (-10% vs. -8%).  Furthermore, RQ didn’t wasn’t significantly lower during this test in the high fat group, which possibly suggests they weren’t properly ketoadapted.  In Phinney’s study, the large energy deficit ensured ketoadaptation; this study lacked that aspect, somewhat more similar to Vogt’s, although unlike Vogt’s, these participants weren’t athletes which presumably makes ketoadaptation more difficult.

There are many factors at play… I wasn’t kidding when I said these studies are very nuanced!

Exhibit D. the infamous, Paoli 2012 

These were ‘elite artistic gymnasts,’ who could likely beat you in a race running backwards.  The ketogenic phase consisted of 55% fat and much more protein than the control phase (39% fat; protein: 41% vs. 15%). The significantly higher protein content was modestly offset by slightly more calories in the control phase, which reduces the amount of protein required to maintain nitrogen balance.

In this study, performance was, for the most part, ‘maintained,’ with relative increases in a few of the tests; eg, the “legs closed barrier.”  Changes in body composition were more robust: significantly reduced body fat and increased lean body mass after 30 days of ketogenic dieting (with their normal exercise routine).

Paoli data

The major confounder in this study was the use of an herbal cocktail only in the ketogenic diet group; despite this, the results are largely in line with the other studies.  For more on this study, see here.

Exhibit E. the most dramatic one to date: Sawyer 2013 

Please see here for the details, but in brief, strength-trained athletes showed improvements in high intensity exercise performance after only 7 days of carbohydrate restriction.  The nuances of this particular study are discussed more here.

barbell

Collectively, these studies show that physical performance in both endurance and high intensity realms does not always suffer, can be maintained, and in some cases is improved by ketogenic dieting.  Important factors are duration (to ensure adequate ketoadaptation), energy balance, and regular physical activity (athletes and regular exercisers can adapt to burning fat much quicker than sedentary folks).


calories proper

Diet study: American Diabetes Association vs. Low Carb Ketogenic

A randomized pilot trial of a moderate carbohydrate diet compared to a very low carbohydrate diet in overweight or obese individuals with type 2 diabetes mellitus or prediabetes (Saslow et al., 2014)

Disclaimer: this study was not ground-breaking; it was confirmation of a phenomenon that is starting to become well-known, and soon to be the status quo. That is, advising an obese diabetic patient to reduce their carb intake consistently produces better results than advising them to follow a low fat, calorie restricted diet.

The two diets:

Moderate carbohydrate diet: 45-50% carbs; 45 grams per meal + three 15 gram snacks = 165 grams per day; low fat, calorie restricted (500 Calorie deficit).  Otherwise known as a “low fat diet (LFD).”

In their words: “Active Comparator: American Diabetes Association Diet.  Participants in the American Diabetes Association (ADA) diet group will receive standard ADA advice. The diet includes high-fiber foods (such as vegetables, fruits, whole grains, and legumes), low-fat dairy products, fresh fish, and foods low in saturated fat.

Very low carbohydrate diet: Ketogenic; <50 grams of carb per day, no calorie restriction, just a goal of blood ketones 0.5 – 3 mM.

In their words: “Experimental: Low Carbohydrate Diet.  Participants will be instructed to follow a low carbohydrate diet: carbohydrate intake 10-50 grams a day not including fiber. Foods permitted include: meats, poultry, fish, eggs, cheese, cream, some nuts and seeds, green leafy vegetables, and most other non-starchy vegetables. Because most individuals self-limit caloric intake, no calorie restriction will be recommended.

Both groups were advised to maintain their usual protein intake.

Continue reading

Carbohydrates, calories, appetite, and body weight.

The Optimal Diet, Atkins, South Beach, Paleo, Zone… all have one thing in common: some degree of carbohydrate restriction.

Low, lower, lowest: does it matter?

There are 4 relatively large, randomized ‘diet-induced weight loss’ studies that all reported fairly comprehensive food intake and body composition data. The studies ranged in duration from 24 weeks to one year and included anywhere between 50 and ~300 overweight and obese participants.

In general, participants assigned to the low fat intervention were advised to restrict calories and fat whereas those assigned to low carb were told they could eat as much as they wanted as long as it wasn’t carbs.

Your mileage may vary – but these studies cover a large number of subjects from a wide range of backgrounds, suggesting the results might be applicable across the board.  Conclusion?  the amount of body fat lost was much more strongly associated with the reduction in carbohydrates than calories.  The only modestly surprising aspect was the magnitude… (see the figures below).

The four studies, in chronological order:

Brehm 2003: over the course of 6 months, those who consumed an average of 163 grams of carbohydrate per day lost 8.6 pounds of body weight while those who consumed 97 grams lost 18.7 pounds.

McAuley 2005: 24 weeks; those who ate 171 grams lost 10.3 pounds, while those who ate 133 grams lost 15.2 pounds, and those who ate 107 grams lost 15.6 pounds.

Maki 2007: 36 weeks; those who ate 186 grams lost 5.7 pounds, those who ate 131 grams lost 9.9 pounds.

Gardner 2007: 1 year – those who ate 138 grams lost 10.3 pounds, 181 grams lost 3.5 pounds, 195 grams lost 4.8 pounds, and 197 grams lost 5.7 pounds.

Continue reading

Dietary protein, ketosis, and appetite control.

Dietary protein has a purpose, and that purpose is not carbs.”  Nor is it to break ketosis or stall weight loss.  

Drastically increasing protein intake may reduce the degree of ketosis in the context of a large energy surplus, but this is likely due more specifically to the large energy surplus than the protein.  This would explain why Warrior dieters (1 meal meal per day) often report reduced ketones if they eat too much protein.  It’s more likely that the 2000 kcal bolus is exerting it’s anti-ketotic effect by being a large energy surplus, such that anything other than 90% fat would blunt ketosis.  It’s not the proteins… Want proof?  Here’s an n=1 to try: give up Warrior dieting for a few days and try 3 squares.  My bet is that you’ll be able to increase protein intake and still register ketones as high or higher than before.  There are data to support this and reasons why it may not matter (below).

disclaimer: I don’t think “deep ketosis” is necessary to reap the benefits of carbohydrate-restriction.  But if you love high ketone meter readings, then this might be a better strategy to maintain deep ketosis while getting adequate protein. win-win.

if I hear: “oh no, I was kicked out of ketosis!” one more time… 

All of the studies below are confounded one way or another, but so are we humans.

Continue reading

Implications of the circadian nature of ketones.

Ketosis.  Happens during starvation and also by restricting carbohydrates (and protein, to a lesser degree)… might be important for epilepsy and bipolar disorder, too.

ketogenesis

Ketostix measure urinary acetoacetate (AcAc) and reflect the degree of ketosis in the blood probably about 2-4 hours ago.  Blood ketone meters measure beta-hydroxybutyrate (bHB) right now.  bHB fluctuates to a greater degree, eg, it plummets after a meal whereas AcAc takes longer to decline.  AcAc/bHB is usually around 1, but increases after a meal (Mori et al., 1990):Ketone body ratio

Conversely, when glucose levels decline and fatty acid oxidation increases, liver redox potential drops which reduces AcAc/bHB.

Continue reading