Category Archives: Trans fat

USDA vs. nutrition, round II

The school lunch program is screwed.

First the USDA modifies the definition of a vegetable to include pizza.  Now they significantly altered their standards for school lunches to include fewer healthy foods and more USDA-approved ones (see report at the USDA’s website).  In brief, this move further reduces the nutrition of school lunches and will likely do more harm than good.  Here’s why:

In this cross-sectional Swedish study, parents recorded 7-day food diaries for their 4-year old children who then went in for a regular checkup.

Metabolic markers in relation to nutrition and growth in healthy 4-y-old children in Sweden (Garemo et al., 2006 AJCN)

On a 1,400 kcalorie diet, these children were consuming roughly 15% protein, 33% fat, and 52% carbs (about 20% of which came from sucrose).  That seems like a lot of calories, but besides playing all day, 4 year old children are also growing at an incredible rate.

Interesting finding numbers 1 & 2:  Children who got most of their calories from fat had the lowest BMI (i.e., they were the leanest), and the opposite was observed for carbs.
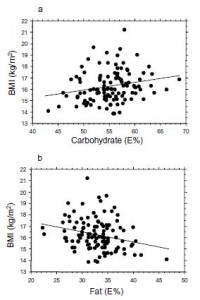
When divided into groups of normal weight vs. overweight and obese, some interesting and non-intuitive patterns emerged.  For example, lean kids don’t eat less food; but they do eat fewer carbs and less sucrose (and make up the difference by eating more fat and saturated fat).

Some of the weaker correlations showed:
-total calorie intake was associated with growth (logical)
-total carbohydrate intake was associated with increased fat mass (unfortunate yet also logical)
-total fat intake was associated with decreased fat mass (interesting)

And those who ate the most saturated fat had the least amount of excess body fat. (more on this below)

Fortunately, in a young child, a poor diet hasn’t had enough time to significantly impact their metabolic health; as such no macronutrient was associated, either positively or negatively, with insulin resistance [yet].

In a more appropriately titled follow-up, Swedish pre-school children eat too much junk food and sucrose (Garemo et al., 2007 Acta Paediatrica), Garemo reported that most of their carbs came from bread, cakes, and cookies, while most of the sucrose came from fruit, juices, jam, soft drinks, and sweets.  And WOW, go figure- most of the fat came from meat, chicken, sausage, liver, eggs, and dairy; NOT vegetable oils.

And in a mammoth dissertation, Eriksson (2009) confirmed many of these findings in a larger cohort of 8-year old Swedish children and had this to say about dairy fat:
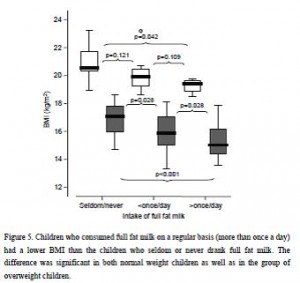
The open boxes represent overweight kids, the closed boxes are lean kids.  Going from left to right, in either the open or closed boxes, BMI declines with increasing intake of full fat milk (perhaps parents should reconsider skim milk?).  Eriksson also confirmed that saturated fat intake was strongly associated with reduced body weight.  Interestingly, she mentioned that food intake patterns are established early in life, so it might be prudent to remove sugars and other nutrient poor carb-rich foods, and introduce nutritious whole foods as early as possible.  I’m not exactly sure how she assessed patterns of food intake establishment, but it seems logical.  Especially in light of the following study… we’ve seen 4 year olds, 8 year olds, and now we have 12-19 year olds.  The relationship between diet and health is consistent across all age groups.

Virtually all of the above data in Swedish children seem to suggest dietary saturated fat, whether it’s from beef, sausage, eggs, whole fat dairy, or liver (i.e., WHOLE food sources; NOT hydrogenated vegetable oils), is associated with reduced fat mass.  Metabolic abnormalities were not present, probably because the children were simply too young (although body weight seems to respond relatively quickly, other downstream effects of poor nutrition take years to accumulate before symptoms develop).

An American study about nutrient density and metabolic syndrome was recently published.  These kids were exposed to poor nutrition for just long enough to experience some of those malevolent effects.

Dietary fiber and nutrient density are inversely associated with the metabolic syndrome in US adolescents (Carlson et al., 2011 Journal of the American Dietetic Association)

The figure below divides fiber (a proxy for good nutrition; i.e., leafy vegetables, beans, etc.) and saturated fat into groups of least and most amounts comsumed. The lowest fiber intake was 2.9 grams for every 1,000 kcal, and 9.3% of these kids already had metabolic syndrome; the highest fiber intake was 10.7 grams / 1,000 kcal and 3.2% had metabolic syndrome.  Thus, consuming a fiber-rich [nutrient dense] diet is associated with a significantly reduced risk of metabolic syndrome.

The next rows are saturated fat.  The lowest saturated fat intake was 6.9 grams / 1,000 kcal and 7.2% had metabolic syndrome; the highest saturated fat intake was 18 grams / 1,000 kcal and 6.7% had metabolic syndrome…. huh?  While it didn’t reach statistical significance, the trend for saturated fat paralleled that of a “nutrient dense” diet.  Is it possible that saturated fat might be part of a nutrient dense diet?   if saturated fat comes in the form of red meat, liver, eggs, etc., then yes, it is part of a nutrient dense diet.  This conclusion evaded both the study authors and the media.

In 4 and 8 year old Swedish children, those who ate the most saturated fat had the least excess fat mass.  In 12 – 19 year old American adolescents, those who ate the most saturated fat had the lowest risk for metabolic syndrome.

Is it too much of a stretch to connect these ideas by saying that in the short run, a low saturated fat (nutrient poor, carb-rich) diet predisposes to obesity; and in the long run it predisposes to metabolic syndrome  ???

Collectively, these data suggest a diet based on whole foods like meat and eggs, including animal fats, with nutrient dense sources of fiber (e.g., leafy vegetables) but without a lot of nutrient poor carb-rich or high sugar foods, may be the healthiest diet for children.  
Flashback: recap of “USDA vs. nutrition, round I”
USDA: 1
Nutrition: 0
They made pizza a vegetable and insiders suspect that next they’ll try to make it a vitamin.

USDA vs. nutrition, round II

USDA: replacing normal milk with low fat milk
nutrition: full-fat milk was associated with lower BMI in both lean and obese children (see the Eriksson figure above)

USDA: increasing nutrient poor carb-rich options
nutrition: this was associated with increased fat mass in children (Garumen et al., see figures above)

USDA: reducing saturated fat as much as possible
nutrition: reduced saturated fat was associated with excess fat mass in children and metabolic syndrome in adolescents.

Such changes will have an immeasurable long-term impact if children grow up thinking these are healthy options.  Finally, this blog post does not contain a comprehensive analysis of saturated fat intake and health outcomes in children, but the USDA’s new regulations should have been accompanied by one.  In other words, these regulations should not have been based on the studies discussed above, but the studies discussed above should have been considered when the USDA was crafting their recommendations.  Obviously, they weren’t.

calories proper

Fructose vs. The Laws of Energy Balance

Exclusively from literature featured in past blog posts, e.g. HERE and HERE, excessive fructose consumption seriously deranges metabolism.  Furthermore, fructose pre-disposes to and exacerbates leptin resistance, which is one of the most proximal causes of obesity viz. overeating.  However, this doesn’t exonerate processed foods, modern grain-based diets, or trans-fats because they frequently co-exist.  Many popular breakfast cereals contain all three, and IMO a fructose-free breakfast cereal wouldn’t do much in the treatment and/or prevention of obesity.  Just eat better.  And we might even get “low-fructose” foods on grocery store shelves in the near future (but don’t hold your breath, food companies LOVE their fructose).

Consuming fructose-sweetened, not glucose-sweetened, beverages increases visceral adiposity and lipids and decreases insulin sensitivity in overweight/obese humans (Stanhope et al., 2009 Journal of Clinical Intervention)

Consumption of fructose-sweetened beverages for 10 weeks reduces net fat oxidation and energy expenditure in overweight/obese men and women (Cox et al., 2011 European Journal of Clinical Nutrition)

Metabolic responses to prolonged consumption of glucose- and fructose-sweetened beverages are not associated with postprandial or 24-h glucose and insulin excursions (Stanhope et al., 2011 American Journal of Clinical Nutrition)

These studies came out in a few separate publications, were ultra-high budget, and used very advanced techniques to quantify energy expenditure and body composition.  AND much care was taken to ensure the subjects were truly weight stable when appropriate (inpatients for two weeks in the beginning and end of the study so all of their food intake and anthropological measurements could be assessed accurately).  The experiment consisted of feeding subjects a sugar-sweetened beverage, either glucose or fructose, equivalent to 25% of their daily energy requirements.

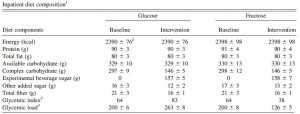
During the inpatient portions, subjects were fed a standardized diet of 15% protein, 20% fat, and 55% carb:

Note the differences in GI & GL (bottom two rows).   Fructose has a negligible impact on glycemia because, well, it’s fructose (not glucose), and it doesn’t magically transform into glucose after ingestion.

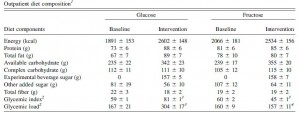
When left to their own free will, the patients pretty much ate the same:

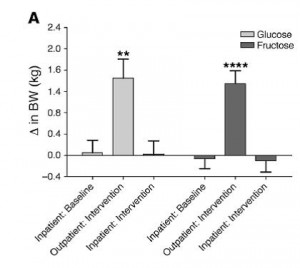
In general, after a period of adaptation, their intake of other foods should have declined by 25% to compensate for the additional calories from the sugar drinks, but sugar seems to hijack the appetite set point – first row in the table above; calories were 20-25% higher, almost the exact amount of calories in their sugar drinks – therefore all subjects gained a few pounds (1% of initial body weight) (and then they went back on good behavior when they were being observed in the metabolic ward):

Herein we have the first unexpected pearl: the fructose group gained visceral fat (VAT) whereas the glucose group gained subcutaneous fat (SCAT) (eerily similar to what is seen with trans-fats!).

Exhibit A:

The glucose group actually gained slightly more fat mass than the fructose group, but most of the excess weight was deposited in the relatively inert SCAT, or “extraabdominal” regions.  The fructose group, on the other hand, gained it all in VAT (apple, not pear).  Abdominal fat and waist circumference increased significantly in the fructose drinkers.  FYI that is very interesting.  And it wasn’t caused by individual differences- it’s not like some people were more predisposed to gain more VAT than SCAT; these subjects were randomized.  Diet, or more specifically, dietary sugars caused this differential fat storage.  Amazing.

Exhibit B:

This figure shows the differences in fat gain.  The glucose group gained less VAT than SCAT, while the fructose group did the opposite.  Genetics had nothing to do with this.  It is diet.  It is nutrition.  For the love of God people, it is nutrition.

In lieu of the recent publication by Dr. Bray, it is interesting to note the second pearl: an example of the irrelevance of the laws of thermodynamics (universal) with respect to the Laws of Energy Balance (conjured up by yours truly).  Namely, energy expenditure is affected by the diet… IOW, the laws of thermodynamics are not violated, but all calories are not equal (THERE. I said it… on the record, in cyberspace, for all of eternity).

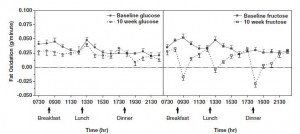
This nuance is introduced in figure 2:

Divide and conquer

On the left, fat oxidation is slightly lower in the glucose group.  This is expected, because carb oxidation should have increased due to the increased carb consumption (in the form of the glucose drink).  But as seen in the right panel, fat oxidation declined significantly in the fructose group.  From this, we would expect fat gain to be greater in the fructose group compared to the glucose group … but it wasn’t.  Artefact?  Error in measurement?  I don’t know how, but this appears to be a violation of the Laws of Energy Balance (which is impossible).  UNLESS energy expenditure declined more in the fructose group than in the glucose group.

Exhibit C:

And it did!  Both groups increased their sugar consumption (by design), and energy expenditure declined in both groups (they all gained weight).  The fructose group gained about a pound less than the glucose group, but consumed slightly fewer calories on average.  So the reduced fat oxidation didn’t enhance fat gain in the fructose group because food intake declined proportionately; and they maintained energy balance relative to the glucose group because energy expenditure was slightly lower (this is complicated).

To be clear, the fructose-induced VAT deposition is not explained by reduced fat oxidation as that would imply less fat gain overall, relative to the glucose group (which didn’t happen).

Fructose-induced VAT deposition is a product of the deranged nutrient partitioning caused by fructose itself.  It’s a dangerous lil’ bugger.  How does fructose conspire with the metabolic machinery to selectively enhance visceral adiposity?  Not sure, but it might have something to do with insulin.  Glucose but not fructose stimulates insulin secretion, and SCAT is more sensitive to the anti-lipolytic effects of insulin than VAT.  The overall fat gain was similar in both groups, in accord with the Laws of Energy Balance.   But insulin tends to drive fat into metabolically safer SCAT.  An example of this concept in practice can be seen by looking at obese insulin resistant people.  In this population, SCAT is less responsive to insulin, relativeto lean people, and indeed, they have significantly greater visceral fat mass.  So fructose doesn’t trigger an insulin response, which means excess calories are less likely to be stored in SCAT, but since this can’t violate the Laws of Energy Balance the calories must go somewhere…  deposited into the notorious VAT bank where they not only still make you fat but also initiate a storm of metabolic abnormalities.


calories proper

pizza on the docket

they’re all crooks!

or

a slice of pizza does not count as a serving of vegetables. Period.

not the worst thing for you, really just a bunch of empty calories.  definitely NOT a serving of vegetables.

The government-sponsored school lunch program is designed to provide nutrition and improve the health of our children.  And they get around 11 billion dollars (i.e., $11,000,000,000) every year to do so.  Due to the recent surge in obesity, Congress acted fast!  School lunch programs do not closely follow the dietary guidelines.  To us taxpaying voters, $11,000,000,000 of our taxes are being wasted AND our kids are suffering.   Therefore, Congress quickly changed the status of pizza to “vegetable.”  Many schools serve pizza, and thus are now more closely in line with the dietary guidelines; so our taxes are being less-wasted and our children are healthier because they are eating more vegetables! To be clear: now that pizza is a vegetable, your children are healthier.

You can’t make this shit up – it is what happens when government gets involved in nutrition.  Please, ignore the Dietary Guidelines, they are horribly misguided.  And be extremely wary of electing anyone who wants to control nutrition; or vote with your dollars, don’t buy processed food!  The message is almost always wrong and both our bank accounts and our health suffer the consequences.  I would suggest supporting nutrition education programs, but NOT IF THEY SAY PIZZA IS A VEGETABLE.  If anything, a slice of pizza should count as dessert plus 3 servings of grains :/

Isn’t it bad enough that French fries, or crisps, count as vegetables?

Admittedly, claiming “the Dietary Guidelines are horribly misguided” is a strong statement, especially when said guidelines direct how a portion of our taxes are spent AND which foods are made available to our children.  This is important.
 

calories proper


Become a Patron!


Save

Nutrition under attack

Global nutrition is in a state of emergency

Tax this:

Not this:


If you catch a whiff of anyone talking about a dietary fat tax here in the states, attack!  Hold no bars.
Passage of the Danish saturated fat tax confirms the shit hit the fan.  They should’ve taxed people for being fat (to offset the increased medical and healthcare costs associated with obesity), or sugars (for making people fat).  Instead, the food companies, famous for crafting thousands of varieties of Danish pastries, lobbied for the taxes to be levied against dietary fat.  This “inadvertently” encourages people to consume more Danish pastries with only 7 grams of saturated fat yet 39 grams of sugar!  The tax will favor Pop Tarts over eggs, and this is supposed to make people healthier?

A dietary fat tax is particularly troublesome because it strikes an expensive blow against real whole foods like eggs, butter, and meat, while leaving unscathed processed foods like doughnuts, refined grains, and SUGAR.  This disproportionately affects healthy foods that are in no way responsible for the obesity epidemic.

My suggestions:

1)      Leave people alone.

2)      A better target, which would entail markedly less collateral damage, is “added” sugars.  Taxing “added” sugars would hit soda, processed food-like products, snacks, and junk food… lots of bad guys, few good guys

3)      Make a tax based on empty calories: foods with a higher ratio of calories to nutrients get taxed more than nutrient-dense foods… thus, people would be eating fewer calories but more nutrients!  That wasn’t too hard?

4)      Tax food in direct proportion to its shelf-life.

5)      The revenue from any of these alternative options should be put toward nutrition education programs in elementary schools.  And a portion of the money saved in healthcare costs should be redirected into funding research in the nutritional sciences.  And the rest can be used to pay off the National debt.


Calories proper


Empty calories III

Empty calories.  Nutrient density.  Empty calories.  The ANDI score?

With the advent of the ANDI, it is safe to say the phrase, school of thought, and cult following to “a calorie is a calorie” is fading.  All calories were not created equal; some make you fat, others make you strong.  Cantankerous old biochemists and low-fat diet proponents will likely remain loyal, however, with the former citing heat production in a bomb calorimeter (mumbo), and the latter citing the equivalency of nutrient density and animal fat scarcity (jumbo).

But for the rest of us, there is gravitas in this concept       empty calories.

A good place to start might be a critical view of Fuhrman’s  Aggregate Nutrient Density Index (ANDI).  In brief, ANDI is an index of healthiness and is calculated by dividing the amount of nutrients in a given whole food by the calories.

Pro’s and con’s

1)      it only applies to whole foods.  This is convenient because most processed foods would score miserably low unless they’ve been industrially fortified with synthetic vitamin-like chemicals.  Perhaps Fuhrman restricted ANDI to whole foods because something like Diet Coke Plus would score about a million (lots of vitamins, few if any calories), rendering ANDI utterly meaningless to the masses and downright offensive to people like me.


2)       “nutrients per calorie” is a far more biologically meaningful and physiologically relevant concept than “calories per gram.”

  1. “Calories per gram” can be too easily manipulated.  E.g., one ounce (~28 grams) of soybean oil has 248 kilocalories: 248 kilocalories / 28 grams ? 9 kcal/g.  Add it to an ounce of water and you get 248 / 56 ? 4.4 kcal/g.  It’s still the same nutritionally, but the “caloric density” was halved by trickery.
  2. “Nutrients per calorie” is relatively unchangeable.  Let’s say there are 14 grams of omega-6 fatty acids in an ounce of soybean oil; that would be 14 grams per 248 kcal.  Add it to an ounce of water and it’s still true.  Drink it on the moon and it’s still true (relatively).

However,

1)      ANDI selectively quantifies only one aspect of a food’s nutritional value.  It is an important aspect, but please note that a diet based on high ANDI foods would be nutritionally inadequate.  Furthermore, there are highly relevant health parameters that ANDI completely ignores.  More questions:

  1. Shouldn’t more important nutrients be given a higher score?
  2. Shouldn’t excess amounts of a nutrient detract from the score?
  3. What about other non-nutritive health-promoting properties of a food?  E.g., foods that are healthier than indicated by their ANDI score:
    1. i.      foods that have some as-of-yet undiscovered nutrients
    2. ii.      foods that indirectly promote health (like pre- or pro-biotics)

2)      Furthermore, ANDI is fundamentally flawed in its application to foods whose value is based at least partially on the actual calories themselves.

  1. Fuhrman uses the ANDI score on fats, which score dismally low because they contain few “nutrients” and a lot of calories.  Thus, industrially-modified, partially-hydrogenated trans fat-rich soybean oil has the same ANDI score as olive oil.
  2. Animal proteins, including grass-fed beef, wild salmon, and pastured eggs, also score incredibly low.  These foods are far more healthful than many most others, essential for life (unlike kale, which is the highest-scoring ANDI food), and much of their value is contained in the quality of their calories.
    1. i.      the fatty acids in salmon are healthy in and of themselves; they don’t contain any nutrients per se; they ARE the nutrient.  But ANDI doesn’t take this into account; it views all fatty acids as empty calories, a grave mistake.
    2. ii.      the same goes for animal proteins.  Eggs, for example, are higher in protein quality than any other food on the ANDI scale yet they score quite low.  And getting a bio-equivalent amount of protein from lower quality plant proteins would require consuming many more calories.

The failure of ANDI to incorporate any measure of fat or protein quality is its demise; why it is unable to stand alone as an indicator of healthiness… a diet consisting exclusively of high ANDI foods is incompatible with life.  A protein deficiency would be vastly more severe than a low ANDI diet, and on a lighter note, the fish oil fatty acids would provide much greater benefits than a high ANDI diet.  These nutritional factors play too big a role in determining healthspan and quality of life to be ignored.

BUT, ANDI is nice in its simplicity, and it works very well for most plant-based foods.  E.g., spinach and cabbage have very high ANDI scores; rice, grains, and pasta have very low ANDI scores.

The diets of many cultures are based almost exclusively on low-ANDI foods.  This is largely because it is much easier to produce enough calories to feed a village than to produce enough nutrients.  Starvation is deadlier than dermatitis.  In the Western world, however, we are fighting a different battle: you need to eat a LOT of empty calories in order to get enough nutrients, but then you get fat.


calories proper


n = 1,570,808

the correlation between time spent watching TV and body weight may have nothing to do with the common thought that if kids aren’t watching TV, they’re out playing.  No, it turns out that kids who watch less TV eat healthier.  They sit around just as much … just not watching TV.  Is there something about mindless sitcoms and cartoons that make us want to eat junk food … or snack … wait a minute … subliminal commercial advertising?

Is any of this true?  probably not.  But if I were to test it, I’d like an intervention study with a couple randomized groups including: one whose TV commercials were strategically replaced with equally fun commercials that don’t promote snack foods; a group of kids who don’t watch TV; and maybe a group who doesn’t watch TV but is exposed to subliminal snack-promoting advertisements…   food for thought.

Changes in diet and lifestyle and long-term weight gain in women and men (Mozaffarian, Hao, Rimm, Willett, and Hu, 2011 NEJM)

This is one of the biggest and longest running prospective studies on diet and lifestyle behaviors.  That’s not to say it’s the best study; epidemiological, observational, and prospective studies are subject to a variety of crippling limitations; but this one is big.

It is a compilation of three big studies that I’ve blogged about in the past:

The Nurses’ Health Study (NHS, n=121,701, est. 1976)

The Nurses’ Health Study II (NHS II, n=116,686, est. 1989)

The Health Professionals Follow-up Study (HPFS, n=51,529, est. 1986)

All in all, a total of 1,570,808 person-years were analyzed (person-years: 16 people x 2 years = 32 person-years).  The biggest finding?  everybody gains weight, about 0.835 pounds per year.  It doesn’t sound like much but after 20 years it means you’re 15 pounds fatter.

The second biggest finding?  Drumroll please…

First, to set the mood: people don’t gain weight magically.  This study was unique in that there were multiple dietary assessments, performed over a very long period of time, in the same group of people.  And one way people gain weight is by eating more.  So these authors were able to see which foods, when increased in the diet, correlated with weight gain.

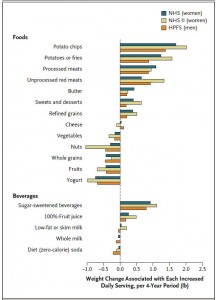
And the winner was, somewhat surprisingly, potatoes!  Actually number 1 was potato chips, and number 2 was potatoes and French fries or crisps.  The surprise, IMHO, was that soda and junk food was much further down the list.  Furthermore, I might have thought potato chips could be number 1 because of their high trans-fat content, but the presence of potatoes (which lack trans-fats) at number 2 means that trans-fats are not the obesogenic component of potato chips.

The figure (kudos for data presentation):

To quote the study [sic]: “Strong positive associations with weight change were seen for starches, refined grains, and processed foods.”  WRT study design, such conclusions cannot be interpreted to mean: eating less “starches, refined grains, and processed foods” will prevent weight gain.  It means body weight was determined by changes in the amount of “starches, refined grains, and processed foods” were in the diet… if any of those foods were increased, body weight increased; and if any of those foods decreased, body weight decreased. (note: this study was not designed to determine causation).

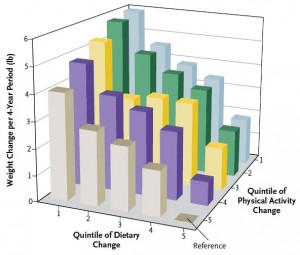
Exercise was also included in their analysis.  Another good-looking figure, albeit a little more complicated:

Think of the bottom left (front?) as the sum of good dietary changes (associated with weight loss [or less weight gain]).  People in the first “Quintile of Dietary Change” increased their consumption of “starches, refined grains, and processed foods” and gained the most weight, while those in the fifth quintile ate less and lost weight or stayed the same.  A similar trend for physical activity is displayed on the bottom right part of the figure.  People in the first quintile increased their physical activity, while those in the fifth quintile reduced their physical activity.  If you compare the amount of weight gain from the fifth to the first quintiles of dietary change (all the purple bars, for example), the amount of weight gained is highly dependent on diet.   However, within any given quintile of dietary change, not much weight is gained or lost by changing the amount of exercise (follow any set of bars from gray to purple to yellow to green to blue).  IOW, at any given quintile of physical activity change, diet predicts much larger changes in body weight.  Heck, people in the second quintile of dietary change actually gained weight by increasing physical activity … that’s a bit convoluted, but it demonstrates the case that in this enormous data set, diet was a better predictor of weight gain than physical activity (which in some cases didn’t matter at all).

Eat less and move more?

Calories proper


Trans fats, take III

Man vs. ape     Or
Postmenopausal women vs. Africa green monkeys


Two good and potentially somewhat contradicting studies on our good old friends, trans fats.

Trans fat diet induces abdominal obesity and changes in insulin sensitivity in monkeys. (Kavanagh et al., 2007 Obesity)

In this study, Kavanaugh and colleagues fed either a control diet or one fortified with trans fatty acids to a group of African green monkeys for 6 years.  Two immediate strengths of this study are 1) the use of primates, who respond to dietary intervention much more similarly to humans than rodents, and 2) the duration is long enough to model what would be seen in a human population.  Furthermore, to prevent differences in food intake from affecting the outcome, all of the animals were fed 70 kcal/kg of their initial body weight.  This feeding regimen was chosen specifically to prevent an energy imbalance, i.e., the monkeys were to be “weight stable” for the entire study.  This method is superior to pair feeding, where one group is fed ad libitum and the other group is given the same amount of calories as the first group, but instead of grazing all day (normal behavior) they get it all in one sitting.  Pair feeding is stressful for the animals and causes a whole host of other problems.  Both groups in this study received exactly the same amount of food (70 kcal/kg of initial body weight) every day for 6 years.

At the beginning of the study, the monkeys weighed ~6.5 kg (14.3 pounds); thus, for the rest of the study they were fed 455 kilocalories every day.  The diet consisted of 35% fat, 17% protein, and 48% carbohydrates.

The diet for half of the monkeys was supplemented with 8%, or ~4 grams, of trans fatty acids.  The average intake for humans is 3%, or ~7 grams per day.  An intake level of 8% for humans is around 18 grams, which could be accomplished by eating fast food or microwave popcorn a few times per week.  So besides being informative and shedding a new light on energy balance, this study is also of practical relevance.

Furthermore, the trans fat they chose was similar to the most abundant trans fat found in human diets (processed foods): partially hydrogenated soybean oil.

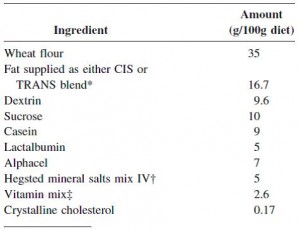
The diet:


TRANS refers to trans fatty acids, and CIS is the opposite of trans.  Cis fatty acids are the form of most natural fatty acids.  People don’t usually call regular fatty acids “cis” because it is assumed; this is how most unsaturated fatty acids are found in nature.

To the data.


divide and conquer.


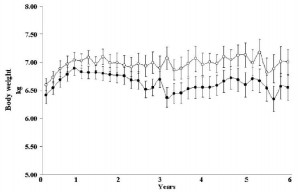
Body weight was roughly similar in CIS (closed circles) and TRANS (open circles) but started to diverge toward the end of the study.

The control group (CIS) weighed 6.41 kg at baseline and 6.55 kg at follow-up, an increase of less than 2%.  This was expected because at baseline, 70 kcal/kg per day was precisely enough food to keep them weight stable, so essentially nothing changed in these monkeys.  More specifically, since food intake and body weight didn’t change, we can say that there were probably no major perturbations in energy balance in this group.


TRANS, on the other hand, gained almost 3 times more weight despite eating exactly the same amount of food as the control group, which was exactly the same amount of food they were eating when they were weight stable at baseline.  Energy balance was clearly perturbed by trans fats.

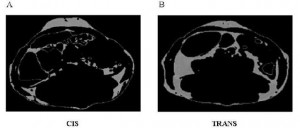
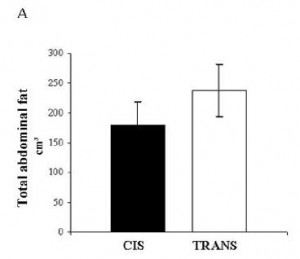
As seen below, the excess weight in the TRANS group was primarily in the form of increased visceral fat:


An abdominal CT scan.  The lighter areas represent fat tissue.  Both pictures depict roughly similar amounts of fat in the outer region (subcutaneous fat), whereas the TRANS group had significantly more fat tissue within the viscera.

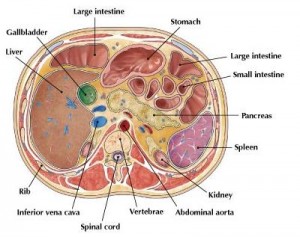
For reference:


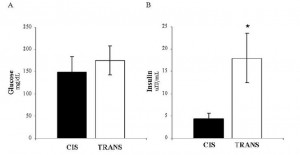
In all, TRANS had 27% more fat mass.  Fasting glucose and insulin levels were unchanged but postprandial insulin levels were markedly elevated in TRANS (see below), suggesting that dietary trans fats indeed caused insulin resistance.  I boldly use the term “caused” because this was a fairly well-controlled intervention study; the only thing different between the groups was the diet.


The TRANS group gained a significant amount of fat mass despite an absence of excess calories.  This was most likely caused by the trans fat-induced insulin resistance and subsequent postprandial hyperinsulinemia.

It would appear as though trans fatty acids defied the laws of energy balance.  The TRANS group gained fat mass despite an absence of excess calories.  Even the most practical explanation bodes poorly for trans fatty acids… it would appear as though trans fats were capable of inducing nutrient anti-partitioning independent of food intake.

I can see two ways to interpret these data.

  1. Trans fatty acids have an independent effect on energy balance.  That is, they specifically reduce energy expenditure, which would make the initial 70 kcal/kg*day excessive.  This would account for the excess fat mass, compared to controls, but not necessarily the increased body weight.  455 kilocalories (70kcal/kg*d) should be sufficient to support a specific amount of body weight; it is difficult to imagine a scenario whereby muscle mass declined enough to significantly reduce metabolic rate to the point where 455 kilocalories was so excessive that fat mass increased significantly more than the amount of muscle lost.  IOW, if this possibility were true, I would have expected, at most, a similar body weight but more fat and less muscle, not simply way more fat.

Of course, these processes would occur simultaneously and discreetly in vivo, but for simplicity’s sake I’ve broken it down.

6.6 kg monkey, x 70 kcal/kg*d = 462 kcal/d

Loses 0.022 kilograms of muscle, new body weight = 6.578 kg… since FFM is reduced, BMR should be reduced.  It was a 0.33% loss of body weight which was entirely from muscle (in this theoretical example), so perhaps BMR declines proportionately 460.46 kcal/d (? there are more accurate formulas in the literature, but this approximation is sufficient for our purpose)

all of those excess calories formerly burned in the lost muscle are now available for storage in fat.

462 – 460.46 = 1.54 excess kcal/day.  1.54 excess kcal every day for 6 years = 3,372.6  total excess kcal, which translates to ~0.438 kg fat mass.

0.438 kg new fat mass – 0.022 kg muscle lost = 0.416 kg overall weight gain.

6.6 kg + 0.416 = 7.016 kg.  Actual final body weight was 7 kg.  Pretty darn close.

Wow, can the loss of less than one ounce of muscle really cause such a drastic change in fatness?!? I don’t know for sure, but exchanging the microwave popcorn for a little resistance exercise seems prudent.

(in case you were wondering, no. I didn’t guess 22 grams. I did a ton calculations to quantify the metabolic rate reduction necessary to cause an energy surplus big enough to lay down enough fat mass to compensate for the reduction in muscle [which theoretically declined in proportion to the reduction in metabolic rate] and end up as close to 7 kg as possible… it could be calculated exactly but this has taken up 30 minutes already, and I think the point has been made)

2. Alternatively:  Energy expenditure varies day-to-day, hour-to-hour, second-to-second.  When we eat, we are transiently in positive energy balance, which reverses after a few hours, especially at night when a negative energy balance ensues and the fuel stored during the positive energy balance is utilized.  During those stints of positive energy balance, some of the excess energy is stored as fat tissue, while the rest is used to fuel the body.  Somehow, trans fatty acids shift the balance in favor of fat storage.

2a.  can there exist a positive energy balance selectively in adipose tissue?

2b. more likely, trans fatty acids reduce some component of energy expenditure, possibly basal metabolic rate, or perhaps the thermic effect of feeding.  Neither of these was measured, but I firmly believe energy balance was maintained.  It’s always maintained.

But the frightful conclusion remains the same: the TRANS group got fatter without eating more.  They didn’t eat more than they were supposed to but got fatter anyway.  Sad but true.

What about in humans?

Effect of trans-fatty acid intake on insulin sensitivity and intramuscular lipids-a randomized trial in overweight postmenopausal women. (Bendsen et al., 2011 Metabolism)

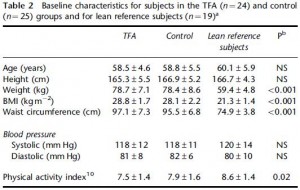
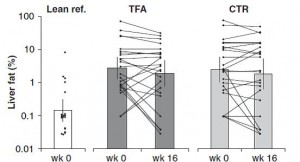
This study gave a group of 52 overweight but otherwise healthy postmenopausal women 16 grams of trans fatty acids in pumpkin muffins.  The control group received olive & palm oil-enriched pumpkin muffins.  In terms of the dosing, this study is almost directly comparable to Kavanaugh’s study.  However, this study only lasted 16 weeks (probably due to ethical reasons).  They also included a lean control group (for good measure?), baseline subject characteristics are below:


Nothing out of the ordinary.

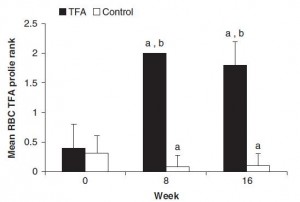
And the investigators measured compliance empirically.  You are what you eat.  When a specific type of fat is consumed, its constituent fatty acids accumulate in body tissues like adipose and red blood cells.  So the researchers measured red blood cell trans fatty acid content.  Kudos!  (biomarkers are superior to almost any other measurement of compliance to a dietary intervention in humans)


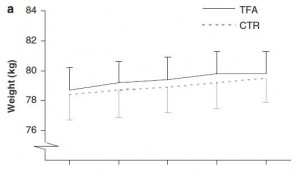
Indeed, the women ate their muffins.  But no effect on body weight!


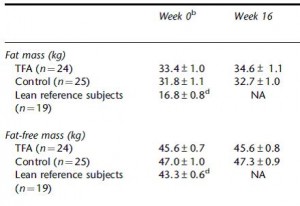
Body weight increased by about 2% in both groups.  If you want to get nit-picky, then we can make a few verrry long stretches concerning the body composition data:


The increase in fat mass was 33% greater in TFA compared to controls!  (fat mass increased by 3% in the control group and 4% in TFA).  The increase in percent body fat was twice as big in TFA compared to controls!  (body fat percent increased by 1% in the control group and 2% in TFA).  IOW, the changes in body composition were nil.  This does not necessarily refute Kavanaugh’s African green monkeys because that study lasted 6 years; the insignificant changes in fat mass in Bendsen’s women over the course of 16 weeks could very well add up to significant changes after 6 years.  Actually, if the endpoint was indeed a 6% weight gain after 6 years (like the monkeys) (78.7 * 1.06 = 83.422 -78.7 = 4.722 / 6 years = 2.156 grams per day x 16 weeks = 241 grams) we might have expected these women to gain less than they actually did (~ 241 grams in 16 weeks compared to 1,200 grams).  In truth, however, these numbers are well beneath what can actually be measured accurately even in a laboratory setting.  So it is bona fide nit-picking.

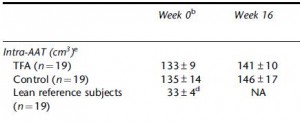
Maybe it’s time to throw in the towel and confess that trans fats are significantly worse for African green monkeys than for overweight but otherwise healthy postmenopausal women.  There was no change in visceral adipose between the groups:


Potential confounding?  I’m really grasping at straws… but here it goes anyway:


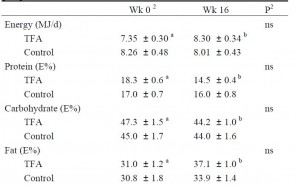
The TFA group reduced their carbohydrate consumption over the course of the study.  Carbohydrate consumption is directly correlated with liver fat accumulation.  But as per the trans fat study, trans fat consumption is inversely correlated with liver fat.  So we might expect trans fat-induced increase in liver fat to be cancelled out by the carb reduction-induced decrease in liver fat.  And this is exactly what happens!


Furthermore, liver fat didn’t change in the control group because 1) their carbohydrate intake didn’t decline, and 2) they weren’t eating a ton of trans fats.  IOW, neither of the major dietary determinants were altered.

So, according to these colorful explanations, trans fats may have been just as harmful to Bendsen’s women as they were to Kavanaugh’s monkeys.  The reason why the results differ can be at least partially explained by the inferior dietary intervention utilized by Bendsen.  IOW, Kavanaugh’s dietary intervention was perfect; the subjects (monkeys) ate their prescribed diet exactly, no cheating, no sneaking in any snacks.  The diet changed markedly in Bendsen’s study; all women gained weight meaning that the test foods were probably not isocalorically substituted for foods in their normal diet.  Perhaps they just ate the foods in addition to their normal foods (unlikely considering the marked changes in macronutrient consumption).

Some more data from Bendsen’s overweight but otherwise healthy postmenopausal women were reported in another paper, and hints of trans fat-induced insulin resistance were revealed…

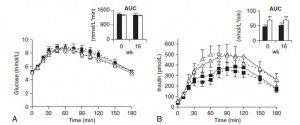
Here are the results from an oral glucose tolerance test:


Glucose:  Just like Kavanaugh’s monkeys, there was no change in the glycemic response to a glucose load.

On the right, insulin levels.


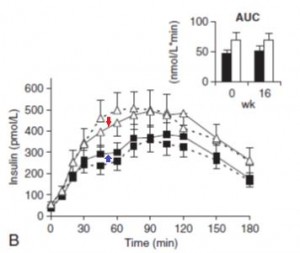
Insulin:  The open triangles are the control group, solid squares are the TFA group..  The dashed lines indicate insulin responses at baseline and the solid lines represent insulin responses at 16 weeks. In a randomized controlled intervention study, ALL changes in the intervention group must be compared not only to baseline measurements (pre-treatment), but more importantly they must be compared to the changes in the control group.  Over the 16 weeks, insulin response declined very slightly in the control group (see the little red arrow around the 45 minute mark).  However, insulin response increased slightly in the TFA group.  Take either of these changes individually and they would amount to nil.  But when you consider the change in control vs that in TFA, a modest trend appears.  The TFA group is beginning to show a hint of peripheral insulin resistance.  Maybe I’m seeing something where there is nothing, but the Kavanaugh’s study lasted 6 years and Bendsen’s study was only 16 weeks.  We must expect the changes to be ~20 times smaller in the Bendsen study.

OK, perhaps I got lost in the minutiae, or lost sight of the forest for the trees, but that doesn’t mean I’ll be eating microwave popcorn any time soon.  And on the bright side, creating this post was a great brain exercise

calories proper


Ketosis, III

Ketosis series, take III

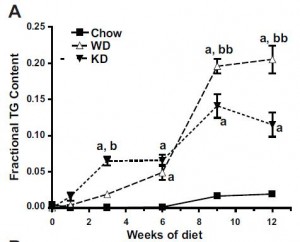
Hepatic steatosis, inflammation, and ER stress in mice maintained long-term on a very low-carbohydrate ketogenic diet (Garbow et al., 2011 AJP)

This study is similar to the one discussed in Ketosis series # 2, (A high-fat, ketogenic diet induces a unique metabolic state in mice [Kennedy et al., 2007 AJP]), both were 12 weeks long and used identical ketogenic diet.  However, the high fat/Western diets and body composition of mice on the ketogenic diet are different.

Nitpicking 101:  I don’t understand why researchers can’t select proper diets for these so-called “diet studies.”

KD, ketogenic diet; WD, Western diet

The macronutrient ratios are all over the place, but the worst part is that there is no attempt to control for the types of fat, protein, and carbs.  For example, the fats in the ketogenic diet are primarily lard and butter, while those in the Western diet are tallow and shortening… so basically the ketogenic diet is MUFA and PUFA while the Western diet is SFA and trans fat!  What exactly are we trying to compare, the effects of different dietary fats?  sacrebleu!

Divide and conquer

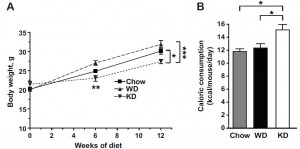
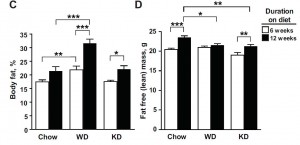
In accord with previous studies, mice on a ketogenic diet weigh less and eat more than those on chow or high fat diets.  Yada yada yada, just show this figure to the next person who promotes “eat less and move more” for weight loss.  (activity wasn’t measured in this study, but was here, which showed no change or even slightly reduced activity in mice on a ketogenic diet)


Divergences from Kennedy 2007: #1) body composition of KD mice in this study is identical chow;  lean mass in WD is less than chow and similar to KD.


WRT body fat, KD = chow < WD (HFD).  WRT lean mass, chow > WD = KD.

To refresh your memory, here are the data from Kennedy 2007:


The high fat diets are different, so a direct comparison is not possible.   But there is definitely a difference in how KD mice fared relative to chow, and the ketogenic diets were identical so a direct comparison is OK  (there were some other minor differences, like the age when the mice were started on the diet [6 wks vs. 8 wks]).  In Kennedy 2007, chow mice had the lowest body fat percentage, while in Garbow 2011 chow and KD are equivalent.  The differences are small, so it can slide (for now).  But FTR, since the ketogenic diets are identical, it would’ve been nice for Garbow to address some of these discrepancies in their discussion.

crackin’

From the body fat data above and food intake data below (which I extrapolated from diet composition and caloric intakes), it is clear that eating a lot of dietary fat won’t make you fat, even if it’s lard and butter.  KD mice ate 3x more fat than WD and almost 10x more than chow, but it didn’t cause them to get fat.  It’s only when sugar is added into the mix, as in the Western diet (40% carbs from sucrose & starch), when fat mass begins to accumulate.


Again, it’s surprising that KD mice ingested so much less protein yet maintained all of their muscle mass.  However the textbooks do say, explicitly, that nitrogen balance can be maintained when dietary protein is reduced if total caloric intake increases.  And that’s what happened (caloric intake increased), and maybe that explains the lean mass.  But it seems to me as if the increase in calorie intake (+20%?) was too much less than the reduction in protein intake (-75%) to completely account for the lean mass.  IOW, these data confirm that ketogenic diets are at least 50% magic.  I say that because the relationship between lean mass, protein, and calories is firmly adhered to by the other groups in this study.  I.e., chow mice ingested more protein than WD but the same amount of calories, and accordingly they had more muscle mass.

Moving on,

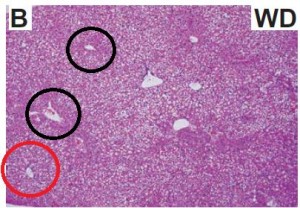
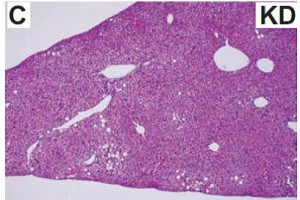
As expected, the ketogenic diet caused an increase in liver fat.  Not to worry, this is simply a product of the diet … KD = very low carbohydrate intake, so hepatic glycogen stores will be reduced; but the liver still needs energy and fat is in high abundance, so the liver accumulates fat instead.  It’s more physiological than pathological.


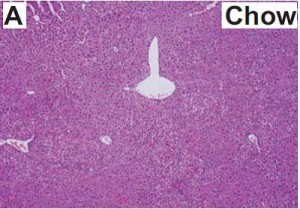
Normal liver:

Pathological fatty liver:

lots of fat around the portal vein (red circle), less fat around the central vein (black circles).

Physiological fat stores: sparse lipid droplets

From Kennedy 2007:


KD mice in both studies, and also in Jornayvaz et al. (2010 AJP), accumulated more fat in their livers than chow-fed mice, but the livers in Kennedy’s WD mice accumulated more fat than KD while the livers in Garbow’s HF mice accumulated less fat than KD …  and the high-fat diets were apparently similar in both groups:

Kennedy’s High fat diet (D12451)

Garbow’s Western diet (TD.96132)

Both diets were casein-based high fat diets, with carbs coming from sucrose and starch.  However, the fat source in D12451 is lard/soybean oil (7:1) while that in TD.96132 shortening/tallow (1:1).  Therefore, despite being fed a similar amount of fat, the WD mice in Garbow’s study were fed trans fat, which is surely worse for the liver than the lard that was fed to the HFD mice in Kennedy’s study.  This likely explains why the livers of Kennedy’s HFD mice were ~1.3x fattier than control while the livers of Garbow’s WD fed mice were ~10.3x fattier than control.

So, going back to the eternal complaint against most diet researchers: get a clue about what you’re feeding your mice or consult a nutritionist before wasting taxpayer’s money on bunk diet studies.

Alternatively, perhaps Kennedy was out to vilify the ketogenic diet.  If that were the case, then he would cunningly select a high-fat diet that produced a liver that was less fatty compared to the ketogenic diet.  This would certainly make the ketogenic diet appear worse than the horrid high-fat diet, which everyone already knows is bad :/

but that sounds like slander


calories proper


Fat cats or trans fat blog, take II

Fat cats
or
Trans fat blog, take II

Protein intake during weight loss influences the energy required for weight loss and maintenance in cats. (Vasconcellos et al., 2009 Journal of Nutrition)

I am flabbergasted at how this study played out.  Regardless of whether the eloquence was intentional or not; a wonderful demonstrate that “all calories are not created equal.”

Study design: They started with obese cats and fed them one of two weight loss diets.  The goal was to lose 20% of their body weight at a rate of 1% per day.  Therefore, they were given more or less calories to meet that goal.  The rate of weight loss was controlled.

The high protein diet contained 33% more protein than control (21.4 g/mJ vs. 28.4 g/mJ).  To balance out calories, the control diet had more starch.

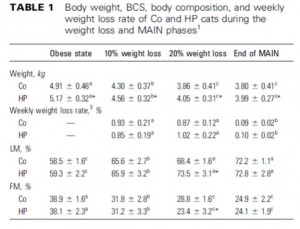
During the weight loss phase, both groups lost 20% of their initial body weight.  The high protein group lost almost 50% more fat than control!  Accordingly, the high protein group lost 64% less lean mass than control.  So only a 33% boost in protein during a hypocaloric diet caused drastic effects on body composition.

Body composition:

LM, lean mass; FM, fat mass.

The best part: remember, they were being fed on the basis of 1% weight loss per day.  The high protein group actually required 13% more food than control during the first half of their weight loss and 6% more during the second half.… in other words, if they were given the same amount of calories, the high protein group would have lost weight too quickly.  So the high protein group lost more fat and less muscle despite eating more!  Sounds like a pretty good deal, right?

Cats in the control group lost 1.65 grams of fat mass for every gram of lean mass lost.  Cats on the high protein diet lost 19.4 grams of fat for every gram of lean mass (over 10 times more).

Food intake data (ME = metabolizable energy, just think of it as calories):

It gets better.  Now all the cats are 20% reduced body weight.  Recall that muscle is the main driver of metabolic rate…

During the next phase of the study, the cats were fed enough to keep them weight stable for 4 months.  Because of their high protein diet, cats in that group finished the weight loss phase with more muscle and less fat than control.  During the maintenance phase, they were all fed the same diet, therefore any differences between groups during maintenance was due to the changes that occurred during weight loss (because diets are the same now).  Cats that lost weight via high protein diet required ~16% more calories per day to maintain their weight compared to cats that lost weight on the control diet.  So they got to eat more during weight loss, ended up with less fat mass, more muscle mass, and now have to eat more to maintain their new weight! (presumably because of their increased muscle mass).

This study was in cats, a carnivorous species, so there may have been a species-nutrient interaction; however, these findings while more robust are in agreement with what is seen in humans.  High protein dieters fare better in the short and long-term than low calorie dieters.

I think this study brilliantly illustrates that a calorie is not a calorie.  Dietary protein and carbohydrate may provide 4 kilocalories per gram when burned in a bomb calorimeter, but they are not equally fattening.

That’s about all for the coolness of energy balance in this cat study, but there is one other relevant topic with implications for human body composition.  Cats are carnivores and  experience a greater insulin response to protein than to carbohydrates…

Comparison of three commercially available prescription diet regimens on short-term post-prandial serum glucose and insulin concentrations in healthy cats. (Mori et al., 2009)

This study design was not nearly as eloquent as Vasconcellos’ (above).  They basically wanted to measure the insulin and glucose response to three different meals.  So it was a triple crossover (each cat tested each meal with a one week washout in between).  They were healthy cats.

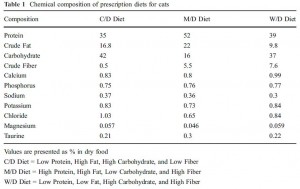
The meals were:

  1. (C/D) Low protein, high fat, high carbs, low fiber
  2. (M/D) High protein, high fat, low carbs, high fiber
  3. (W/D) Low protein, low fat, high carbs, high fiber

Diet 1 was a relatively standard control diet.  Diet 2 was Atkins-esque and is used to treat feline obesity and related disorders.  Diet 3 was another generic therapeutic diet.

Protein:  2 > 3 ? 1

Fat: 2 > 1 > 3

Carbs:  1 ? 3 > 2

C/D = diet 1 (control)

M/D = diet 2 (Atkins, usually in red)

W/D = diet 3

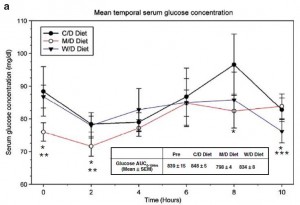
Glucose responses were relatively similar:

Diet 3 (W/D, inverted triangles) had modestly a greater glucose response, while diet 2 (M/D, Atkins diet, open circles) had the lowest.  This isn’t entirely surprising because diet 2 had the least carbs, while diet 1 had the most.

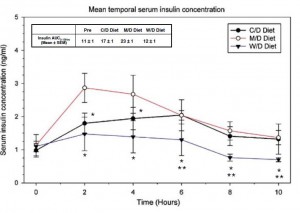
Here’s the interesting part:

Diet 2 (M/D, Atkins, open circles) had the largest insulin response despite the least carbs!   Diets 1 (C/D) & 3 (W/D) had the most carbs, but Diet 2 (M/D, Atkins, open circles) had the most protein.


This is almost exactly in line with what was seen in Vasconcellos’ study (above):

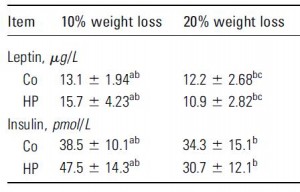
The average insulin levels over the entire weight loss period was 36.5 pM in the control group and 39.1 pM in the high protein group.

These studies were performed in cats, who evolutionarily and genetically differ markedly from humans.  Their status as true carnivores makes it difficult to extrapolate the results to humans.  But there is a large group of scientists, journalists, and bloggers, etc. who implicate insulin per se as the cause of obesity.  In cats, a high carbohydrate diet (standard store-bought dry food) causes obesity, and a high protein diet is an effective treatment.  Furthermore, a high protein diet causes just as favorable changes in body composition in cats as it does in humans.  But the high protein diet is markedly more insulinogenic in cats.  There are a few possible alternatives explanation of which I can think.

1-It might be the carbohydrates and not necessarily the insulin… that possibility agrees with the observations in both species… in humans, we know that a carb-rich diet is associated with obesity and we think it is due to insulin’s role in fat storage… in cats, we know that a carb-rich diet is associated with obesity but as seen in these two studies, it is probably not due to insulin.

2-Alternatively, maybe insulin is obesogenic only when accompanied by high carbs.  That would explain why insulin is obesogenic in humans (whose high insulin levels are associated with a high carb diet) but not cats (whose high insulin levels are associated with a high protein diet)… but this wouldn’t explain why type I diabetics are usually thin but get fat deposits around their insulin injection sites (which suggests that insulin directly promotes fat storage and doesn’t need carbs).  However, type I diabetics are frequently hyperphagic, so maybe the high carbs are present.

Aargh, a clear conclusion can’t be drawn to tie together all of the observations, but option 2 comes close.  N.B. I personally believe other dietary factors like processed foods, industrially produced trans fats, high fructose corn syrup, and grains probably have a big role in insulin resistance, which is associated with obesity, but I’d still like to see a clean cut demonstration of this across all species, or at least mammals, or at least in primates.


Calories proper


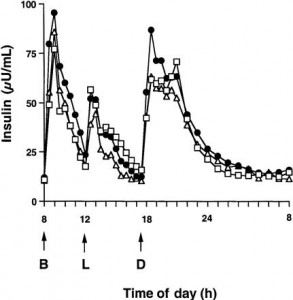
OK, so maybe protein is just as insulinogenic as carbs in humans too:

A high-protein diet induces sustained reductions in appetite, ad libitum caloric intake, and body weight despite compensatory changes in diurnal plasma leptin and ghrelin concentrations (Weigle et al., 2005 AJCN)

open squares, controls; closed circles, isocaloric high protein, open triangles, ad lib high protein


One more wrench in the gears!

This last one is a total doozy.  I feel double-crossed.  never saw it coming.  To the best of my knowledge, industrial trans fats have never failed to maim those who ingest them.  until now.


Effect of trans-fat, fructose and monosodium glutamate feeding on feline weight gain, adiposity, insulin sensitivity, adipokine and lipid profile. (Collison et al., 2011 British Journal of Nutrition)

This study was “different;” they fed pregnant/lactating cats one of four diets and then weaned the kittens onto the same diet as their mother.  In brief, the diets were:

Control: standard low fat diet

A) Control + MSG (~200mg/kg)

B) High trans fat & fructose

C) High trans fat & fructose + MSG


The diets are kind of sketchy, so here are some generalities: we can compare diet A to control and diet C to diet B to see the effects of MSG, and we can compare diet B to control and diet C to diet A to see the effects of high trans fat & fructose.

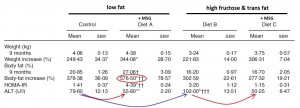
The whole story can be summed up in the following table (which has been heavily edited):

First, please note the red circle.  Body-fat increased 378.38% in control kitties and 576.50% in those fed MSG!!!  MSG is the devil for cats (?).  Interestingly, MSG had no effect on cats fed a high fructose and trans fat diet (302.59% vs. 277.32%)… (??) actually, all cats fed a high fructose & trans fat diet accumulated less fat mass than low fat fed cats.  (???)  This is in agreement with the findings above; cats become obese on a low fat high carb diet and remain lean and muscular on high fat high protein.  I’m surprised the fructose had no effect.  I’m also a little surprised that MSG was far worse than high fructose & trans fat.

Second, please note the arrows.  The red arrows show the effect of MSG on liver enzymes.  In both low fat and high fructose & trans fats, the addition of MSG markedly improved the liver enzyme ALT. The blue arrow shows that high fructose & trans fat is bad for the liver, in agreement with human and rodent data, but this is completely ameliorated by the addition of MSG [in cats] (????).

I have no idea how to interpret these findings from a biological standpoint, but I think it might have something to do with cats being true carnivores.  Cats need meat to live.  MSG is a meat-mimetic; that is, it tastes savory, better than meat, but does not provide any of the nutrients.  I don’t know how MSG would enhance fat gain but improve liver enzymes in cats on a low fat diet, but I think cats on a low fat diet is another problem because a carnivorous diet is not low fat.  And most troubling, trans fats aren’t bad for cats!  Maybe since cats generally eat a relatively high fat diet, the addition of a few grams of trans fats are well tolerated (because they comprise a small fraction of the total fat intake).  Trans fats were shown to be harmful in rodents & rhesus monkeys, two species who consume a low fat diet in their natural habitats.  Since humans are omnivores, does this mean that trans fats are worse for monkeys & rodents than they are for us?  IOW, does extrapolating the results from rodent studies to humans inevitably exaggerate the harm of trans fat?  Food for thought.


calories proper