Category Archives: Protein

Diet, diabetes, and death (oh my)

Fatty acid face off: saturation vs. chain length
or
an homage to pioneers of nutrition research

While both fats contain a lot of 8-12 carbon fatty acids (C8-C12), coconut oil contains more of the 12-carbon fatty acid “lauric acid” whereas medium-chain triacylglycerols (MCT) have more of the 10-carbon fatty acid “capric acid.”  Both exhibit remarkably protective effects against diabetes and this has been known for quite a while.  Coconut and MCT oils are also phenomenally ketogenic, which contributes to their healthful effects (although this eluded early researchers).

Experimental diabetes and diet (Houssay and Martinez 1947 Science)

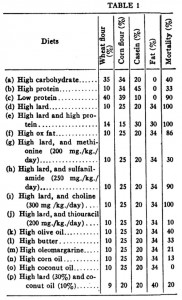
This study used alloxan to deplete insulin-producing beta-cells rendering these rats essentially type I diabetic.  In the first experiment, they injected alloxan and counted how many rats were still alive after one week.  This study is cruel by today’s standards, but things were different in 1947.  It does, however, provide valuable information as the rats were also being fed one of 16 (16!) different diets.  The major finding was that all the rats fed lard died (d, e, and i in the table below), while all those fed coconut oil survived (o in the table).  And additional coconut oil, methionine, or thiouracil, but not protein, sulfanilamide, or choline reduced the deadliness of lard.  Both lard and coconut oil contain saturated fat, but lard has longer chain fatty acids and more unsaturated fat than coconut oil suggesting fatty acid chain length and/or degree of unsaturation may be important.
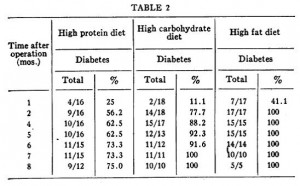
In the follow-up experiment, rats were rendered diabetic by surgical removal of 95% of their pancreas and fed high carb, high protein, or high lard diets (a, b, and d from the table above).  In agreement with the first experiment, lard is bad news.  On the other hand, whereas a high protein diet wasn’t helpful for alloxan diabetes, it was remarkably protective in pancreatic diabetes. 
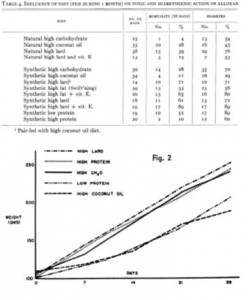
Influence of diet on incidence of alloxan diabetes (Rodriguez and Krehl 1952)

These researchers measured mortality and diabetes incidence in alloxan-treated rats and found that: 1) coconut oil is protective against mortality and diabetes; 2) lard is not; and 3) high protein is modestly protective.  IOW, these data confirm Houssay’s from 5 years earlier.These authors added some information to the picture by measuring body weight and showing that the protective effect of coconut oil is not due to reduced body weight, because these coconut oil-fed rats weighed as much as those fed a low protein diet, and low protein diet-fed rats fared rather poorly.
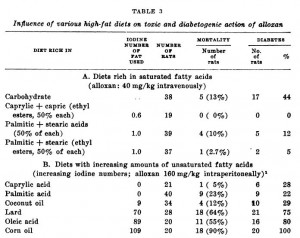
To add yet more information to the picture (kudos!), they fed rats diets containing the most abundant fatty acids found in coconut oil (caprylic acid) or lard (palmitic acid) and showed that coconut oil’s benefits may be due to caprylic acid because this fatty acid alone was similarly protective against mortality and diabetes.  They also showed lard’s malevolence is not due to palmitic acid because these rats were almost just as protected as those fed caprylic acid.  This somewhat excludes a role of fatty acid length as caprylic acid has 8 carbons while palmitic acid has 16, but both are fully saturated (suggesting a possible detrimental role for unsaturated fatty acids [?]).

So why is coconut oil so good?

One possible reason:  saturated fatty acids are protective, which is supported by the beneficial effect of coconut oil, caprylic acid, and palmitic acid.  Similarly, lard and Swift’ning have a lot of unsaturated fats and both were detrimental.

Unsaturated fatty acids and alloxan diabetes (Rodriguez et al., 1953 Journal of Nutrition)

Rats fed saturated fats of varying chain length were remarkably more protected than those fed unsaturated fats.  Lard has a lot of oleic acid, and rats fed oleic acid didn’t do so well; corn oil is predominantly unsaturated fat and rats fed corn oil were phenomenally unhealthy.  They also showed that rats fed stearic acid (18-carbons, fully saturated) were much healthier than those fed oleic acid (18-carbons, monounsaturated). While none of these studies explored the ketogenic effects of C8-12 fatty acids, they clearly demonstrated that saturated fatty acids of any chain length are good for diabetics, while unsaturated fatty acids are bad.  Good sources for C8-10 fatty acids are MCT oil and goat’s milk, and a good source for C12 fatty acids is coconut oil.
As to the role of ketones, which I think is quite important… to be continued

calories proper


Insulin per se

This recent manuscript nearly slid beneath the radar… almost stopped reading at the abstract until the word “nifedipine” appeared (among its widely pleiotropic effects, nifedipine also lowers insulin).

The series of experiments described below demonstrate one aspect of the scientific method reasonably well.  None of the individual experiments, when viewed in isolation, really prove the hypothesis.  But the researchers tested it with a variety of widely different methods and all of the results went in the same direction.  The hypothesis in question: insulin causes fat gain, and hyperinsulinemia per se, not macronutrients or calories, is the root cause.

This group has previously shown that sucrose is more detrimental than fish oil is beneficial toward obesity and glycemic control.

High glycemic index carbohydrates abrogate the anti-obesity effect of fish oil in mice (Hao et al., 2012 AJP)

Divide and conquer
Mouse study.  Lots of diets, in brief:
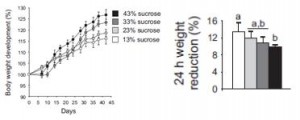
Pair fed: high fish oil (180 g/kg) plus 13%, 23%, 33%, and 43% sucrose (by weight, switched out for casein [a poor choice IMO])
High fish oil (180 g/kg) plus sucrose, fructose, glucose, low GI carbs, and high GI carbs.
That’s a lot of diets.  Kudos.

As expected, higher sugar and lower protein intakes enhance weight gain (yes, even when pair-fed similar calories [i.e., a calorie is not a calorie]) and this is at least partly due to reduced metabolic rate (as per the poor man’s energy expenditure test- measuring body weight before and after 24 hours starvation [higher weight loss = higher metabolic rate]):High sucrose-fed mice also had more inflamed adipose tissue and less thermogenic brown fat, which likely contributed to their glycemic dysregulation and elevated adiposity.

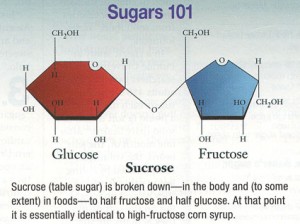
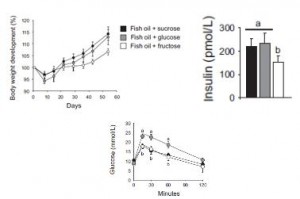
Sucrose is comprised of glucose and fructose, so to determine which component was causing obesity, they fed mice high fish oil diets plus either sucrose, glucose, or fructose.  Interestingly, the glucose group gained as much weight as the sucrose group.  Since the fructose group gained the least amount of weight, the researchers attributed the sucrose-induced obesity to insulin! (fructose doesn’t elicit an insulin response; and insulin levels were lowest in the fructose group).

Body weight, plasma insulin, and glucose tolerance:

I. Thus far: glucose and sucrose cause obesity by stimulating insulin secretion.  Glycemic deterioration is worst in the glucose-fed group because they were consuming most of the most insulinogenic sugar: glucose.  It was lower in the sucrose and fructose groups because sucrose contains only half as much glucose as pure glucose, and fructose contains no glucose.  IOW, these data suggest hyperinsulinemia per se causes obesity and insulin resistance.  Gravitas.

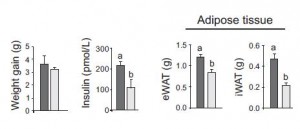
They further tested this by comparing high and low GI diets which cause higher and lower insulin levels, respectively.  As expected, the low GI diet led to less weight gain, and significantly lower insulin levels and adipose tissue accumulation compared to the high GI diet:

II. Thus far: high insulin levels, whether induced by glucose, sucrose, or high GI starch, lead to obesity.

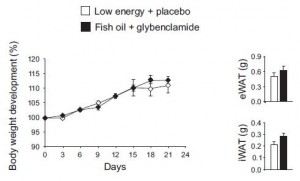
They next took a non-dietary approach by artificially increasing insulin levels with glybenclamide in fish oil-fed mice to see if hyperinsulinemia could still cause obesity.  The results weren’t robust, but the higher insulin levels tended to increase adiposity even in mice fed the anti-obesogenic fish oil diet. 

In the experiment, the opposite approach was taken: nifedipine was used to lower insulin.  The use of octreotide and diazoxide has been used in a similar context with similar results in humans, discussed HERE and HERE.Again, the results were not robust, but when viewed collectively a picture begins to emerge: raising insulin levels, whether it is with a high glucose or sucrose diet, a high GI diet, or glybenclamide increases adipose tissue growth; and conversely, lowering insulin levels, whether it is with a less insulinogenic sugar diet (fructose), a low GI diet, or nifedipine decreases adipose tissue growth.  Oh yeah, and low carb works too.


calories proper


the metabolic orchestra

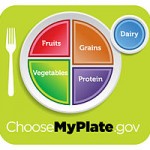
What’s on YOUR plate?

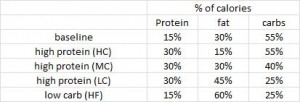
whenever something goes up, something else goes down.  e.g., compare the fat and carbs in the three 30% protein diets:

It is virtually impossible to study macronutrients in isolation, but by looking collectively at a wide range of diet intervention trials, we can get some insight into the metabolic program orchestrated by fat, protein, and carbohydrates.

the “bar:” if we are to conclude that increasing nutrient “A” causes effect #1, then it must be true if the calories are compensated by 1) lowering nutrient “B” while leaving nutrient “C” unchanged, and 2) lowering “C” while keeping “B” unchanged.  And it doesn’t count if this is accomplished indirectly by abstract statistics.

Divide and conquer

Comparison of high-fat and high-protein diets with a high-carbohydrate diet in insulin-resistant obese women (McAuley et al., 2005 Diabetologia)  

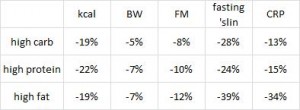
To make a very long story very short, here’s what happened after 24 weeks:

Abbreviations I: kcal, food intake in calories; BW, body weight; FFM, fat-free mass (muscle); FM, fat mass; ‘slin, insulin; CRP, C-reactive protein

Abbreviations II: HC, high carb; HP, high protein; HF, high fat

Abbreviations III: LC, low carb; LP, low protein; LF, low fat

Despite similar calorie reductions, HF lost more BW and FM than HC (HP was intermediate).  Fasting insulin was reduced most in HF and this group lost the most fat.  Anyone as surprised as me about the dramatic reduction in CRP in the HF group?  (+2 for HF)  Fasting insulin was reduced the least by HP but HP lost more fat than the HC.  You might think this undermines the insulin-fat theory, but alas, draw your attention to the kcal’s.  Perhaps the bigger reduction in calories in HP helped them shed a little more fat than HC despite a lower reduction in insulin. Furthermore, HF lowered insulin more and they lost more fat but had the same caloric deficit as HC.

But does it meet the “bar?” IOW, are these results due to the abundance of dietary fat or the lack of carbs?

Alternatively, is HC inferior because of the low fat content or the high carb content?  To address this, we need to compare two diets with similar fat but different carbs.

Effect of an energy-restricted, high-protein, low-fat diet relative to a conventional high-carbohydrate, low-fat diet on weight loss, body composition, nutritional status, and markers of cardiovascular health in obese women (Noakes et al., 2005 AJCN)

This study was half as long (12 weeks vs. 24 weeks), but compensated by a more robust calorie deficit 

Both groups were supposed to undergo an identical degree of calorie restriction, but HP lost slightly more weight despite eating slightly more food than HC.  HP also lost more fat and their insulin was more suppressed.  And importantly, HP lost less muscle than HC.  (and wow, check out those CRP data [+2 for HP]).  This was all confirmed in a much larger year-long study comparing two 30% fat diets, HP vs. HC, with nearly identical results (Due et al., 2004 International Journal of Obesity)

Summary thus far:

McAuley (first study; three moderate protein diets: fat vs. carb)
high fat is superior to high carb     or     low carb is superior to low fat

Noakes (second study; two low fat diets: protein vs. carb)
high protein is superior to high carb     or     low carb is superior to low protein

To bring this around full circle: both HF and HP independently beat HC, so what do you think would happen in a face-off between HF and HP?

Carbohydrate-restricted diets high in either monounsaturated fat or protein are equally effective at promoting fat loss and improving blood lipids (Luscombe-Marsh et al., 2005 AJCN)  

This study was of intermediate duration (16 weeks) but had the greatest weight loss:

HF vs. HP?  It’s a tie!!  Insulin was reduced more by HP and fat mass declined ever so slightly more in this group, but the difference was very small.  When the data were broken down by genders, women did retain more muscle on HP but again, the difference was small.

Luscombe-Marsh (third study; two low carb diets: protein vs. fat)
high protein is equal to high fat     or     low protein is probably just as bad as low fat

So if anyone tries to quiz you about diets and weight loss, like the way my colleagues relentlessly do to me whenever a new diet study is published, armed with this knowledge you should be able to guess the outcome (probably)…

I know what you’re thinking… what if they try to trick me, like comparing the effects of HP to high fiber??  Fiber is supposed to be good for you, green leafy vegetables and all, right?

Just stick to the data outlined above.

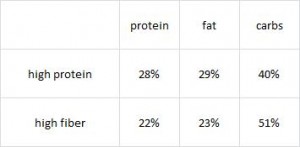
Comparison of high protein and high fiber weight-loss diets in women with risk factors for the metabolic syndrome: a randomized trial (Morenga et al., 2011 Nutrition Journal)  

With the exception that the high fiber group was getting 39 grams of fiber per day while HP was only getting 24 grams.

This was the shortest study (8 weeks) and accordingly weight loss was the least.

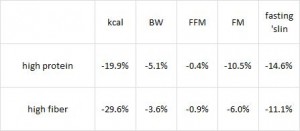
Victory!  despite a significantly lower reduction in calorie intake, HP lost more weight than high fiber.  HP also lost less muscle, more fat, and insulin declined to a greater degree.

Morenga (fourth study, two mixed diets: protein vs. fiber)
higher protein, higher fat, and lower carbs are superior to high fiber

just don’t gamble with this information


calories proper
Holiday feasts, the freshman 15, and damage control

Holiday feasts, the freshman 15, and damage control, Op. 54

overeating ANYthing is a bad idea.  But as demonstrated in this recent study, WHAT you overeat has a big effect on how your body responds.  The overfeeding protocol studied was pretty intense, ~1000 excess kilocalories per day for 8 weeks.

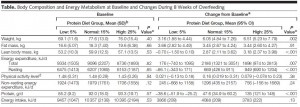
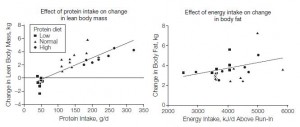
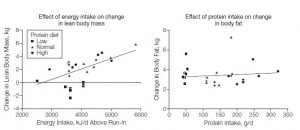
Effect of dietary protein content on weight gain, energy expenditure, and body composition during overeating (Bray et al., 2011 JAMA) Healthy people where fed hypercaloric low, medium, or high protein diets.  It’s impossible to isocalorically change one macronutrient without inadvertently changing the others.  With regard to study design, this is always a tough decision, and in this study they exchanged protein for fat:

Divide and conquer

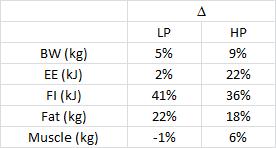
As seen in the monster-table above or simplified table below, the high protein group gained the most weight despite eating no more than the other groups; but this weight was comprised of significantly more lean body mass than in any other group. 

High protein dieters also expended more energy but still gained more weight!  Importantly, however, much of that weight was muscle.  The increase in energy expenditure is likely due to dietary protein-specific effects: 1) high metabolic cost of increased protein turnover, 2) elevated metabolic rate associated with more muscle, and 3) increased diet-induced thermogenesis.  The low protein group, on the other hand, lost muscle and gained more fat than any other group.

an aside: the energy expenditure measurements taken during overfeeding should be taken with a grain of salt, shot of tequila, and suck of a lemon because the accuracy of such measurements usually require weight-stable conditions; overfed subjects were gaining weight and in positive energy balance.  In other words, the assumptions required for doubly-labeled water to assess energy expenditure during weight-stable conditions are likely not met during weight gain (which is further complicated by the fact that the different groups were gaining different types of body weight [fat vs. fat-free mass]).  But the body composition data are probably OK (see below).

Furthermore, while it may seem like the Laws of Energy Balance were violated in this study, I assure you, they were not.  This study was not designed to test them, as evidenced by the author’s failure to conduct a comprehensive assessment of energy balance.

The high monetary cost of high protein foods (e.g., steak) is matched by the high energetic cost of their assimilation.  By increasing protein intake, energy expenditure rises in parallel.  This is most likely due to a combination of factors (mentioned above), and the result, at least in this study, is increased lean body mass.   The low protein diet, on the other hand, didn’t increase energy expenditure and resulted in more fat gain.  N.B. the absolute amount of protein consumed by the low protein group (47 grams) was too low to maintain muscle despite ingesting 40% more total calories.  In other words, the low protein dieters actually lost muscle mass while gaining fat!!

conclusions

1. THE media always screws up things (no thanks to Dr. Bray’s discussion).  The headlines should’ve read: “Dietary protein increases lean body mass more than total calories increase fat mass.”  That headline would’ve taken the focus away from the calorie debate by highlighting an important macronutrient effect.  This is important, IMHO, because body composition is a very important factor determining metabolic outcomes and quality of life, and is often overlooked (e.g., BMI).

2. While excess calories are necessary to increase lean body mass, excess protein has little effect on fat mass.  “Excess protein has little effect on fat mass” would’ve been another great headline.  But it wasn’t.

Most of the excess energy consumed by the low protein dieters was stored as fat, while in the high protein dieters it was invested in muscle and burned off.  Although it’s a little too late to prevent holiday feast-induced weight gain (or the freshman 15 for that matter) these data suggest that whenever possible, filling up on the highest protein foods available will cause the least fat gain.  Increased dietary protein -> increased lean body mass –> increased metabolic rate (you burn more fat in your sleep!)

Dietary protein doesn’t require a prescription and is a potent nutrition partitioning agent.  But as mentioned above, WRT energy balance, this study was not perfect.  So, why do I believe the effects of dietary protein are true despite the methodological flaws in Dr. Bray’s assessment of energy balance?  Because they are consistent in a variety of conditions.  For example, the remarkable effects of a high protein diet on body composition prevail even during underfeeding (aka going on a diet), a completely opposite paradigm.

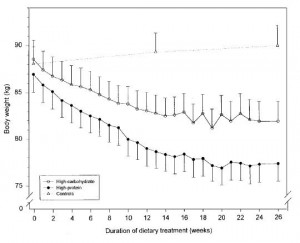
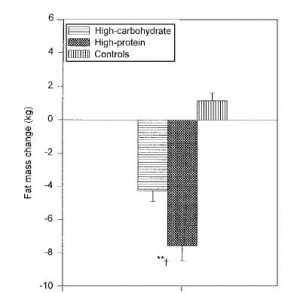
Skov and colleagues tested hypocaloric high vs. low protein diets for 26 weeks and confirmed that even during negative energy balance, dietary protein favors lean body mass at the expense of fat mass (Skov et al., 1999 International Journal of Obesity)

And similar results, albeit less robust due to the shorter duration, were found in a study by Layman and colleagues in as few as 10 weeks (Layman et al., 2003 Journal of Nutrition)

During overfeeding, high protein diets cause greater increases in lean body mass and energy expenditure, and prevent excess fat accumulation relative to low protein diets.  During underfeeding, high protein diets lead to a greater retention of lean body mass and more fat loss.  Nutrient partitioning 101. All calories are not created equal.

or


??


For the rest of this article and I promise it doesn’t suck ???? head over to Patreon! Five bucks a month for full access. It’s ad-free and you can cancel at any time.

If you’re interested in setting up consultations with me, reach out: drlagakos@gmail.com.

Affiliate links: Still looking for a pair of hot blue blockers? TrueDark is offering 10% off HERE and Spectra479 is offering 15% off HERE. If you have no idea what I’m talking about, read this then this.

 Join Binance and get some cryptoassets or download Honeyminer and get some Bitcoins for free

20% off some delish stocks and broths from Kettle and Fire HERE

If you want the benefits of  ‘shrooms but don’t like eating them, Real Mushrooms makes great extracts. 10% off with coupon code LAGAKOS. I recommend Lion’s Mane for the brain and Reishi for everything else

Join Earn.com with this link.

Start your OWN Patreon campaign!

calories proper

Empty calories V

The final horcrux!  Empty calories induce a feed-forward loop that promotes  over-consumption. … the following evidence is indirect, of course, but very compelling.

Food intake measured by an automated food-selection system: relationship to energy expenditure (Rising, Ravussin, et al., 1992 AJCN)

This study was designed to validate a new technique for measuring food intake; it had nothing at all to do with “empty calories.”

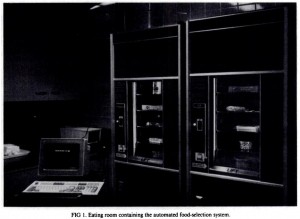
10 lean, healthy young men.  During a 4-day run-in period, the amount of calories required to maintain energy balance was measured with extreme precision.  Then for 7 whole days, they lived in a metabolic ward and dined from … wait for it … “vending machines.”


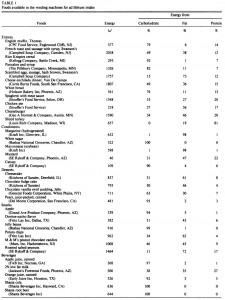
The vending machines were loaded with entrees, snacks, and beverages, [sic]: “familiar and preferred foods,” aka a “cafeteria diet.”  And I was delighted to see they also published the menu:


This study fit so perfectly because the Empty Calories series’ singular major thesis is: empty calories promote over-consumption.  And this can be tested by examining the two logical extremes: 1) a diet devoid of empty calories is inherently healthier, and any increase in the amount of empty calories consumed is accompanied with a decrease in health outcomes; and 2) eating more empty calories will not be balanced by eating less of something else, because empty calories are nutritionally bankrupt and do not affect satiety proper.  And this menu, oh yes, is almost entirely empty calories.

The researchers purposely filled the vending machine with individually packaged processed foods because of their convenience; it’s a very easy way to measure food intake, which was the focus of their study.

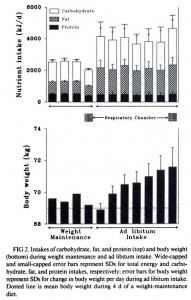
The following figure is absolutely nuts; you couldn’t make this stuff up.  like it was mathematically designed to support the Empty Calories credo.


It started immediately on day 1 of “ad libitum intake;” food intake doubled- the food was so nutrient poor that twice as many calories were necessary to satisfy their appetite.

Where did all those excess “empty calories” go?  Some (~17%) were spontaneously burned off (increased 24h EE) but most were invested in the infamous negative-yield* calorie savings banks (i.e., adipose).  [*you don’t get back more than you invested].


Side note: check the numbers, an overconsumption of 10975 kJ/d = 2622 kcal.  For 7 days = 18,353 kcal; which is approximately the amount of energy in 5.2 pounds (2.4 kg) of fat tissue.  They gained 2.3 kg, just a hair less than mathematically predicted (so much for spontaneously burning off 17% of the excess).  Body composition was not measured, but given the huge increase in carbohydrate intake, I imagine insulin levels were through the roof driving all of the excess energy into fat mass.

This has been confirmed numerous times.  For example, Larsen et al. (1995):


When fed the “cafeteria diet” from vending machines, these women almost doubled their food intake and gained a full pound of fat in under a week.  But I digresss.

“And this can be tested by examining the two logical extremes: 1) a diet devoid of empty calories is inherently healthier, and any increase in the amount of empty calories consumed is accompanied with a decrease in health outcomes; and 2) eating more empty calories will not be balanced by eating less of something else, because empty calories are nutritionally bankrupt and do not affect satiety proper.”

The second postulate has been addressed and sufficiently supported by Ravussin’s vending machine study (above).  Fortunately for us a study that addressed the first postulate was blogged on previously.


Remember now?

(Hashim and Van Itallie, circa 1965)


When fed a bland yet nutritionally complete diet, obese subjects spontaneously and drastically reduced their food intake, and body weight plummeted for EIGHT STRAIGHT MONTHS.  Although this was confirmed a decade later by Cabanac and Rabe (1976), it only indirectly supports the first postulate because it was not real food.  But it proves the point that nutrient sufficiency supports satiety, and this can be dissociated from total calorie intake.  IOW, if the diet provides the essential nutrition, then the remaining daily energy requirement can be met by burning excess fat mass stored in adipose tissue.

avoid ‘empty calories’ and cash out


calories proper


Empty calories IV

Welcome to the fourth installment, empty calories in everyday life

on feeling “full”

fullness can be manipulated by a variety of things, but never truly fooled.  Try drinking a fiber-rich beverage (e.g., Metamucil) right before mealtime and then eat slowly… you will feel full much sooner.  This may even cause you to eat less, but it won’t last … it’s not an effective long-term weight loss or weight maintenance strategy.  and it might even do harm… fiber makes you feel fuller faster by expanding (absorbs water) in your GI tract- it will stretch out your stomach a bit.  When you run out of it, or decide enough is enough, your stomach will feel emptier than usual, which will increase the amount of food necessary to make you feel “full.”

In the example above, that fiber drink would be considered to have a very low energy density.

on energy density

“Energy density” is bunk.  Ha!

But really, advising someone to consume a “low energy density” diet is wrong.  The rationale underlying “low energy density” diets is that fat, the macronutrient, contains 9 calories per gram, whereas carbohydrates only have 4, less than half.  Thus, there is >2x the amount of energy contained in a gram of fat than in a gram of carbs, i.e., fat is more energy dense.  However, when it comes to real food (food, not macronutrients), things change.  E.g., crackers are promoted as a healthy snack for low energy density dieters because crackers are very low fat (4% by weight) and thus low energy dense.  Red meat, on the other hand, has a high energy density (fat content 20-30% by weight)…  but wait, are those statistics referring to macronutrients … or food?

100 grams of crackers can have anywhere from 393 (Saltines) to 492 (Ritz) kilocalories, but 100 grams of red meat has 258 (Porterhouse) – 332 (ground beef) kcal.  Since things like water content vary widely among different foods, the energy density of macronutrients is not the same as that of the foods we actually eat.

on snacking

Think of a meat-eater you know.  Regardless of how much they love steak, they couldn’t eat it until they were sick.  But watch a little kid eating snacks, for example.  especially kids, who are more vulnerable than adults to obesogenic foods.

Most non-animal food sources (rice, pasta, beans, potatoes, etc.), including snacks, lack one or more nutrient or essential amino acid and are therefore considered nutritionally inadequate.  WRT to nutritional deficiencies: for practically every nutrient, the “at-risk for deficiency group” is almost always vegetarians (and/or alcoholics).

Snacks and plant-based foods are nutritionally incomplete; we might overeat them because of this.  Perhaps protein, EFA, & nutrient sufficiency is detected by the satiety systems in our brain.

It is difficult but not impossible to eat a nutritionally adequate vegetarian diet (sans industrial fortification), but it’s practically impossible to be nutritionally insufficient if a small variety animal foods are included in the diet (eggs, red meat, salmon, chicken, etc.)… low chance of success in the former vs. low chance of failure in the latter?

A can of Pringles has more calories than a dozen eggs (900 vs. 852 kcal).  But it’s virtually impossible to eat a dozen whole eggs, partially because that’s gross, but also possibly because just a few eggs provide more than enough nutrition to signal into the satiety system.  IOW, it’s much easier to overeat empty calories.

Snacks make people fat, in part, because they are designed to be tasty but provide little nutrition.  If snack foods provided adequate nutrition, they would satisfy our hunger and we’d eat [and buy] less.  The tasty flavors make us want and like them, and the lack of nutrition prevents us from becoming satiated.

Nutrient density FTW.


calories proper


Empty calories III

Empty calories.  Nutrient density.  Empty calories.  The ANDI score?

With the advent of the ANDI, it is safe to say the phrase, school of thought, and cult following to “a calorie is a calorie” is fading.  All calories were not created equal; some make you fat, others make you strong.  Cantankerous old biochemists and low-fat diet proponents will likely remain loyal, however, with the former citing heat production in a bomb calorimeter (mumbo), and the latter citing the equivalency of nutrient density and animal fat scarcity (jumbo).

But for the rest of us, there is gravitas in this concept       empty calories.

A good place to start might be a critical view of Fuhrman’s  Aggregate Nutrient Density Index (ANDI).  In brief, ANDI is an index of healthiness and is calculated by dividing the amount of nutrients in a given whole food by the calories.

Pro’s and con’s

1)      it only applies to whole foods.  This is convenient because most processed foods would score miserably low unless they’ve been industrially fortified with synthetic vitamin-like chemicals.  Perhaps Fuhrman restricted ANDI to whole foods because something like Diet Coke Plus would score about a million (lots of vitamins, few if any calories), rendering ANDI utterly meaningless to the masses and downright offensive to people like me.


2)       “nutrients per calorie” is a far more biologically meaningful and physiologically relevant concept than “calories per gram.”

  1. “Calories per gram” can be too easily manipulated.  E.g., one ounce (~28 grams) of soybean oil has 248 kilocalories: 248 kilocalories / 28 grams ? 9 kcal/g.  Add it to an ounce of water and you get 248 / 56 ? 4.4 kcal/g.  It’s still the same nutritionally, but the “caloric density” was halved by trickery.
  2. “Nutrients per calorie” is relatively unchangeable.  Let’s say there are 14 grams of omega-6 fatty acids in an ounce of soybean oil; that would be 14 grams per 248 kcal.  Add it to an ounce of water and it’s still true.  Drink it on the moon and it’s still true (relatively).

However,

1)      ANDI selectively quantifies only one aspect of a food’s nutritional value.  It is an important aspect, but please note that a diet based on high ANDI foods would be nutritionally inadequate.  Furthermore, there are highly relevant health parameters that ANDI completely ignores.  More questions:

  1. Shouldn’t more important nutrients be given a higher score?
  2. Shouldn’t excess amounts of a nutrient detract from the score?
  3. What about other non-nutritive health-promoting properties of a food?  E.g., foods that are healthier than indicated by their ANDI score:
    1. i.      foods that have some as-of-yet undiscovered nutrients
    2. ii.      foods that indirectly promote health (like pre- or pro-biotics)

2)      Furthermore, ANDI is fundamentally flawed in its application to foods whose value is based at least partially on the actual calories themselves.

  1. Fuhrman uses the ANDI score on fats, which score dismally low because they contain few “nutrients” and a lot of calories.  Thus, industrially-modified, partially-hydrogenated trans fat-rich soybean oil has the same ANDI score as olive oil.
  2. Animal proteins, including grass-fed beef, wild salmon, and pastured eggs, also score incredibly low.  These foods are far more healthful than many most others, essential for life (unlike kale, which is the highest-scoring ANDI food), and much of their value is contained in the quality of their calories.
    1. i.      the fatty acids in salmon are healthy in and of themselves; they don’t contain any nutrients per se; they ARE the nutrient.  But ANDI doesn’t take this into account; it views all fatty acids as empty calories, a grave mistake.
    2. ii.      the same goes for animal proteins.  Eggs, for example, are higher in protein quality than any other food on the ANDI scale yet they score quite low.  And getting a bio-equivalent amount of protein from lower quality plant proteins would require consuming many more calories.

The failure of ANDI to incorporate any measure of fat or protein quality is its demise; why it is unable to stand alone as an indicator of healthiness… a diet consisting exclusively of high ANDI foods is incompatible with life.  A protein deficiency would be vastly more severe than a low ANDI diet, and on a lighter note, the fish oil fatty acids would provide much greater benefits than a high ANDI diet.  These nutritional factors play too big a role in determining healthspan and quality of life to be ignored.

BUT, ANDI is nice in its simplicity, and it works very well for most plant-based foods.  E.g., spinach and cabbage have very high ANDI scores; rice, grains, and pasta have very low ANDI scores.

The diets of many cultures are based almost exclusively on low-ANDI foods.  This is largely because it is much easier to produce enough calories to feed a village than to produce enough nutrients.  Starvation is deadlier than dermatitis.  In the Western world, however, we are fighting a different battle: you need to eat a LOT of empty calories in order to get enough nutrients, but then you get fat.


calories proper


fat skinny people

The metabolically obese normal weight phenomenon
or
Fat skinny people.

In general, type II diabetes is preceded and possibly even caused by obesity.  However, there is a marked variation in the amount of excess fat mass that individuals accumulate prior to developing frank diabetes.  IOW, some people are morbidly obese for over 10 years before succumbing to diabetes while others become diabetic much sooner.  In fact, some people, known as “metabolically obese normal weight” (MONW), are technically lean (BMI < 25) when they develop the metabolic syndrome.

While genetics and environmental exposures play a role in determining the amount of fat mass an individual can ‘safely’ accumulate, nutrition is probably the most important factor.

The BMI scale was developed, in part, to specify these ‘safe,’ or more appropriately ‘healthy’ ranges of adiposity.  That is why there are sex and even international variations.  For example, a healthy BMI for people in East Asia is lower than that of Americans.  This is not because of the difference in average body weight between the two populations, but rather due to the observation than people in East Asia develop obesity-related health problems at lower levels of adiposity than Americans.

This is, in part, mediated by diet.

Characteristics of diet patterns in metabolically obese, normal weight adults (Korean National Health and Nutrition Examination Survey III, 2005) (Choi et al., 2010 Nutrition, Metabolism & Cardiovascular Diseases)

This is essentially the Korean equivalent to the United States’ NHANES

In brief, the authors of this study collected data from ~3,000 normal weight Koreans and divided them into two groups: ‘metabolically healthy normal weight (MHNW)’ and ‘metabolically obese normal weight (MONW)’ (remember everyone in both groups had a ‘healthy’ BMI; overweight and obese people were specifically excluded).  MONW was defined as having a waist circumference > 90cm (35″) for men or >80cm (31″) for women and at least 3 out of the next 4 criteria: elevated triacylglycerols, low HDL, hypertension, and impaired fasting glucose.  Basically, MONW is the Metabolic Syndrome for skinny people.

Disclaimer: The MONW population differs from MHNW in more ways than their diet and metabolic profile, and these differences probably have a lot to do with why they eat what they eat.  For example, MONW are less educated and makeless money than MHNW.  But for the purposes of this blog post, it is not why they eat what they eat, but rather what they eat.  And as seen in the table below, MONW eats fewer calories per day and a higher proportion of carbohydrates than MHNW (at the expense of protein and fat).

Divide and conquer


MONW ingests less protein (78 vs. 67 g/d) on an absolute basis, which is most likely why they have more fat mass at the same body weight (lower protein intake accommodates less muscle mass).  And it is this lower protein intake that most closely correlates with being metabolically obese:


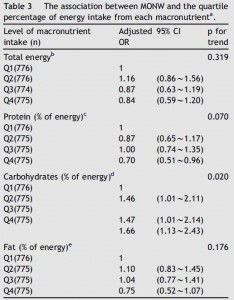
Importantly, these odds ratios were controlled for confounding variables such as age and gender.  The last analysis is probably the most interesting, and it breaks down the risk of being metabolically obese by the intake of each macronutrient (in quartiles) for the entire population.


Increasing intakes of total energy, protein, or fat do not increase the risk of being metabolically obese.  Only carbohydrates significantly increased the risk across all 4 quartiles of intake.  The tolerable upper limit of carbohydrate intake was statistically extrapolated to be 59.9% of calories… which is within the recommended range of 55% – 70%.  IOW, by following the government’s dietary recommendations you will be significantly increasing your risk of metabolic derangement.  A prudent recommendation, based on these data, would be more like “less than 50%” (since no lower limit or deficiency was established).

Last but not least, and I’m not sure why, but the metabolic derangements associated with a low protein high carbohydrate diet were far more severe in women than men.

So the take-home message?  A low protein, high carbohydrate diet was significantly associated with metabolic deterioration, and this was most likely not simply correlative.  No, I contend this dietary pattern caused metabolic obesity.

One final note before moving on:  this study was specifically not looking at causes of obesity.  Obese and overweight people were excluded and this study focused solely on lean individuals.  Therefore we can’t conclude that any of the variables that cause metabolic obesity also cause weight gain… although they might (and probably do), the study was simply not designed that way.

Dear Drs Choi and Park,

If you’re reading this, please re-assess diet, blood parameters, insulin sensitivity, and body composition in these subjects in 5-10 years and report your findings.  I am very curious to see how metabolic obesity affects health outcomes.

Sincerely,

Bill Lagakos


In a similar study on the NHANES III data (United States), Zhu and colleagues analyzed risk factors for the metabolic syndrome across a wide range of BMIs.  In order to be more directly comparable to Choi’s findings, we’ll only consider the subjects with a health BMI (less than 25).

Lifestyle behaviors associated with lower risk of having the metabolic syndrome (Zhu et al., 2004 Metabolism)

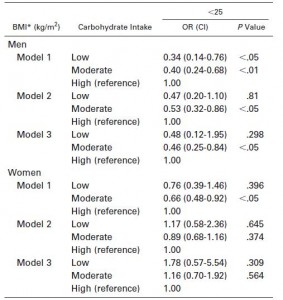
The table below is divided by gender, regression analysis (Model 1 is the most direct correlation, while Models 2 and 3 control for a variety of confounding factors), and carbohydrate intake (less than 30% of total calories, 30-60%, and greater than 60%).


The correlation between MONW and a high carb intake is stronger for men than women, but present in both.  For men, the association is not weakened by controlling for confounding factors (age, race, education, and income).  For women, the association is present in the general population (Model 1) but no longer exists in Models 2 and 3.  In both men and women, a high-fat diet was associated with lower risk of MONW in Model 1 but not 2 or 3.

In Choi’s study on a Korean population, a high carb and low protein diet was associated with MONW, with a smaller influence of low fat.  In Zhu’s study on an American population, high carb and low fat were associated with MONW and protein intake wasn’t analyzed.  Collectively, these results suggest that lean people eating a diet high in carbs but low in protein and fat are the most likely to have metabolic abnormalities and possibly may be unwittingly diabetic.  Skinny on the outside, fat on the inside.  A carbohydrate intake greater than 60% of total calories significantly increased the risk of MONW in Choi’s population, while an intake of less than 30% significantly decreased the risk in Zhu’s study.  Greater than 60% = bad.  Less than 30% = good.


Calories proper