Category Archives: Fish

Vegetable oil fatty acids are not essential. 

They are conditionally essential at best, only if docosahexaenoic acid (DHA) is lacking.  We can’t synthesize omega 3 fatty acids, and indeed they do prevent/cure certain manifestations of “essential fatty acid (EFA) deficiency” (Weise et al., 1958), but DHA can do all that and more.  Not that I recommend this, but a diet completely devoid of 18-carbon vege oil fatty acids will not produce EFA deficiency in the presence of DHA. (“vege,” rhymes with “wedge”)

Essential fatty acid metabolism


The “parent essential oils” are linoleic acid (LA) and alpha-linolenic acid (ALA).  The others, which I think are more important and the truly “essential” ones are eicosapentaenoic acid (EPA), arachidonic acid (AA), but mostly just DHA.

The first manifestation of EFA deficiency is dermatitis (Prottey et al., 1975).  Some people say LA is necessary to prevent this, but it would be better phrased as “LA prevents dermatitis;” not “LA is necessary to prevent dermatitis.”  All of the evidence suggesting LA is essential is in the context of DHA deficiency.

Technically, we can convert a bit of ALA to DHA, estrogen helps, testosterone doesn’t (women have better conversion rates)… and I’d speculate that the reverse is probably easier (DHA –> ALA).

Continue reading

Evolution stole this dude’s circadian rhythm

I got a laugh out of this one; not for the actual content, but because of how the authors worded their findings.  They sure love their fishies.

We have two very closely related fish, both Mexican tetra, Astyanax mexicanus, one with eyes who lives on the surface, and another who’s blind and lives in dark caves (“Pachon”).  It’s thought that they were the same species one day; divergent evolution.


note: eyeless

note: eyeless

The blind ones are circadian arrhythmic (Moran et al., 2014).  Surface-dwellers are more active during the day than night (blue line, left figure below), and their free-running circadian clock maintains this in the absence of photic input (blue line, right figure).  The blind ones, on the other hand, exhibit no circadian rhythm in the light or dark (orange lines):


Circadian rhythm metabolism


Cave-dwellers are circadian arrhythmic.  This is both in their natural photoperiod (ie, darkness) and in light-dark conditions (which is technically an environmental mismatch, but since they’re eyeless, it doesn’t really matter).

Continue reading

Paleo Plants and Carnivory

From what I gather, it’s been difficult to pinpoint the role of plants in the diet of our ancestors for a variety of reasons.  For example, evidence of plants on cooking tools and dental remains is suggestive but doesn’t disprove the possibility that said evidence came from preparing the plants for some other purpose (eg, tools, weapons, or medicine), or that the stomach contents of an herbivore was ingested (which gets partial credit).

That said, after reviewing a few studies on the topic (see below), it’s safe to say that plants were eaten, probably frequently, and the types & quantities varied seasonally & geographically.  Collectively, the data suggest we aren’t carnivores.

…you had to have something to hold you over until the next fish fell prey to your deadly hunting spear…

Continue reading

Fish, dark chocolate, and red wine.

Fish oil fatty acids: EPA & DHA.

I’ve read that EPA tends to show slightly better results in outcomes related to mood, whereas DHA tends to be slightly better for cognition.  Not mutually exclusive; probably a lot of overlap.  This meta-analysis by Martins showed EPA fared better than DHA for depressive symptoms (2009); another one here, stressing the high %EPA relative to %DHA necessary for improvements (Sublette et al., 2011).  Whereas the reverse is true for certain cognitive outcomes in this study by Sinn and colleagues (2012).  Very few studies test EPA vs. DHA directly, and their effects on metabolism are relatively similar.  They’re the ball bearings of fatty acids.epa dpa dha

Continue reading

Non-sequiter nutrition V. The neglected fats

update: I learned a new trick.  If you haven’t been receiving the regular updates to which you subscribed, it’s probably due to spam filters.  Cure: find the update in your spam folder and reply to it.  You don’t have to write anything, but the mere act of replying somehow tells your spam filter that the email wasn’t spam.  It works for gmail, fwiw.

I [still] predict public approval of dietary fat will come along at a snail’s pace, and it won’t be a pan-approval of dietary fat at all.  Instead, it will be selective approval of individual fatty acids.  First, it was the medium chain fatty acids found in MCTs and coconut oil.  Then, it was the fish oil fatty acids eicosapentaenoic and docosahexaenoic acids (EPA and DHA, respectively).  Then, palmitoleic acid.  Corn and soybean oil, on the other hand, are being appropriately recognized as bad.  The utter hatred and fear of saturated fats is starting to wane, and we might even see a transition back to lard before I die (circa 2113).  But today’s post is on another topic: trans fats, oxidized fish oils, and dairy fat.

What happens when dietary fat is abused?

Continue reading

Mediterranean Diet Fail – Nutrition Disinformation, Part I.

Do not get your hopes up, do not pass GO!  do not collect $200.  The Mediterranean Diet.  Fail.

Primary Prevention of Cardiovascular Disease with a Mediterranean Diet (Estruch et al., 2013)

This is one of the biggest diet studies we’ve seen in a while, and no doubt it was a very good one.  It very effectively put the Mediterranean Diet to the test.

I felt compelled to write about this study out of fear for the nutrition disinformation that it would likely inspire.  The Mediterranean Diet is associated with all good things, happiness, red wine and olive oil; whereas the Atkins Diet is associated with artery clogging bacon-wrapped hot dogs and a fat guy who died of a heart attack.  Nutrition disinformation.

If you ran a diet study with 3 intervention groups for 5 years, and by the end of the study everybody (in all 3 groups) was on more prescription medications, would you conclude any of the diets were “healthy?”  If so, then we should work on your definition of “healthy.”

Study details: big study, lasted roughly 5 years, and the diet intervention was pristine.  Mediterranean diet plus extra virgin olive oil (EVOO) vs. Mediterranean diet plus nuts vs. low fat control.  They even used biomarkers to confirm olive oil and nut intake (hydroxytyrosol and linoleate, respectively).  Compliance was good.

Continue reading

what is our proper “natural” diet?

Figuring out how best to eat, physiological insulin resistance, and an homage to pioneering nutrition research.

Insulin resistance, as we know it today, is associated with poor nutrition, obesity, and the metabolic syndrome.  But it’s FAR more interesting than that.  Indeed, it could even save your life.  At the time when the pioneering studies discussed below were occurring, the researchers had no idea insulin resistance was going to become one of the most important health maladies over the course of the following century.  Furthermore, these somewhat-primitive studies also shed some light, possibly, on how we should be eating.  hint: it might all come down to physiological insulin resistance.

The reduced sensitivity to insulin of rats and mice fed on a carbohydrate-free, excess fat diet (Bainbridge 1925, Journal of Physiology)

Rats were fed either a normal starch-based diet (low fat), or a high butter diet (low carb) for one month, then fasted overnight and injected with a whopping dose of insulin (4 U/kg).  First, take a guess, what do you think happened and why.  Then, click on the table below.

To make a long story short, all the starch-fed rats died while all the butter-fed rats lived.

On a high-fat zero-carb diet, plasma insulin levels are low.  Insulin is low because there no carbs (i.e., it’s supposed to be low).  Under conditions of low insulin, unrestrained adipose tissue lipolysis leads to a mass exodus of fatty acids from adipose tissue.  These fatty acids accumulate in skeletal muscle and liver rendering these tissues insulin resistant.  But this doesn’t matter, because insulin sensitivity is unnecessary when there aren’t any carbs around.  So if that rogue research scientist who’s always trying to jab you with a syringe filled with insulin actually succeeds, you won’t die.  The high-fat diet prevents insulin-induced hypoglycemic death.  This is physiological and absolutely critical insulin resistance.

To determine if this was specific to dairy (butter) or a general effect of a high fat zero carb diet, Bainbridge repeated the experiments with lard.  Lo-and-behold, lard-fed rats were just as fine as those dining on butter.  

To be sure, these studies exhibited a high degree of animal cruelty… but their simplicity is laudable.  And Bainbridge’s findings are not an isolated case.

Studies on the metabolism of animals on a carbohydrate-free diet.  Variations in the sensitivity towards insulin of different species of animals on carbohydrate-free diets (Hynd and Rotter, 1931)

Instead of starch, lard, and butter, Hynd and Rotter used milk and bread, cheese, and casein.  And their findings were essentially identical to Bainbridge’s: mice, rats, or rabbits fed carbohydrate-free diets were insulin resistant and protected against insulin-induced tragedies.

The interesting finding was in kittens, who sadly maintained insulin sensitivity when fed fish (high protein) or cream (high fat).

You’re probably thinking: why would I say any state of heightened insulin sensitivity is “sad?”  WELL, I say “sad” because we’re talking about physiological insulin resistance; a condition when resistance to the hypoglycemic effect of insulin is essential, and lack thereof is incompatible with survival.  To be clear: 1) kittens remain insulin sensitive on high fat and protein diets; and 2) this is OK because there aren’t any rogue research scientists running around trying to jab them with insulin.  While I can’t say for sure, this might have something to do with what kittens are supposed to eat, i.e., their natural diet.  High protein and fat diets won’t make them insulin resistant because unlike rodents, that is their normal diet.  (real mice eat fruits and seeds; laboratory mice eat pelleted rodent chow; cartoon mice eat cheese.)   Lard causes ectopic lipid deposition in insulin sensitive tissues in rodents because they aren’t accustomed to it.  Mice are optimized to eat a high carb diet.  Kittens eat protein and fat, usually in the form of mice.  But when given bread, kittens develop insulin resistance.  There is no bread in mice.

While we shouldn’t base our diet around the possibility of turning a corner and being jabbed with a syringe filled with insulin, perhaps we are simply more similar to kittens.  Hypercaloric diets loaded with sugar, excess carbohydrates, and empty calories cause [pathological] insulin resistance (which could theoretically save your life if a rogue research scientist jabbed you with insulin), whereas the opposite is true for diets high in fat and protein.  This is repeatedly demonstrated in diet intervention studies, most recently in the notorious Ebbeling study (Missing: 300 kilocalories).  When people were assigned to the very low carbohydrate diet, insulin sensitivity was significantly higher than when they were on low fat diets:Soapbox rant: I’m not saying low carb is what we are supposed to eat.  Nor am I saying it is the optimal diet.  IMHO any diet which excludes processed junk food and empty calories is “healthy.”  The Paleo diet isn’t healthy because some nutritionista says it’s what we are supposed to eat; Paleo is healthy for the same reason as Atkins, Zone, South Beach, and a million others: no junk food.

Maybe the diet we’re supposed to eat has nothing to do with the healthiest diet.  Maybe not.  But it probably isn’t bad for you.  just sayin’

calories proper

LPL, insulin, and diet, Op. 62

There are many ways to address the etiology of obesity and insulin resistance (or insulin resistance and obesity).  For example, you can follow a group of healthy people for a long time and compare those who become insulin resistant with those who don’t; alternatively, you can study a population who is predisposed to insulin resistance (e.g., offspring of type II diabetics)… regarding the latter, although it’s kind of grim, apparently healthy children of obese or diabetic parents are often in an intermediate state of insulin resistance.  It’s impossible to exclude a genetic component, but I believe environmental influences are dominant: the poor diet and lifestyle of obese parents is just as likely as obesogenic DNA to be passed on to their children.

The main reason to be concerned with these questions is that there is considerable disagreement about the specific cause of obesity and insulin resistance; i.e., which came first and does one cause the other?  Or do they simply share a common cause (e.g., hyperinsulinemia)?   I currently lean toward the “common cause” hypothesis.  Alternatively, I’d say “it’s complicated”  … insulin resistance is not one isolated phenomenon, but the end result of many interconnected biological processes.  This has important implications for treatment and prevention- if, for example, hyperinsulinemia causes obesity and/or insulin resistance, then reducing insulin levels or preventing insulin spikes should be prioritized.  And mitochondria also seem to be important.

Regulation of mitochondrial biogenesis by lipoprotein lipase in muscle of insulin-resistant offspring of parents with type 2 diabetes (Morino et al., 2012 Diabetes)

The subjects in this study were body weight and age-matched; the only major difference was impaired glucose tolerance and the presence of at least one diabetic parent in the “insulin-resistant offspring” group.  They took muscle biopsies and found, somewhat surprisingly, one of the biggest differences was the content of lipoprotein lipase (LPL).LPL is responsible for hydrolyzing circulating triacylglycerols (from chylomicrons and VLDL) to free fatty acids for tissue uptake.  Thus, this finding suggests muscle from insulin-resistant offspring is not as good at sequestering fatty acids (despite these subjects oftentimes having paradoxically higher intramuscular fat levels).  This corresponded with lower PPAR activity, mitochondria volume, and fatty acid oxidation.  And interestingly, in a set of follow-up cell culture experiments, they found that the fish oil fatty acid EPA (but not DHA) could correct this deficiency.

Ideally, we would like LPL activated in muscle (to take up and oxidize fatty acids) and inhibited in adipose (to prevent fat cells from getting fatter).  Fortunately, there are some relatively easy ways this can be accomplished… exercise selectively activates LPL in muscle and inhibits it in adipose, while insulin does the exact opposite.  So eat salmon, exercise, and avoid insulinogenic sugars and carb-rich foods!

Tissue-specific responses of lipoprotein lipase to dietary macronutrient composition as a predictor of weight gain over 4 years (Ferland et al., 2012 Obesity)

This study was a little more complicated than inferred by the title.  First, they took healthy adults, measured body composition and then assessed adipose vs. skeletal muscle LPL activity in the fasted and fed states after 2 weeks of a high fat or high carb diet.  To make a long story short:In lean subjects (table above), a high carb meal (after 2 weeks of high carb dieting) markedly increased adipose LPL by 153% (top row) (this is bad), and modestly increased it in skeletal muscle (80%, second row).  The high fat meal (after 2 weeks of high fat dieting) caused a smaller increase in adipose LPL (92% vs. 153%) and bigger increase in skeletal muscle LPL (80% vs. 100%) (this is good).  Thus, a high carb diet caused the most detrimental changes in adipose LPL while a high fat diet caused the most beneficial changes in skeletal muscle LPL.

Next, they compared these acute effects with changes in body composition over the course of 4 years and found that the biggest predictor of increased fat mass was the response of adipose LPL to a high carb diet.

The Morino study showed that increased skeletal muscle LPL was positively associated with insulin sensitivity, while the Ferland study showed that a high carb diet increased adipose LPL and this was positively associated with fat mass gain over 4 years.  Skeletal muscle LPL is good, adipose LPL is bad (Rx: EPA [salmon], exercise, and keep insulin levels low).

Dare I say “nutrient partitioning?”  this might be one way to reduce body fat without drastically cutting calories.  Adopt an LPL-modulating diet and lifestyle!  The effect on fat mass not huge, about a pound per year, but that adds up to 10 pounds over the course of a decade… obesity doesn’t happen overnight.


calories proper

Insulin per se

This recent manuscript nearly slid beneath the radar… almost stopped reading at the abstract until the word “nifedipine” appeared (among its widely pleiotropic effects, nifedipine also lowers insulin).

The series of experiments described below demonstrate one aspect of the scientific method reasonably well.  None of the individual experiments, when viewed in isolation, really prove the hypothesis.  But the researchers tested it with a variety of widely different methods and all of the results went in the same direction.  The hypothesis in question: insulin causes fat gain, and hyperinsulinemia per se, not macronutrients or calories, is the root cause.

This group has previously shown that sucrose is more detrimental than fish oil is beneficial toward obesity and glycemic control.

High glycemic index carbohydrates abrogate the anti-obesity effect of fish oil in mice (Hao et al., 2012 AJP)

Divide and conquer
Mouse study.  Lots of diets, in brief:
Pair fed: high fish oil (180 g/kg) plus 13%, 23%, 33%, and 43% sucrose (by weight, switched out for casein [a poor choice IMO])
High fish oil (180 g/kg) plus sucrose, fructose, glucose, low GI carbs, and high GI carbs.
That’s a lot of diets.  Kudos.

As expected, higher sugar and lower protein intakes enhance weight gain (yes, even when pair-fed similar calories [i.e., a calorie is not a calorie]) and this is at least partly due to reduced metabolic rate (as per the poor man’s energy expenditure test- measuring body weight before and after 24 hours starvation [higher weight loss = higher metabolic rate]):High sucrose-fed mice also had more inflamed adipose tissue and less thermogenic brown fat, which likely contributed to their glycemic dysregulation and elevated adiposity.

Sucrose is comprised of glucose and fructose, so to determine which component was causing obesity, they fed mice high fish oil diets plus either sucrose, glucose, or fructose.  Interestingly, the glucose group gained as much weight as the sucrose group.  Since the fructose group gained the least amount of weight, the researchers attributed the sucrose-induced obesity to insulin! (fructose doesn’t elicit an insulin response; and insulin levels were lowest in the fructose group).

Body weight, plasma insulin, and glucose tolerance:

I. Thus far: glucose and sucrose cause obesity by stimulating insulin secretion.  Glycemic deterioration is worst in the glucose-fed group because they were consuming most of the most insulinogenic sugar: glucose.  It was lower in the sucrose and fructose groups because sucrose contains only half as much glucose as pure glucose, and fructose contains no glucose.  IOW, these data suggest hyperinsulinemia per se causes obesity and insulin resistance.  Gravitas.

They further tested this by comparing high and low GI diets which cause higher and lower insulin levels, respectively.  As expected, the low GI diet led to less weight gain, and significantly lower insulin levels and adipose tissue accumulation compared to the high GI diet:

II. Thus far: high insulin levels, whether induced by glucose, sucrose, or high GI starch, lead to obesity.

They next took a non-dietary approach by artificially increasing insulin levels with glybenclamide in fish oil-fed mice to see if hyperinsulinemia could still cause obesity.  The results weren’t robust, but the higher insulin levels tended to increase adiposity even in mice fed the anti-obesogenic fish oil diet. 

In the experiment, the opposite approach was taken: nifedipine was used to lower insulin.  The use of octreotide and diazoxide has been used in a similar context with similar results in humans, discussed HERE and HERE.Again, the results were not robust, but when viewed collectively a picture begins to emerge: raising insulin levels, whether it is with a high glucose or sucrose diet, a high GI diet, or glybenclamide increases adipose tissue growth; and conversely, lowering insulin levels, whether it is with a less insulinogenic sugar diet (fructose), a low GI diet, or nifedipine decreases adipose tissue growth.  Oh yeah, and low carb works too.


calories proper


Fish blog, take I

Fish blog, take I

Eat fish people.  No, don’t eat “fishpeople,” … nevermind.  I am a strong proponent of eating salmon so this blog was created to figure out which is the best kind to eat.  Priorities are 1) least toxins and 2) best fatty acid composition.

Round 1. Metals in salmon: Farmed vs. wild

A survey of metals in tissues of farmed Atlantic and wild Pacific salmon (Foran et al., 2004)

Farmed Atlantic salmon were sourced from North American commercial suppliers and included salmon from British Columbia, Chile, Maine, and Norway.  They got 10 fish from 3 different suppliers in each region: 4 regions x 3 suppliers/region x 10 fish = 120 fish. Species: Farmed Atlantic (didn’t realize that was a species…  this is one of those “a-duh” moments).

Wild salmon were from suppliers in Alaska, British Columbia, and Washington for a total of 6 batches of 10 fish.  Species: chum & coho.

Methods: BORing

Results:

Divide and conquer.

The amount of metals in Farmed Atlantic (filled bars) and wild salmon (open bars):

Co, cobalt; Cu, copper; Sr, strontium; Cd, cadmium; Pb, lead; U, uranium; As, arsenic; MeHg, methylmercury.

The authors noted some statistically significant differences in cobalt, copper, cadmium (all modestly higher in wild salmon), and the nontoxic “organic” arsenic (higher in farmed salmon), but while those differences may be significant statistically, they don’t look significant physiologically.  (if the authors wanted to make the differences look bigger, perhaps they should have opted for a linear ordinate; or maybe they just wanted to squeeze everything in one figure instead).  Interestingly, similar levels of these metals were found regardless of where the salmon came from.  I would’ve imagined a Farmed Atlantic salmon from Norway would be vastly different than a Farmed Atlantic from British Columbia.  Guess not.

As expected, mercury content was correlated with body size (higher up on the food chain, more mercury accumulation), but this is pretty much meaningless to the consumer because we have no idea of the fish’s weight when it was intact.  IOW, the salmon on the bottom (figure below) would have less mercury than the one on the top,

But I have no way of knowing who these came from (salmon fillets):

Fortunately, salmon is a relatively “clean” fish, so it doesn’t really matter.

Back to the data.

Oddly, the authors noted that wild salmon were longer than Farmed Atlantic, but mercury content didn’t correlate with length, only body size (fatness? muscularity? weird).

acceptable levels for metals in fish:

Fig 2


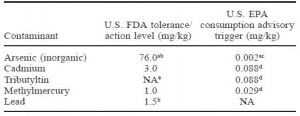
Farmed Atlantic and wild (Coho & Chum) salmon were equivalent and well beneath both the FDA and the far more stringent EPA’s limits.  On a side note, I learned that the FDA allows a higher amount of contaminants because they are talking about exposure to each contaminant individually.  The EPA is stricter because they are taking into consideration the fact that we are exposed to multiple contaminants simultaneously (“toxic world,” and all that jazz).  For example, you would be safe consuming a fish with 76.0 mg/kg inorganic arsenic if that were the only toxin to which you were exposed.  But when multiple toxins are present, as they most likely are in our diet, the cutoff for inorganic arsenic is set at 0.002 mg/kg.  The FDA allows 38,000 times more inorganic arsenic than the EPA; that seems grievously negligent but in reality, the amount in commercial fish is significantly lower.  It’s like saying you must be at least 2 inches tall, by the EPA’s standards, or 5 inches tall, by the FDA’s standards, to go on a rollercoaster ride.

One last note: the limit for methylmercury consumption is ~0.4 ug/kg/d, which is approximately 28 ug/d (for a 70 kg or 154 lb person).  Even the most toxic salmon has methylmercury  <100 ug/kg, meaning you can safely eat ~300 grams (10 ounces or about 3 servings) of salmon per day.


Round 2. Pesticides: Farmed vs. wild salmon

Global Assessment of Organic Contaminants in Farmed Salmon (Hites et al., 2004 Science)

These researcher went big-time, 700 fish! (appr. 1 ton of salmon)

Sources:

  1. Farmed Atlantic salmon: 8 major commercial suppliers.
  2. Wild Pacific salmon: chum, coho, chinook, pink, & sockeye from 3 different regions
  3. My personal favorite: Farmed Atlantic salmon fillets purchased by undercover secret agents in 16 cities in North America and Europe (Boston, Chicago, Denver, Edinburgh, Frankfurt, London, Los Angeles, New Orleans, New York, Oslo, Paris, San Francisco, Seattle, Toronto, Vancouver, and Washington DC.)
  4. They even analyzed samples of fish food covering over 80% of the global supply

Side note: even if your exact city or region isn’t on this list, I suspect the conclusions can be reasonably applied to just about everywhere.

Results:

Fig 3


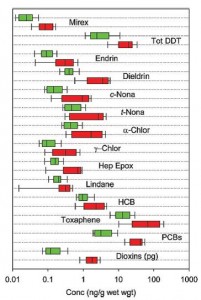
Figure 3. Contaminants present in Farmed (red) or wild (green) salmon.  It looks like for every contaminant Farmed and wild are similar, but Farmed always has a little more (beware of the deceptive log scale)

Fig 4


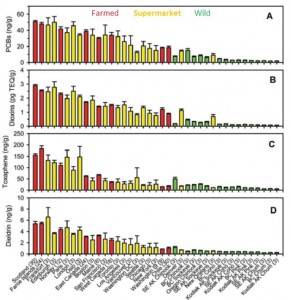
This figure is very busy.  Concentration of contaminants in Farmed (red), supermarket Farmed Atlantic fillets (yellow), and wild (green) salmon.  Focus on the cities listed at the bottom: the ones toward the left (Europe) are ultra-toxic; the ones on the right (Pacific [Alaska]) are the most safe.  Conclusion from these data: Wild Pacific is safe, Farmed Atlantic is intermediate, and anything European is toxic.  Avoid Scottish salmon like the plague.  And microwave popcorn.

WRT farmed salmon, it looks like most of the problem is with the fish feed:

Figure 5.  Contaminants in fish feed.  European fish food is bunk (red bars).  Pacific (BC British Columbia, Chile) and Atlantic (E. Canada) fish foods are OK (both in gray bars).


Conclusions:

WRT metals (Foran study): no difference between Farmed Atlantic and wild Pacific

WRT contaminants (Hites study): wild Pacific (Alaska and British Columbia, also Chilean) is good, supermarket Farmed Atlantic fillets are OK, and European is bad.


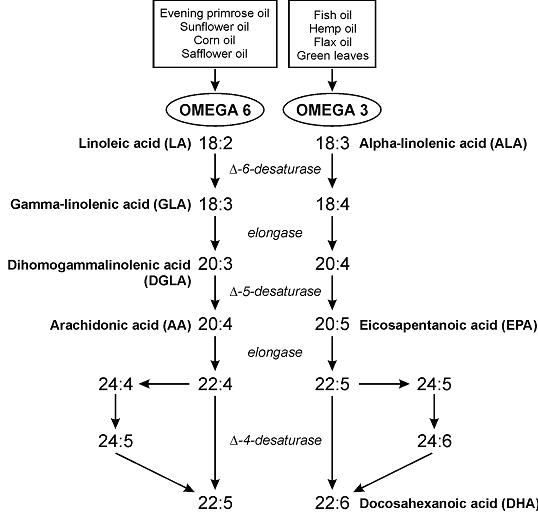
Round 3.  Fatty acid composition as per www.NutritionData.com


Atlantic: Farmed vs. wild

Pacific coho: farmed vs. wild vs. silver Alaska native

Alaska: Silver native vs. King chinook


Total EPA + DHA:  1st place goes to farmed Atlantic: 1,966 mg EPA + DHA per 100 grams.  On average, farmed salmon contains more EPA + DHA than wild salmon.

2nd place goes to silver Alaska native coho: 1,876 mg EPA + DHA

3rd place goes to wild Atlantic 1,436 mg EPA + DHA

Lowest were: wild Pacific coho (1,085 mg), Alaska King Chinook (1,150 mg), and wild Pacific Sockeye (1,172 mg).  (all three are Pacific.)

-Farmed salmon has more EPA + DHA than wild salmon

-Atlantic salmon has more EPA + DHA than Pacific salmon

And there were even species-differences:  Alaskan Silver native coho (1,876 mg) had much higher EPA + DHA than Alaskan King Chinook (1,150 mg).

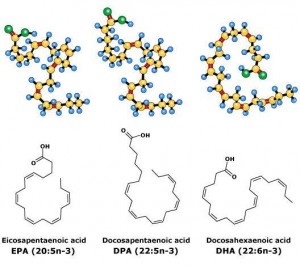
EPA/DHA ratio: not entirely sure about the significance of this, but perhaps EPA is slightly better for physical health while DHA is slightly better for mental health (?) (future blog post topic?)

Average 0.6 (all salmon have slightly more EPA than DHA).  Most EPA (highest EPA/DHA ratio): Farmed Atlantic & wild Pacific Sockeye (0.8).  Most DHA (lowest EPA/DHA ratio): wild Atlantic (0.3) & Silver Alaska native coho (0.4)


Conclusions:  WRT contaminants, wild Pacific seems best, farmed Atlantic is OK, and European is bad.

WRT EPA + DHA, Farmed Atlantic and silver Alaska native coho were best and wild Pacific was the lowest.  IMHO the benefits of DHA & EPA outweigh the malefits of contaminants because the dose of EPA + DHA in a serving of salmon is sufficient to reap many of the benefits of EPA & DHA, while the dose of contaminants is too low to cause harm.  Therefore I’m going to stick with Farmed Atlantic.  OOTH if silver Alaska native coho is similar to Kodiak salmon (which I think it is), then it has the lowest contaminants as per the Hites study and 2nd highest EPA DHA as per nutritiondata.

Winner: wild Pacific Kodiak or silver Alaska native coho

2nd place: Farmed Atlantic

Affiliate linksjoin Binance and get some cryptoassets or download Honeyminer and get some Bitcoins for free! And now you can mine Bitcoin from your Chromebook!

Still looking for a pair of hot blue blockers? Carbonshade and TrueDark are offering 15% off with the coupon code LAGAKOS and Spectra479 is offering 15% off HERE. If you have no idea what I’m talking about, read this then this.

20% off some delish stocks and broths from Kettle and Fire HERE

If you want the benefits of  ‘shrooms but don’t like eating them, Real Mushrooms makes great extracts. 10% off with coupon code LAGAKOS. I recommend Lion’s Mane for the brain and Reishi for everything else

Join Earn.com with this link.

Start your OWN Patreon campaign!

calories proper