
If you haven’t read Petro Dobromylskyj’s posts about Physiological Insulin Resistance, then just go do it. Highly recommended.
I’ve written about it as well, albeit in a slightly different context:
What is our proper “natural” diet?
40 years ago a group of researchers turned ketosis into poetry.
But now on to more pressing matters. In the food deprived state, Physiological Insulin Resistance develops, in part, to spare muscle (yea yea yeah and glucose for the brain). But how much of this is due to ‘food deprivation’ per se as opposed to something else… like circadian rhythms.
Exhibit A. Hat tip to Dr Kruse for writing about this TED talk. In it, Jessa describes a crab that lives on the beach; scurries up the beach when the tide comes in and back down when it goes out. Scientists captured a few, flew them halfway around the world and put them in little tilted cages. The crabs still scurried up & down, in time with the tides.
Exhibit B. Evidence that the lunar cycle affects human sleep. People tend to sleep a little less during the full moon. Subjects were recruited to a windowless sleep lab and had no exposure to sun/moon/anything outside – they maintained this circadian rhythm for 3 days (Cajochen et al., 2013). Different from the crabs, but similar (in a way).
Exhibit C. Circadian Disruption Leads to Insulin Resistance and Obesity (Shi et al., 2013)
There are times when Physiological Insulin Resistance is relevant, important, and even vital. this isn’t one of them. I had no intention of writing about this study but it literally took hours to figure out how the researchers teased apart the effects of feeding, or when the mice last dined, from the circadian rhythm’s impact on insulin resistance… but I think they did. Like this: 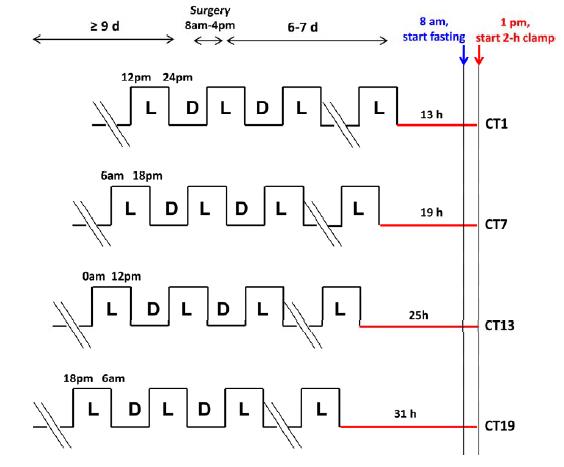
There were four conditions (mice normally sleep during the day and eat at night):
divide and conquer
13h CT1 = for 13 hours after their last “light’s on (sleepy)” phase, the mice lived in red dim light. The experiment took place in next 1st theoretical daylight hour, when the mice are usually just crawling into bed.
19h CT7: 19 hours of red dim light, the experiment began in the 7th theoretical daylight hour, when the mice would’ve been deep asleep.
25h CT13: 25 hours of red dim light; experiment began in the 13th hour after theoretical lights on, which is equivalent to the 1st hour of lights off (12 hour light-dark cycle), when the mice would’ve normally just started eating. This circadian period is directly opposite from 13h CT1.
31h CT19: 31 hours of red dim light, experiment began in the 19th hour after theoretical lights on, which is equivalent to the 7th hour of lights off (19-12=7), when the mice would’ve been actively eating. This circadian period is directly opposite from 19h CT7.
As the time in red dim light progressed, we can only assume that their strict 12 hour feeding regimen slowly shifted into a more grazing-like pattern. But they were all deprived of food for 5 hours prior to insulin sensitivity testing; only difference was [presumably] a shift in their circadian rhythm. The researchers could’ve done another group, 37h CT25, but this would’ve put the mice back into the 1st theoretical daylight hour (sleepy time). Had the results been that 31h CT19 mice were the most insulin resistant, we could’ve said some critical threshold was reached after 25 hours in red dim light. But that didn’t happen. The mice showed [Physiological] Insulin Resistance at 19h CT7; when they would’ve normally been sleeping – highly inactive, and their ‘natural’ fasting period. They were just as ‘fasted’ as the other groups, but were the only ones showing signs of [Physiological] Insulin Resistance that appears to have been programmed by an innate ‘free-running’ circadian rhythm devoid of light cues. Then, when they were back in normal feeding time (25h CT13), insulin sensitivity was restored, presumably to prepare for the onslaught of CIAB.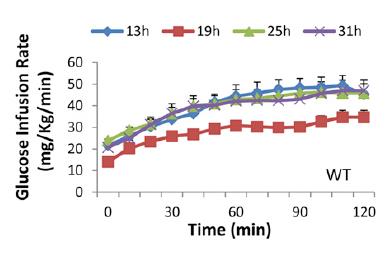
Tangent: those glucose infusion rates are a little lower than expected for healthy mice with Lean Metabolisms, likely due to the low insulin infusion rate (2 mU/kg*min). The use of a lower insulin infusion rate allows for the assessment of liver and skeletal muscle insulin sensitivity, because hepatic glucose production is almost completely shut down by higher insulin infusion rates, meaning any differences in the glucose infusion rate are more likely due to skeletal muscle insulin sensitivity. I only ever clamped at 8 mU/kg*min because 2 mU isn’t very effective in obese insulin resistant mice. Neither infusion rate (2 or 8 mU/kg*min) is very good at assessing adipose insulin sensitivity because lipolysis is inhibited at very low levels of insulin. Their clamping technique was pretty good because they sampled arterial blood (as opposed to repeated tail nicking), and their mice were free-living (as opposed to enclosed in a restrainer which essentially completely immobilizes them [stressful]). Notably, this wasn’t lost on the authors :/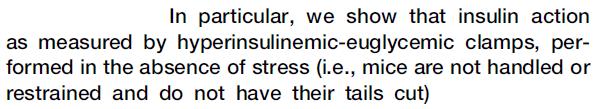
Back to the data: in agreement with the presence of Physiological Insulin Resistance, glucose levels were higher at 19h CT7… and they went back down 6 hours later. All of this was seemingly pre-programmed by a “free-running circadian rhythm” devoid of light cues.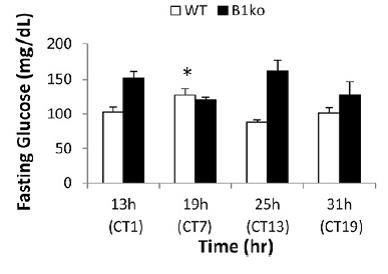
“Light” is an important input into the circadian system, but I couldn’t find anything peculiar with their circadian disruption protocol to account for the appearance of Physiological Insulin Resistance exactly when we would’ve expected it had the mice been eating normally. Pretty cool.
Update: Tim Noakes & Bryan Davis tweeted a bunch of quotes & opinions about The poor, misunderstood calorie; some of which are hashtagged #TPMC. Check ’em out!